Age-Friendly Communities and Mortality Risk Among Older Adults in China: A Study Based on the Chinese Longitudinal Healthy Longevity Survey (CLHLS)
Abstract
Background: With the progression of aging and urbanization, the relationship between the external environment and health has gained increasing attention. This study examined the association between comprehensive community environments and mortality risk among older adults from a macro-level perspective.
Methods: We used longitudinal data from the 2014–2018 Chinese Longitudinal Healthy Longevity Survey (CLHLS), which includes information on community environments. Guided by the World Health Organization’s framework for age-friendly communities, we constructed five domains: natural environment, medical support, living security, public education, and community support. Multilevel binary logistic regression models were used to examine the associations between these age-friendly community characteristics and mortality risk among older adults in 2018.
Results: Among 3810 older adults (aged 60–117), a better natural environment (OR: 0.78 and 95% CI: 0.60–1.02) and stronger living security (OR: 0.41 and 95% CI: 0.26–0.65) were significantly associated with reduced mortality risk. Specifically, in communities with better medical support, older adults who were ethnic minorities, lived alone, or had higher household incomes exhibited a lower risk of mortality. Living security was particularly effective in reducing mortality risk among those living with a spouse. However, drinkers in communities with stronger community support showed a higher mortality risk.
Conclusion: Mitigating environmental degradation and ensuring equitable service provision are essential for building age-friendly communities. While enhancing the health and wellbeing of all older adults is important, particular attention should be given to vulnerable groups, such as those with lower incomes or limited family support.
1. Introduction
China has experienced two major demographic shifts over the past 4 decades: population aging and urbanization. By 2020, the number of people aged 60 and above had reached 264 million, marking the onset of a super-aging society [1]. At the same time, a growing proportion of older adults are expected to reside in urban areas, highlighting the increasing importance of creating livable environments tailored to their needs. Addressing these dual challenges requires a comprehensive approach that integrates age-friendly community design, equitable access to healthcare and social services, and sustainable urban planning. Proactively fostering such environments not only improves the quality of life for older adults but also supports China’s broader goals of inclusive development and social well-being amid rapid demographic change.
A key strategy in addressing these challenges is the concept of “Aging in Place,” which emphasizes enabling older adults to remain in their own homes or communities for as long as possible. This approach supports independence, comfort, and a sense of belonging by adapting homes, community services, and support networks to meet their evolving needs [2]. The living environment, where older adults spend most of their time, plays a critical role in shaping physical health, life satisfaction, and other health outcomes_particularly for those who remain primarily at home or within their communities [3, 4]. Recognizing this, the World Health Organization (WHO) introduced the concept of “Age-friendly Cities and Communities” (AFCC), which promotes active aging by optimizing opportunities for health, participation, and security, thereby enhancing quality of life in older age [5]. While the content of AFCC frameworks varies across countries, institutions, and scholars [6], most emphasize three key dimensions: the physical environment (e.g., outdoor and built spaces), the social environment (e.g., social participation and inclusion), and service provision (e.g., access to information, healthcare, and recreational opportunities).
Previous studies have shown that various environmental factors are associated with health outcomes. For example, Zeng and colleagues found that social, economic, and natural environmental factors significantly affect the physical and mental health, overall well-being, and mortality risk of older adults [7]. Environmental deterioration has a more pronounced impact on older adults’ health and survival than on younger individuals [8]. Air pollution, for instance, increases the risk of stroke, cardiovascular disease, respiratory illnesses, and other conditions among older people [9]. Conversely, a favorable natural environment can protect health: increased rainfall is associated with cleaner water and more favorable conditions for outdoor activity [10], which help maintain physical function, aerobic capacity, and overall fitness in older age [11]. The social environment also plays a vital role. Communities with better access to resources and well-developed services can improve health outcomes [12], and higher levels of social participation have been shown to significantly reduce mortality risk [13].
Three theoretical frameworks help explain how the environment influences health. Social Integration Theory highlights that collective emotions and shared moral values connect individuals within a group, offering social support that protects health [14]. This underscores the importance of emotional connection and community support in building age-friendly communities. Person–Environment Fit Theory, proposed by Lawton, emphasizes improving the external environment to enhance its positive effects on the health of older adults [15]. Environmental Behavioral Theory focuses on the interaction between individual behavior and the environment, emphasizing the alignment of personal actions with community features to foster supportive settings for aging [16]. Together, these theories emphasize the importance of considering both individual characteristics and community-level factors in promoting older adults’ health and well-being.
Recent international research on age-friendly cities has explored the intersection of urbanization and aging, highlighting the need for cities to adapt to the growing needs of older adults. Much of this work, particularly from Western countries, has explored how urban design and policy can promote inclusivity and accessibility for aging populations [17, 18]. These studies offer valuable insights for countries like China, where urbanization is rapidly transforming community structures and service systems. This study aims to contribute to this global dialogue by examining the environmental factors influencing mortality risk among older adults in China, a country undergoing similar rapid urbanization that reshape communities and their support systems.
Despite growing interest in age-friendly communities and their impact on older adults’ health, significant research gaps remain. Many studies focus on specific health dimensions, such as mental or physical health, while overlooking broader indicators of healthy longevity. Mortality, as examined in this study, serves as a critical and comprehensive measure of healthy longevity, reflecting the cumulative effects of health and environmental factors on survival in later life. This highlights the importance of including mortality into aging research to gain a more holistic understanding of health outcomes. In addition, few studies have examined how different environmental dimensions interact to influence older adults’ mortality risk. Given the central role of community environments in the lives of older adults, this study aims to offer a comprehensive understanding of how age-friendly community features can support longevity and promote healthier aging.
2. Data and Methods
2.1. Data
The data for this study were drawn from the Chinese Longitudinal Healthy Longevity Survey (CLHLS), a nationally representative, population-based longitudinal survey initiated in 1998. The 2014–2018 CLHLS dataset, the most recent wave, included older adults aged 60 and above at the baseline (2014). The survey collected comprehensive information on surviving older adults, including demographic characteristics, daily behaviors, socioeconomic status, family structure, and caregiving needs. For deceased older adults, information was obtained from family members, including details on the time and cause of death.
Community-level information was also collected in the 2014 CLHLS, including data on the natural environment, population composition, economic development, social welfare, residential consumption, and overall environmental quality.
The 2014 baseline included 7192 individuals, of whom 1525 were lost to follow-up, and 2226 had died by 2018. After excluding individuals younger than 60 (n = 18) and those with incomplete key information (primarily geographic, household economic, smoking, and drinking data; n = 1839), a total of 3810 individuals from 398 different communities were included in the final analysis. We compared the distributions of key variables between the full baseline sample (n = 7192) and the final analytical sample (n = 3810), and the results suggest that the retained data remain broadly representative of the original cohort.
2.2. Measures
The dependent variable in this study is the survival status of respondents as of 2018, measured as a binary outcome: 0 indicating the respondent was alive, and 1 indicating the respondent had died. This variable captures mortality as a comprehensive indicator of health and longevity, reflecting the cumulative effect of individual, social, and environmental factors on the well-being and survival of older adults over the study period.
The key independent variables were age-friendly community-level factors, identified across five dimensions derived from the CLHLS data based on the AFCC framework: natural environment, medical support, living security, public education, and community support (Table 1). The natural environment dimension included topographic features, categorized as plains, hills, mountains, or other landforms (e.g., basins, plateaus, or other nonterrestrial geographic areas). Additional variables encompassed average temperatures in January and July, the proportion of frost-free days per year, annual precipitation, and the range between maximum and minimum temperature.
| Dimensions | Variables | Descriptive statistics | ||
|---|---|---|---|---|
| Observations | Mean value | Standard deviation | ||
| Natural environment | Percentage of plains (%) | 398 | 46.30 | 36.87 |
| Percentage of hill (%) | 398 | 27.17 | 26.87 | |
| Percentage of mountain (%) | 398 | 13.15 | 21.17 | |
| Percentage of other landforms (%) | 398 | 13.37 | 17.93 | |
| Average temperature in July (°C) | 398 | 27.85 | 2.73 | |
| Average temperature in January (°C) | 398 | 1.81 | 8.05 | |
| Maximum temperature (°C) | 398 | 39.01 | 2.42 | |
| Minimum temperature (°C) | 398 | −10.60 | 9.97 | |
| Proportion of frost-free days in a year (%) | 398 | 69.19 | 16.48 | |
| Precipitation (m) | 398 | 1.04 | 0.43 | |
| Medical support | Percentage of get adequate medical services (%) | 398 | 92.94 | 15.52 |
| Insurance coverage rate of public free medical (%) | 398 | 4.27 | 13.88 | |
| Living security | The proportion of pension as the main source of income (%) | 398 | 30.12 | 35.21 |
| The proportion of relative payment as the main source of income (%) | 398 | 43.88 | 36.01 | |
| The proportion of local government subsidies as the main source of income (%) | 398 | 7.15 | 18.06 | |
| The proportion of work income as the main source of income (%) | 398 | 7.92 | 16.68 | |
| Percentage of income can meet the daily expenses (%) | 398 | 79.33 | 27.11 | |
| Coverage of public old age insurance (%) | 398 | 28.38 | 34.38 | |
| Coverage of pension (%) | 398 | 27.15 | 34.46 | |
| Number of institutions for older adults (per 10,000 people) | 398 | 0.22 | 0.23 | |
| Public education | The proportion of illiterates above the age of 6 (%) | 398 | 4.25 | 2.82 |
| Community support | Coverage of personal care services (%) | 398 | 5.99 | 17.61 |
| Coverage of family care services (%) | 398 | 28.78 | 35.05 | |
| Coverage of psychological counseling services (%) | 398 | 10.58 | 22.33 | |
| Coverage of daily shopping services (%) | 398 | 7.90 | 20.18 | |
| Coverage of social entertainment services (%) | 398 | 23.08 | 31.44 | |
| Coverage of legal aid services (%) | 398 | 14.55 | 27.46 | |
| Coverage of medical insurance services (%) | 398 | 41.04 | 37.54 | |
| Coverage of neighborhood services (%) | 398 | 28.21 | 34.17 | |
For medical support, the percentage of older adults receiving adequate medical services and medical insurance coverage was aggregated from baseline individual-level data. Living security was assessed based on respondents’ primary sources of income, with proportions calculated for four main income sources: pensions, payments from relatives, local government subsidies, and employment. In addition, the proportion of respondents whose income met their daily expenses was computed. Coverage of old-age insurance and pensions was also calculated. The CLHLS further provided information on the total number of nursing institutions at the baseline, which was standardized to reflect the number of institutions per 10,000 residents. Illiteracy rates, defined as the proportion of individuals aged six and above without at least primary education, were calculated using the total population and the number of individuals with education beyond primary school, as provided by the community dataset.
Regarding community support, respondents were asked about the availability of various services in their communities. Coverage of seven types of community services—personal care, family care, psychological counseling, daily shopping, legal aid, medical insurance, and neighborhood services—was aggregated at the community level using data reported by individual respondents.
The control variables were categorized into two groups: individual demographic and socioeconomic characteristics (including age, gender, ethnic group, education, marital status, self-rated economic status, household income equalization, and health insurance) and health behaviors (smoking status and alcohol consumption). The baseline distributions of these variables are presented in Table 2.
| Individual level (n = 3810) | |
|---|---|
| Survival status | Alive (2264, 59.4%) |
| Died (1546, 40.6%) | |
| Age | 60–117, mean = 85.26 |
| Gender | Male (1578, 46.1%); |
| Female (2051, 53.9%) | |
| Ethnic group | Han (3379, 88.7%); |
| Other (431, 11.3%) | |
| Education | Uneducated (2097, 55.0%); |
| Educated (1713, 45.0%); | |
| Marital status | Married (1496, 39.3%); |
| Other (2314, 60.7%) | |
| Smoking status | Nonsmoker (2661, 69.8%); |
| Smoker (614, 16.1%); | |
| Ex-smoker (535, 14.1%) | |
| Alcohol drinking status | Nondrinker (2789, 73.2%); |
| Drinker (607, 15.9%); | |
| Ex-drinker (414, 10.9%) | |
| Self-rated economic status | Good (692, 18.2%); |
| Fair (2685, 70.5%); | |
| Poor (433, 11.3%) | |
| Living arrangements | Alone (630, 16.5%); |
| With household member (2293, 60.2%); | |
| In an institution (48, 1.3%); | |
| With spouse only (839, 22.0%) | |
| Health insurance | No health insurance (347, 9.1%); |
| NCMS (2752, 72.2%); | |
| URBMI (272, 7.2%); | |
| UEBMI (331, 8.7%); | |
| PFMS (108, 2.8%) | |
| Equalization of income | 0–10, mean = 1.6 |
| Age-friendly score at community level | |
| Natural environment | 0.39–3.28 (mean = 1.26) |
| Medical support | 0.00–1.95 (mean = 0.88) |
| Living security | 0.27–2.06 (mean = 1.05) |
| Public education | 0.00–2.16 (mean = 1.65) |
| Community support | 0.31–1.82 (mean = 0.54) |
- Note: NCMS, New Rural Cooperative Medical System.
- Abbreviations: PFMS, Public Free Medical Services; UEBMI, Urban Employee Basic Medical Insurance; URBMI, Urban Residents Basic Medical Insurance.
2.3. Methods
Some age-friendly community variables exhibited high correlations, indicating significant multicollinearity within the model. To address this issue and better capture the overall effect of each domain of age-friendly communities, principal component analysis (PCA) and the entropy evaluation method (EEM) were employed to generate composite measures for each dimension of the AFCC framework (Table A1) [19]. Given the hierarchical structure of the CLHLS dataset, with individuals nested within communities, and the study’s aim to examine age-friendly characteristics and mortality risk concurrently, multilevel logistic regression models were considered appropriate [20]. All models were estimated using MLwiN 3.13 software [21].
For model development, Model 1 controlled for all individual-level variables to assess the impact of personal characteristics on mortality. Subsequently, Models 2a–2e introduced each dimension of age-friendly communities separately, while Model 2f included all dimensions simultaneously to evaluate their combined effects on older adults’ mortality risk. Finally, Models 3 tested cross-level interactions between community-level age-friendly features and individual characteristics. Interactions that were not statistically significant were excluded from the final presentation.
3. Results
All results are presented in Table 3. Among individual characteristics, the risk of mortality increased by 9% with each additional year of age (OR = 1.09 and 95% CI: 1.08–1.11). Women exhibited a 57% lower mortality risk compared with men (OR = 0.43 and 95% CI: 0.34–0.56). Educated individuals had a 32% lower risk of mortality than those without education (OR = 0.68 and 95% CI: 0.54–0.85). Married older adults had a reduced risk of mortality compared with their unmarried counterparts (OR = 0.38 and 95% CI: 0.29–0.50). Smokers faced a 68% higher risk of mortality compared with nonsmokers (OR = 1.68 and 95% CI: 1.26–2.23). Regarding individual economic status, compared with those reporting poor economic status, older adults with fair or good economic status had a 49% and 54% lower risk of mortality (ORs = 0.51 and 95% CI: 0.38–0.68 and OR = 0.46 and 95% CI: 0.31–0.67, respectively). Furthermore, older adults living alone had a notably lower mortality risk than those with household member (OR = 0.58 and 95% CI: 0.43–0.78).
| Model 1 | Model 2a | Model 2b | Model 2c | Model 2d | Model 2e | Model 2f | |
|---|---|---|---|---|---|---|---|
| OR (95% CI) | OR (95% CI) | OR (95% CI) | OR (95% CI) | OR (95% CI) | OR (95% CI) | OR (95% CI) | |
| Fixed part | |||||||
| Individual level variables | |||||||
| Age | 1.09(1.08–1.11)∗∗∗ | 1.09(1.08–1.11)∗∗∗ | 1.09(1.08–1.11)∗∗∗ | 1.09(1.07–1.11)∗∗∗ | 1.09(1.08–1.11)∗∗∗ | 1.09(1.08–1.11)∗∗∗ | 1.09(1.08–1.11)∗∗∗ |
| Female (ref: Male) | 0.43(0.34–0.56)∗∗∗ | 0.44(0.34–0.57)∗∗∗ | 0.43(0.33–0.56)∗∗∗ | 0.44(0.34–0.56)∗∗∗ | 0.44(0.34–0.57)∗∗∗ | 0.44(0.34–0.56)∗∗∗ | 0.44(0.34–0.57)∗∗∗ |
| Han Chinese (ref: Others) | 1.04(0.74–1.48) | 1.07(0.75–1.52) | 1.05(0.74–1.49) | 0.98(0.69–1.39) | 1.04(0.73–1.47) | 1.02(0.72–1.45) | 1.00(0.70–1.42) |
| Educated (ref: Uneducated) | 0.68(0.54–0.85)∗∗∗ | 0.68(0.54–0.86)∗∗∗ | 0.68(0.54–0.86)∗∗∗ | 0.67(0.53–0.85)∗∗∗ | 0.69(0.54–0.87)∗∗∗ | 0.67(0.53–0.85)∗∗∗ | 0.69(0.54–0.87)∗∗∗ |
| Married (ref: Other) | 0.38(0.29–0.50)∗∗∗ | 0.38(0.29–0.50)∗∗∗ | 0.38(0.29–0.50)∗∗∗ | 0.38(0.29–0.50)∗∗∗ | 0.38(0.29–0.50)∗∗∗ | 0.39(0.29–0.51)∗∗∗ | 0.38(0.29–0.50)∗∗∗ |
| Smoking status (ref: Nonsmoker) | |||||||
| Smoker | 1.68(1.26–2.23)∗∗∗ | 1.68(1.27–2.24)∗∗∗ | 1.67(1.26–2.22)∗∗∗ | 1.69(1.27–2.25)∗∗∗ | 1.68(1.26–2.23)∗∗∗ | 1.68(1.27–2.24)∗∗∗ | 1.70(1.28–2.26)∗∗∗ |
| Ex-smoker | 1.36(0.99–1.88)∗ | 1.36(0.98–1.88)∗ | 1.36(0.98–1.88)∗ | 1.42(1.02–1.96)∗∗ | 1.36(0.99–1.89)∗ | 1.37(0.99–1.89)∗ | 1.42(1.03–1.97)∗∗ |
| Alcohol drinking status (ref: Nondrinker) | |||||||
| Drinker | 0.79(0.60–1.05) | 0.79(0.60–1.05) | 0.80(0.60–1.05) | 0.81(0.61–1.07) | 1.26(0.60–1.05) | 0.80(0.61–1.06) | 0.81(0.61–1.08) |
| Ex-drinker | 1.35(0.99–1.86)∗ | 1.35(0.99–1.85)∗ | 1.36(0.99–1.87)∗ | 1.36(0.99–1.86)∗ | 1.35(0.99–1.86)∗ | 1.36(1.00–1.87)∗ | 1.36(0.99–1.87)∗ |
| Self-rated economic status (ref: Poor) | |||||||
| Fair | 0.51(0.38–0.68)∗∗∗ | 0.51(0.38–0.68)∗∗∗ | 0.51(0.38–0.69)∗∗∗ | 0.51(0.38–0.69)∗∗∗ | 0.51(0.38–0.68)∗∗∗ | 0.51(0.38–0.68)∗∗∗ | 0.52(0.39–0.70)∗∗∗ |
| Good | 0.46(0.31–0.67)∗∗∗ | 0.46(0.31–0.67)∗∗∗ | 0.46(0.32–0.67)∗∗∗ | 0.45(0.31–0.66)∗∗∗ | 0.46(0.31–0.67)∗∗∗ | 0.46(0.32–0.67)∗∗∗ | 0.46(0.31–0.66)∗∗∗ |
| Living arrangements (ref: With household member) | |||||||
| Alone | 0.58(0.43–0.78)∗∗∗ | 0.58(0.43–0.78)∗∗∗ | 0.57(0.42–0.77)∗∗∗ | 0.59(0.43–0.79)∗∗∗ | 0.58(0.43–0.78)∗∗∗ | 0.58(0.43–0.79)∗∗∗ | 0.58(0.43–0.78)∗∗∗ |
| In an institution | 2.13(0.79–5.78) | 2.11(0.78–5.74) | 2.15(0.79–5.84) | 2.15(0.80–5.81) | 2.09(0.77–5.69) | 2.20(0.81–5.99) | 2.14(0.79–5.80) |
| With spouse only | 1.72(1.32–2.24)∗∗∗ | 1.71(1.31–2.23)∗∗∗ | 1.72(1.32–2.24)∗∗∗ | 1.81(1.39–2.36)∗∗∗ | 1.72(1.32–2.24)∗∗∗ | 1.73(1.33–2.25)∗∗∗ | 1.78(1.37–2.32)∗∗∗ |
| Health insurance (ref: None) | |||||||
| NCMS | 1.27(0.86–1.89) | 1.28(0.86–1.89) | 1.29(0.87–1.92) | 1.20(0.81–1.78) | 1.26(0.85–1.88) | 1.27(0.86–1.89) | 1.21(0.82–1.81) |
| URBMI | 1.03(0.59–1.77) | 1.03(0.60–1.79) | 1.04(0.60–1.80) | 1.04(0.60–1.80) | 1.01(0.60–1.80) | 1.02(0.59–1.77) | 1.10(0.63–1.90) |
| UEBMI | 1.46(0.87–2.45) | 1.47(0.87–2.46) | 1.49(0.88–2.50) | 1.54(0.92–2.60) | 1.49(0.88–2.51) | 1.46(0.87–2.46) | 0.62(0.96–2.73)∗ |
| PFMS | 0.98(0.46–2.09) | 0.98(0.46–2.09) | 1.13(0.52–2.46) | 1.01(0.47–2.16) | 0.99(0.46–2.12) | 0.97(0.45–2.07) | 1.12(0.51–2.43) |
| Equalization of income | 0.95(0.87–1.03) | 0.95(0.87–1.03) | 0.95(0.88–1.03) | 0.96(0.88–1.04) | 0.95(0.87–1.03) | 0.95(0.88–1.04) | 0.96(0.89–1.04) |
| Community-level variables | |||||||
| Natural environment | 0.88(0.68–1.14) | 0.78(0.60–1.02)∗ | |||||
| Medical support | 0.45(0.16–1.26) | 0.58(0.21–1.62) | |||||
| Living security | 0.43(0.27–0.67)∗∗∗ | 0.41(0.26–0.65)∗∗∗ | |||||
| Public education | 0.84(1.76–1.24) | 0.84(0.57–1.24) | |||||
| Community support | 0.57(0.26–1.24) | 0.66(0.30–1.42) | |||||
| Random part: level 2 community | |||||||
| Variance | 0.41 | 0.39 | 0.42 | 0.39 | 0.41 | 0.42 | 0.37 |
| Intraclass correlation (ICC) | 11.1% | 10.6% | 11.3% | 10.6% | 11.1% | 11.3% | 10.1% |
- Note: NCMS: New Rural Cooperative Medical System.
- Abbreviations: PFMS, Public Free Medical Services; UEBMI, Urban Employee Basic Medical Insurance; URBMI, Urban Residents Basic Medical Insurance.
- ∗p < 0.1.
- ∗∗p < 0.05.
- ∗∗∗p < 0.01.
The results from Models 2a–2e reveal different associations between different dimensions of age-friendly communities and mortality risk. Better living security was significantly associated with reduced mortality risk inModel 2c (OR = 0.43 and 95% CI: 0.27–0.67). In Model 2f, which included all individual and community-level variables, the natural environment and living security dimensions showed significant associations with one’s mortality risk, with ORs of 0.78 (95% CI: 0.60–1.02) and 0.41 (95% CI: 0.26–0.65), respectively.
The results of the cross-level interactions between age-friendly community dimensions and individual characteristics reveal significant associations in several cases (Table 4). Specifically, interactions were significant between medical support and ethnic groups (Model 3a), medical support and living arrangements (Model 3b), medical support and income (Model 3c), living security and living arrangements (Model 3d), and community support and drinking status (Model 3e). These findings are illustrated in Figures 1(a)–1(e).
| Model 3a (medical support ∗ ethnic) | Model 3b (medical support ∗ living arrangements) | Model 3c (medical support∗ equalization of income) | Model 3d (living security ∗ living arrangements) | Model 3e (community support ∗ alcohol drinking status) | |
|---|---|---|---|---|---|
| OR (95% CI) | OR (95% CI) | OR (95% CI) | OR (95% CI) | OR (95% CI) | |
| Fixed part | |||||
| Medical support ∗ (ethnic: Other) | 0.02(0.00–0.70)∗∗ | ||||
| Medical support ∗ (living arrangements: Alone) | 7.53(1.35–42.1)∗∗ | ||||
| Medical support ∗ (living arrangements: In an institution) | 0.28(0.01–8.50) | ||||
| Medical support ∗ (living arrangements: With spouse only) | 2.92(0.54–15.7) | ||||
| Medical support ∗ (equalization of income) | 0.67(0.46–0.98)∗∗ | ||||
| Living security ∗ (living arrangements: Alone) | 1.00(0.46–2.19) | ||||
| Living security ∗ (living arrangements: In an institution) | 0.76(0.14–4.13) | ||||
| Living security ∗ (living arrangements: With spouse only) | 0.48(0.24–0.96)∗∗ | ||||
| Community support ∗ (drinking status: Drinker) | 5.59(1.68–18.6)∗∗∗ | ||||
| Community support ∗ (drinking status: Ex-drinker) | 1.49(0.42–5.33) | ||||
| Random part: level 2 community | |||||
| Variance | 0.34 | 0.28 | 0.30 | 0.34 | 0.34 |
| Intra-class correlation (ICC) | 9.4% | 7.8% | 8.4% | 9.4% | 9.4% |
- Note: The results for the fixed effects are omitted.
- ∗∗p < 0.05.
- ∗∗∗p < 0.01.
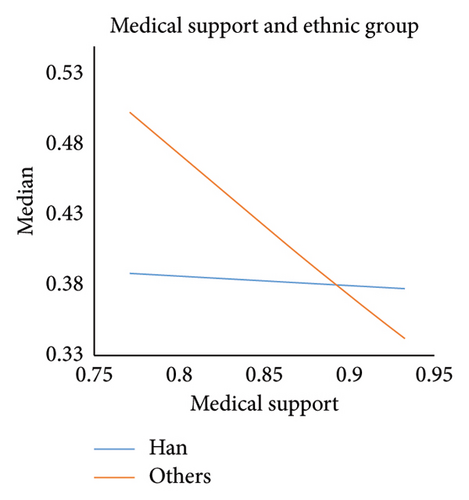
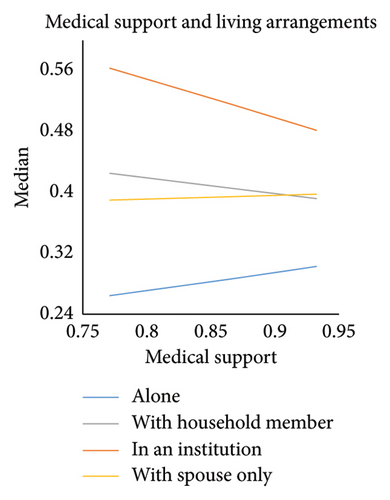
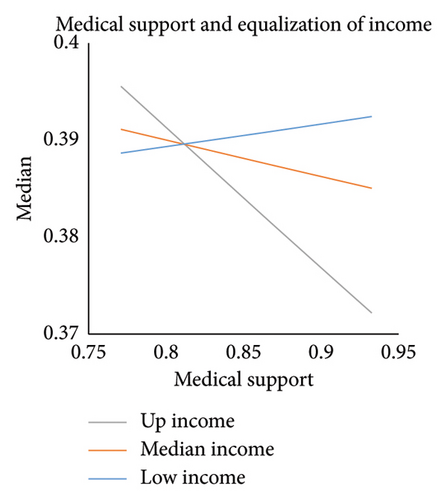
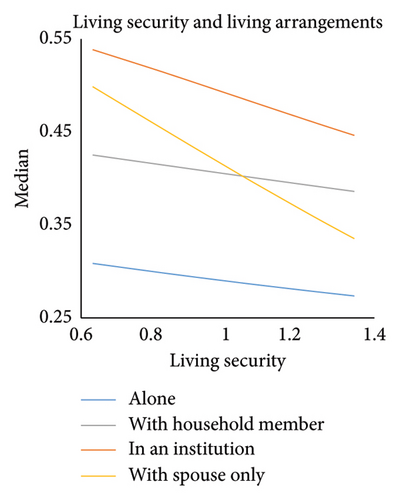
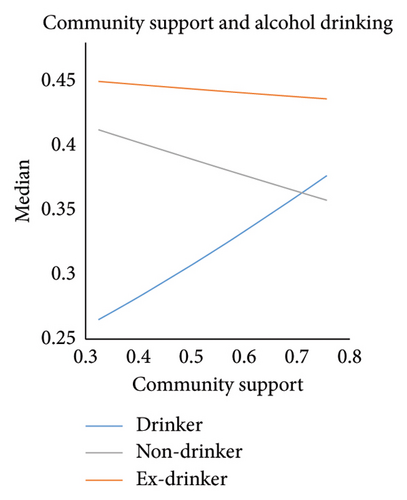
Figure 1(a) shows that higher levels of medical support slightly reduced mortality risk among Han Chinese but significantly decreased mortality risk for older adults from ethnic minority groups. Regarding living arrangements, Figure 1(b) highlights convergence trends across different living arrangements as medical support increased. The most pronounced convergence occurred between older adults living alone and those living in institutions when medical support was low, with the gap narrowing as medical support improved. Among all groups, older adults living in institutions faced the highest mortality risk, followed by those living with both a spouse and household members, while those living alone had the lowest risk. Older adults in institutions tended to be older or in poorer health, but their mortality risk declined in communities with greater medical support. This may reflect variation in the quality of institutional care and the distribution of health resources across communities—areas with stronger medical support systems may provide better care and services within institutions, ultimately reducing mortality risk for this vulnerable population. Onsersely, those living alone may be healthier and more independent; the slight increase in mortality risk observed in communities with greater medical support could reflect unmeasured vulnerabilities, such as social isolation or underutilization of available services.
In areas with low medical support, Figure 1(c) shows that high-income groups faced a higher mortality risk than low-income groups. However, as medical support improved, the mortality risk for high-income groups decreased significantly, while the risk for low-income groups showed a slight increase. Figure 1(d) illustrates that higher levels of living security reduced mortality risk across all living arrangements, with the most pronounced reduction observed among those living only with their spouse. Finally, Figure 1(e) highlights the interaction between community support and drinking status. As community support increased, drinkers experienced a notable rise in mortality risk, while nondrinkers experienced a decline. Interestingly, the overall risk of death was highest among older adults who abstained from alcohol, and this group’s mortality risk remained largely unaffected by variations in community support levels.
Table 2 also presents the intraclass correlation coefficients (ICCs) for all models. The ICCs from Model 1 and the fully adjusted models ranged from 10.1% to 11.3%, indicating that approximately one-tenth of the variance in older adults’ mortality risk was attributable to differences between communities. In the cross-level interaction models, community-level variance declined modestly, with ICCs ranging from 7.8% to 9.4%. This reduction suggests that incorporating interaction terms between individual- and community-level variables helped account for some of the between-community variation. Nevertheless, a meaningful portion of mortality risk remains shaped by contextual factors, reinforcing the importance of addressing both individual and community characteristics in research on aging and health.
4. Discussion
This study examined the associations between age-friendly community and mortality risk among older adults in China. The findings provide valuable insights to guide the development of age-friendly communities, including enhancements to the built environment and the implementation of policies tailored to the needs of older adults.
The natural environment, assessed using temperature and air quality indicators, demonstrated a significant negative association with mortality risk among older adults. Previous research has identified a U-shaped relationship between temperature and mortality in China, where both extreme cold and heat substantially increase mortality rates [22]. Older adults are especially vulnerable to such environmental extremes due to heightened sensitivity associated with aging [23]. As aging is accompanied by declining physical resilience, complex terrain and fluctuating climatic conditions further exacerbate daily challenges, increasing susceptibility to illness, injury, and mortality.
From a community and urban planning perspective, addressing “urban diseases” is essential. Measures such as creating urban ventilation corridors and incorporating green open spaces can help mitigate the urban heat island effect and improve the thermal environment [24]. These efforts contribute to fostering safer and more supportive living environments for older adults.
This study found no significant association between medical support at the community level and mortality among older adults, which may be attributed to the focus of China’s public medical system on cost containment rather than comprehensive, person-centered care. In contrast, social living security measures, such as stabilizing income sources for older adults, providing pension or old age insurance, and increasing access to nursing facilities, can effectively enhance resilience to aging-related risks. Older adults with uncertain incomes are more inclined to participate in pension programs and invest in nursing services, as the stability and low risk of returns serve as preventive savings for future emergencies [25].
In urban settings, living security plays a critical role in enhancing both income and consumption, thereby creating a virtuous cycle of economic improvement [26]. Prioritizing the availability of urban living security services and addressing residents’ satisfaction with these services is essential. Although previous studies have shown that community support—such as psychological, medical, legal, and recreational services—can reduce depression, mitigate chronic disease risk, and protect cognitive health in older adults [27–29]; this study did not find a significant association between community support and mortality. This suggests that current community support systems in China may not yet be sufficiently effective in lowering mortality risk among older adults.
The interaction results between age-friendly community dimensions and individual characteristics reveal notable findings for vulnerable groups. A substantial decrease in mortality risk mong ethnic minorities in areas with higher levels of medical support highlights the effectiveness of China’s efforts to promote more equitable health services allocation since 2012. Increased investment in medical resourcesin the central and western regions—where most ethnic minorities reside—has steadily increased [30], contributing to improved outcomes in these populations.
The results also indicate that medical support reduced mortality risk disparities across different living arrangements. Older adults living in institutions experienced a decline in mortality risk, while those living alone or with only a spouse saw slight increases. In general, older adults in China tend to have lower educational levels and more conservative mindsets, which may limit their ability to seek medical care independently—especially in the absence of children.
Significant differences in the impact of medical support were also observed across income groups. High-income families were typically more willing to invest in medical services [31], while low-income families often faced greater health challenges and must spend more to mitigate risks [32]. For high-income groups, these expenditures improve life satisfaction and security; for low-income groups, they represented a financial burden. In addition, a quality gap in medical services persists between these income groups. Despite government subsidies, low-income families still face greater financial strain and receive comparatively lower-quality care.
Living security was associated with reduced mortality risk among older adults across all living arrangements, with the strongest effect among those living with a spouse. Older adults with higher economic status were more likely to live independently, while marriage provides additional social and economic support, enabling them to cope more effectively with aging [33, 34]. Improved living security may further strengthen this protective effect.
The model also revealed an interaction between community support and drinking behavior. Older adults who consumed alcohol experienced higher mortality risk in areas with stronger community support. One possible explanation is that enhanced community support may encourage greater social participation, which could inadvertently lead to increased alcohol consumption, and it associated negative healtheffects [35]. Since drinking is often a social activity in Chinese communities, unlike smoking, no similar interaction was observed for smoking behavior.
5. Conclusion
The findings of this study highlight the effectiveness of age-friendly community features in reducing mortality risk among older adults in China, offering valuable insights for enhancing urban design, healthcare systems, and social services for an aging population. Although social welfare has long been a priority in the context of aging, disparities in access to services remain a significant concern—particularly for vulnerable subgroups such as institutionalized older adults, ethnic minorities, and those from lower-income backgrounds. These inequities are shaped by institutional constraints, uneven resource distribution, and the interaction between socioeconomic status and public service accessibility.
To address these challenges, healthcare policy could go beyond resource expansion and focus on equity and service integration. National and local governments should implement a tiered healthcare subsidy system targeting low-income older adults and ethnic minority regions. Greater investment is needed in community-level healthcare infrastructure, particularly in underserved areas, alongside efforts to improve the quality and consistency of care within long-term care institutions. Expanding access to home- and community-based healthcare services is also essential to support older adults who live alone or with only a spouse (often referred to as “empty-nest” elders), helping to mitigate access-related vulnerabilities.
In practice, community planning should extend beyond physical infrastructure to consider the social and behavioral dimensions of aging. Local governments and service providers should enhance living security by broadening pension coverage, improving the affordability and accessibility of nursing care, and offering targeted financial protections for low-income older adults. Community-based support services should be optimized not only for availability but for their effectiveness in improving health outcomes. This includes integrating recreational activities, health education, and psychological support with medical and social care systems, tailored to the diverse needs of older adults.
Last but not least, these findings underscore the importance of cross-sector collaboration in building inclusive, age-friendly societies. Urban planners, healthcare providers, social workers, and policymakers must work together to identify vulnerable populations, monitor service quality, and implement interventions that reflect the varied realities of aging. Embedding equity at every level of age-friendly policy and practice is essential to ensure that the benefits of population aging are realized while minimizing its challenges—especially for those most at risk.
Conflicts of Interest
The authors declare no conflicts of interest.
Funding
This research was supported by the National Natural Science Foundation of China (Grant no. W2432053).
Acknowledgments
The authors express their gratitude to the research team of the Chinese Longitudinal Healthy Longevity Survey (CLHLS) for providing access to the dataset used in this study. We also appreciate the valuable feedback from colleagues and reviewers, which helped improve this work.
Appendix A: Data Processing
| Factor names | Original variables | Factor loading | Weight |
|---|---|---|---|
| Natural environment | Average temperature in January | 0.916 | 0.045 |
| Minimum temperature | 0.912 | ||
| Proportion of frost-free days in a year | 0.845 | ||
| Precipitation | 0.812 | ||
| Percentage of plain | −0.856 | 0.079 | |
| Percentage of hill | 0.760 | ||
| Percentage of other landforms | 0.634 | ||
| Maximum temperature | 0.874 | 0.028 | |
| Average temperature in July | 0.672 | ||
| Percentage of mountain | 0.991 | 0.260 | |
| Medical support | Percentage of get adequate medical services | 0.737 | 0.020 |
| Insurance coverage rate of public free medical | 0.737 | ||
| Living security | The proportion of pension as the main source of income | 0.965 | 0.107 |
| Coverage of pension | 0.940 | ||
| The proportion of relative payment as the main source of income | −0.740 | ||
| Percentage of income can meet the daily expenses | 0.332 | ||
| The proportion of local government subsidies as the main source of income | 0.728 | 0.105 | |
| Number of institutions for older adults | 0.561 | ||
| The proportion of work income as the main source of income | 0.703 | 0.115 | |
| Coverage of old age insurance | 0.593 | ||
| Public education | The proportion of illiterates above the age of 6 | — | 0.022 |
| Community support | Coverage of legal aid services | 0.772 | 0.090 |
| Coverage of neighborhood services | 0.743 | ||
| Coverage of social entertainment services | 0.708 | ||
| Coverage of medical insurance services | 0.700 | ||
| Coverage of psychological counseling services | 0.680 | ||
| Coverage of family care services | 0.550 | ||
| Coverage of personal care services | 0.650 | 0.129 | |
| Coverage of daily shopping services | 0.551 | ||
Open Research
Data Availability Statement
The data used in this study are sourced from the Chinese Longitudinal Healthy Longevity Survey (CLHLS) 2014–2018. The CLHLS dataset is publicly available and can be accessed through the Peking University Open Research Data Platform upon request and approval.


