Distribution Transformer Winding Fault Detection Based on Hybrid Wavelet-CNN
Abstract
This paper presents a new decision logic approach for protecting and distinguishing internal faults in power transformers. This method uses the feature extraction technique based on wavelet transform and artificial neural network. The proposed method is designed based on the difference between the energies of the wavelet transform coefficients produced by short circuit fault currents in a certain frequency band. First, the operation of the transformer under phase-to-ground and phase-to-phase short circuit faults was examined. Then, the resulting secondary winding current was transferred to the discrete wavelet transform. This method is used to analyze components of the signal at different scales. Based on the results, it has been shown that due to the good temporal and frequency characteristics of the wavelet transform, the features extracted by the wavelet transform have more distinct features than those extracted by the fast Fourier transform. As a result, the fault detection process was improved by integrating the obtained wavelet transform values into artificial intelligence models. This step allows the analysis process to be automated and faults to be identified more quickly and accurately. The proposed method is more efficient and faster and achieves a higher success rate than the traditional method.
1. Introduction
Power transformers are essential components of electric power systems. Its protection must be quick and accurate due to its importance and cost. When transformer failures occur, the cost of repairing can be high and cause long-term outages. There are various types of faults such as internal faults, open circuit faults, and short circuit faults that prevent the power transformer from operating optimally. Failures that occur gradually in the power transformer due to the gradual deterioration of the winding insulation are defined as initial faults. Winding failure usually occurs due to many reasons such as heat, vibration, mechanical stress, humidity, and chemical effects. A wavelet-based technique combined with the finite element analysis method to separate inrush currents from fault currents in power transformers is presented in [1]. According to this method, different behaviors of inrush and fault currents are characterized by using wavelet coefficients in a certain frequency range. A method based on mathematical morphology (MM) and neural networks (artificial neural network (ANN)) is proposed in [2] to detect inrush current in power transformers. MM was used to extract the shape features from the differential currents and then fed into the ANN network to identify the features. For differential protection of power transformers, a method based on wavelet packet transform (WPT) using passive Butterworth filters is presented in [3]. In this method, third-order Butterworth high-pass filters are used. In [4, 5], methods based on signal processing and artificial intelligence techniques were developed to improve the efficiency of traditional transformer differential protection schemes. Including these algorithms, wavelet transform (WT) has been widely used for this purpose. ANN technology has shown significant advantages in feature extraction, fault diagnosis, and status analysis of electrical equipment operating data with the development of artificial intelligence [6]. In [7], artificial intelligence is introduced through the decision tree algorithm and ANN by extracting differential currents to detect the radial deformation of the winding and the axial displacement. The paper [8] uses ANN along with new statistical index FP to detect radial deformation, disc space changes, axial displacement, and short circuit. In [9, 10], power transformer differential protection methods based on deep learning (DL) were proposed and good results were reported. However, DL algorithms cannot be easily deployed in hardware, potentially hindering real-world applications [11]. Continuous wavelet transform (CWT) and improved convolutional neural network (CNN) were used in [12] for transformer fault detection based on feature extraction of fault information contained in vibration signals. In order to identify fault classes in the training set, a new approach based on the sand bee algorithm (SSA) and enhanced empirical wavelet transform (IEEE) was presented in [13]. According to the reviewed sources, wavelet analysis is useful for fault detection applications where the fast Fourier transform (FFT) is not efficient or where temporal information about the fault is required [14]. Machine learning (ML) deals with techniques that focus on automatically recognizing patterns in data and making inferences. DL and ANN are used in various applications due to their high accuracy [15, 16].
This study includes a comprehensive approach to detect internal faults of the transformer. The 250 kVA transformer used in this study falls within the small to medium range of transformers, making it suitable for local distribution applications. It is a common size for commercial and industrial settings where moderate power requirements exist. In comparison to the broader range of power transformers, the 250 kVA transformer represents a practical choice for many applications, particularly in urban areas or smaller industrial setups. First, a detailed simulation of the transformer was carried out in normal operating condition and in different short circuit fault situations. Primary and secondary winding currents of transformer were used to estimate the short circuit fault conditions. Discrete wavelet transform (DWT) was used to detect fault conditions. This method is used to decompose the signal into an equal number of low-frequency components. Then, in order to collect more data, the transformer was simulated in different conditions and a dataset of wavelet analysis results was created. The data obtained were used for the model trained with DL methods. Python programming was used in training the models. As models, fully convolutional network (FCN) and multilayer perceptron (MLP) models were preferred.
2. Methodology
2.1. WT and Feature Analysis of Transformer Transient Signals

The upper block is assigned a lower time interval and therefore a higher frequency, while the lower block is assigned a longer time interval and a lower frequency. The characteristics of the power transformer under consideration are given in Table 1. Figure 2 shows the secondary winding current of studied transformer under two-phase short circuit condition.
| Nominal capacity of transformer | 250 kVA |
| Nominal voltages (primary winding) | 34,5 KV |
| Nominal voltage (secondary winding) | 400 V |
| Nominal current (primary winding) | 4.374 A |
| Nominal current (secondary winding) | 360.85 A |
| Nominal frequency/number of phases | 50 Hz/3 |
| Impedance voltage | %4.51 |
| Connection symbol | Dy11 |
| No-load loss | 550 W |
| Load loss | 3000 W |
| Total losses | 3550 W |
| Cooling type | ONAN |
| Insulation levels | LI 170 AC 70/LI—AC 3 |
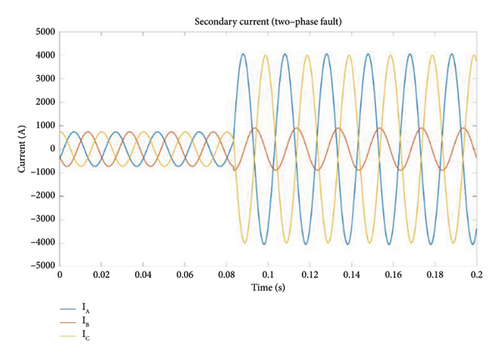
In this case, DWT was used to find the short circuit fault in the studied transformer. The resulting secondary current was transferred to the wavelet program and the following results were obtained. Figures 3(a) and 3(b) show the decomposition current obtained by applying the Daubechies5 (DB5) wavelet to the transformer under normal operating conditions and two-phase short circuit, respectively.
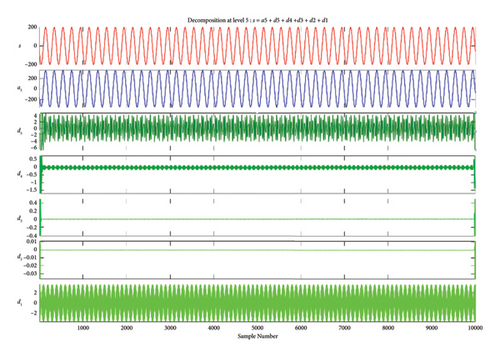
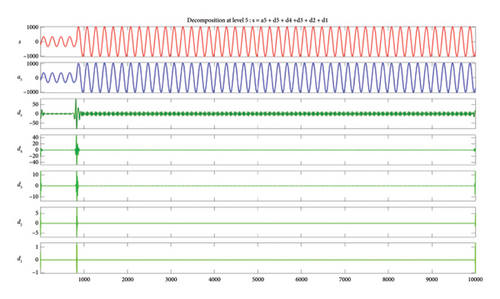
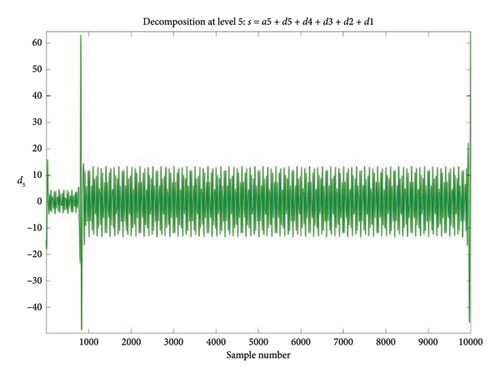
The S signal is decomposed by the DWT process into an equal number of low-frequency components, i.e., approximations (A), and high-frequency components, i.e., details (D). Based on these results, Figures 4(a) and 4(b) show the DB5 Level 5 wavelet in normal and faulty condition, respectively.
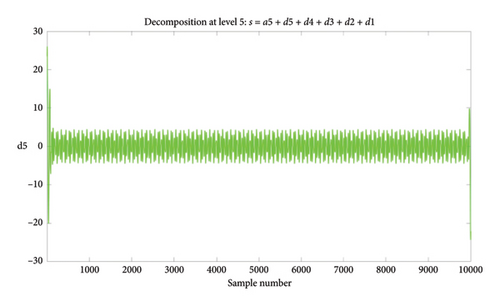
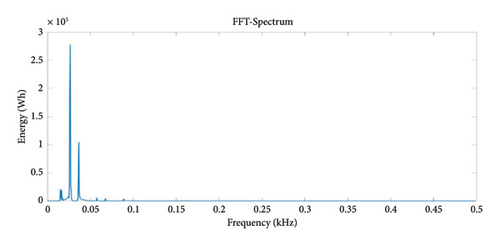
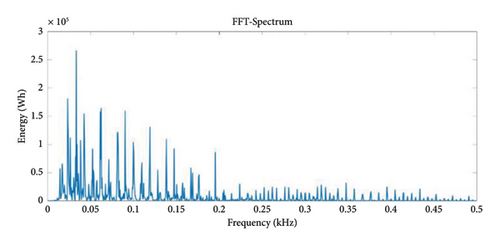
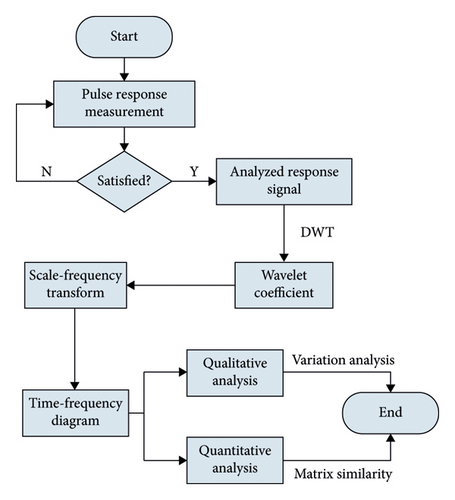
Figures 5(a) and 5(b) show the energy of the DB5 Level 5 wavelet in the normal and faulty condition. FFT-Spectrum analyzer was used to see how the energy changes in which frequency range and in which frequency range it is more intense. The FFT spectrum shows how much power and energy the signal has at which frequency. This is a widely used method to analyze the frequency components of the signal and identify important frequency components. It can be seen in the figure that the transformer in the normal operation condition first shows a small increase, then the energy increases to the maximum level and with a sudden decrease it reaches a value close to zero and continues at a value close to zero. This shows that a normally functioning transformer has a stable energy distribution. In the faulty condition, a slight increase is observed at first and then a decrease. This is different from the normal situation and indicates an abnormal change in energy distribution. Such changes in fault-mode power dissipation may indicate potential problems in transformer performance. Therefore, analysis of energy graphs is an important tool for fault detection and preventive maintenance. After continuing this process several times, the energy reaches its peak and then suddenly decreases, and these processes are repeated several times periodically. Following these periodic increases and decreases, the energy value continues to be close to zero after a certain period of time. This indicates the existence of a certain periodic pattern. Such periodic increases and decreases can provide information about the stability of the system or irregularities in its functioning. Especially sudden drops or periodic changes in the energy level may indicate possible malfunctions or imbalances in the operation of the system. Therefore, monitoring and analyzing such periodic changes in energy values can provide valuable information about the state of the system and enable necessary interventions. The flowchart of short circuit fault detection using DWT is shown in Figure 6.
2.2. Fault Diagnosis Model of Transformer With DL Method
In this section, two different DL methods are used to predict the short circuit fault of the transformer. The architecture of the first model, the FCN model, is given in Figure 7.
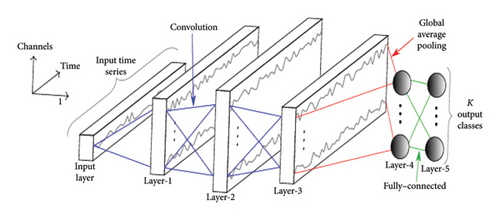
This function gives a zero value if the input value is negative, and if it is positive, the input value is given directly to the output. This simple function can increase the learning ability of neural networks. It can provide faster learning compared to activation functions such as sigmoid or tanh. Batch normalization is a technique used to normalize the output of layers in a neural network. This can speed up the training process and provide better generalization ability. It helps the model learn better by reducing the risk of overfitting. While the proposed wavelet-CNN method is inherently less sensitive to noise due to the properties of WTs, its performance may still be affected by high noise levels. Therefore, implementing noise reduction techniques—such as filtering, wavelet thresholding, and adaptive methods—can enhance the robustness and reliability of the fault detection process. Employing these techniques ensures that the model can effectively differentiate between genuine fault signals and noise, leading to more accurate diagnostics in power transformers. If the original study did not cover these techniques, they could be considered for future work or exploratory research to further improve the method’s performance. WTs are known for their ability to separate signal components based on frequency. This property makes them particularly effective in distinguishing between meaningful signal features (e.g., those related to faults) and noise. By focusing on specific frequency bands, the WT can preserve important low-frequency signal information while attenuating high-frequency noise. The method’s use of both approximation and detail coefficients allows for a comprehensive analysis at different scales, which can help to identify and mitigate the effects of noise. After applying the WT, coefficients can be manipulated through thresholding methods. In this approach, detail coefficients that fall below a certain threshold (indicating noise rather than signal) can be set to zero (hard thresholding) or reduced in magnitude (soft thresholding). This technique helps to keep significant features while eliminating noise. Global average pooling is a technique that generally helps to reduce the size of the feature map and summarize the features. It can replace the mostly used fully connected layers and help the model learn more general features. Convolutional layers are DL layers used in visual data processing. In the first scenario, 1 neuron was used in each convolution layer, and in the second scenario, 10 neurons were used in the first convolution layer, 20 neurons were used in the second convolution layer, and 30 neurons were used in the third convolution layer. In the third scenario, 32 neurons were used in the first convolution layer, 64 neurons were used in the second convolution layer, and 128 neurons were used in the third convolution layer. MLP was used as the second model. The architecture of this model is shown in Figure 8.
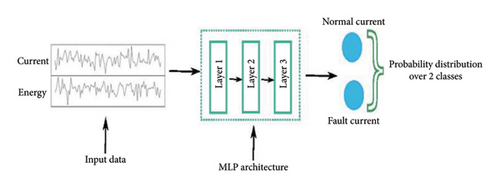
Dense layer is a basic layer used in neural network models. It is a fully connected layer where each neuron is connected to all neurons in the previous layer. Flatten layer is a layer used to flatten multidimensional data. This layer is most commonly used to flatten 2D or 3D data structures, such as image data. It converts all elements of input data into a single flattened vector, which is usually connected to consecutive dense layer. Dropout is one of the regularization techniques used to reduce overfitting that allows disabling randomly selected connections during the training. This helps the model avoid being overly dependent on a particular neuron and increases its generalization ability. In order to get optimum results in the MLP model, the number of neurons in the convolution layers was changed and the results were observed.
In the first scenario, 1 neuron was used in each fully connected layer, and in the second scenario, 10 neurons were used in the first fully connected layer, 20 neurons were used in the second fully connected layer, and 30 neurons were used in the third fully connected layer. In the third scenario, one fully connected layer and 32 neurons were used in that layer. Increasing the number of neurons in the convolutional layers of an FCN model has a direct impact on computational cost and training time. While more neurons can enhance the model’s capacity to learn complex features, they also introduce significant computational overhead and extend training duration. Proper tuning and experimentation are essential to strike the right balance between model complexity and training efficiency for optimal performance in specific applications, such as fault detection in transformers.
Each neuron (or filter) in a convolutional layer corresponds to a set of weights. Increasing the number of neurons directly increases the total number of parameters in the model. More parameters lead to higher memory requirements for storage and will be more computationally intensive during both the forward and backward passes through the network. As the number of neurons increases, this computational cost escalates, leading to longer processing times for both training and inference. While more neurons can potentially allow the model to learn more complex features, they can also lead to slower convergence. This occurs due to the increased complexity of the loss landscape, where more parameters might result in more intricate and potentially more challenging optimization problems. As the model becomes more complex, it may also require more epochs to converge to an optimal solution, further extending training time.
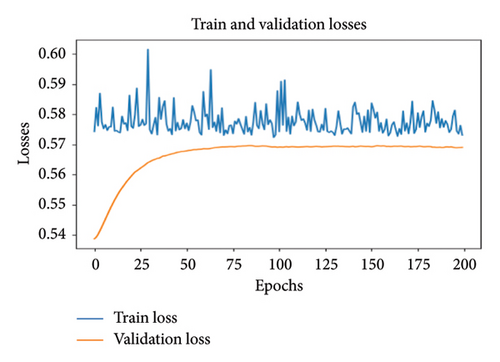
The dataset obtained in the wavelet analysis was transferred to FCN and MLP models and trained separately, and transformer short circuit faults were detected with these models. It was examined how the accuracy changed by changing the number of neurons in both models, and the model with the highest accuracy was selected for fault detection. The first FCN model has three convolutional layers, each one created using only one neuron. Looking at the training and validation losses of the model in Figure 9, it is seen that the training loss does not fall below 0.69. This situation shows that the model cannot perform as expected. It is observed that the training loss is gradually increasing according to the verification losses.
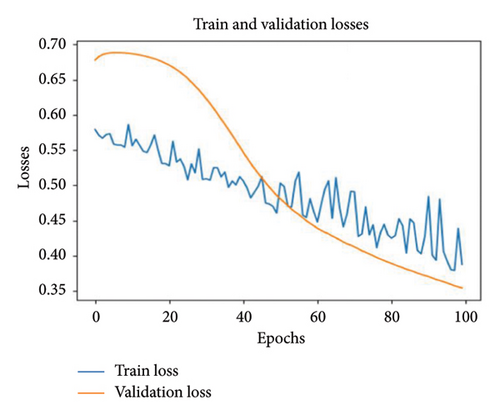
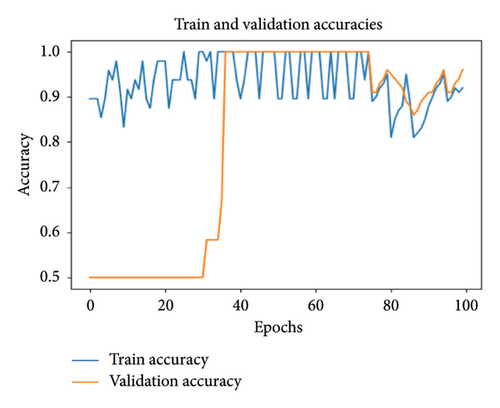
In order to reduce the training and validation loss, the number of neurons in the layers is increased in the FCN model. 32 neurons were used in the first convolution layer, 64 neurons in the second convolution layer, and 128 neurons in the third convolution layer. Since the model has a more complex structure, it aims to achieve better results. Figure 10(a) shows that the training and validation losses gradually decrease and reach a value close to 0.5. This means that the model is well learned and has a high generalization ability. Looking at Figure 10(b), it can be seen that the training accuracy is 92% and the validation accuracy is 97%. These results show that the model successfully fulfills the given task.
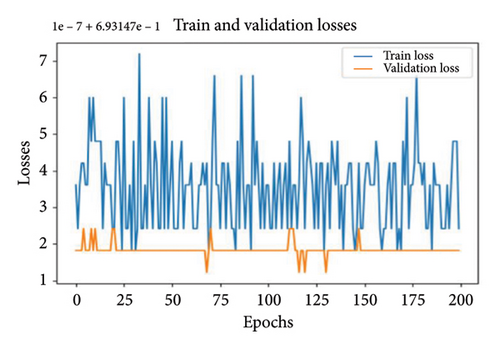
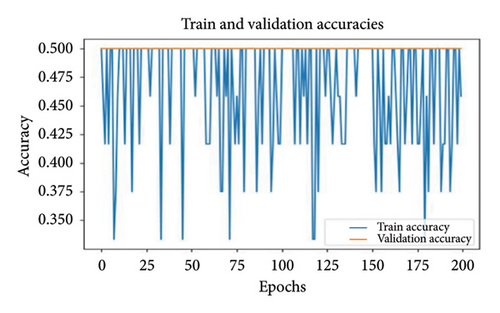
In this section, the MLP method is used as the second model to predict transformer short circuit fault. The first MLP model used 1 neuron in each of three fully connected layers. According to the training and validation losses of the model in Figure 11(a), it is seen that both training and validation losses are not at acceptable values. Looking at Figure 11(b), it can be seen that the training accuracy exhibits a wavy graph. It is seen that the training accuracy is 43% and the validation accuracy is 50%. This is definitive proof that the model has not learned anything.
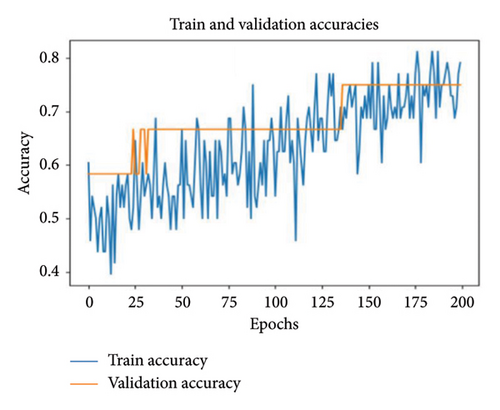
In the second scenario, 10 neurons were used in the first layer of the three fully connected layers in the MLP model, 20 neurons were used in the second layer, and 30 neurons were used in the third layer. According to the results, it was not observed that as the number of epochs increased, the training loss decreased compared to the first model. A decrease was observed when looking at verification losses. However, it seems that the model still cannot learn well enough. It is seen that the training accuracy is 57% and the validation accuracy is 50%. This shows that the model still cannot learn better. For this reason, in the third MLP model, only one fully connected layer was used and 32 neurons were placed in this layer. According to the results obtained in Figure 12(a), it is seen that the training and validation losses are gradually decreasing compared to other models. Both training and validation losses are close to 0.5. It can be seen in Figure 12(b) that the training accuracy is 78% and the validation accuracy is 75%. These results show that the model starts to learn better and reduces the overlearning problem.

3. Conclusion and Recommendations
In this paper, a fault detection method named WT-ANN is proposed to solve the FD problem under the short circuit winding of transformer by converting the current signals into an equal number of low-frequency components for traditional MLP and FCNs. This proposed method makes the most of the powerful feature extraction ability of WT and the excellent classification performance of ANN, enabling high-accuracy FD to be achieved. In this study, energy values of the current under short circuit condition were obtained using wavelet DB5 and a dataset was created. These data were used for training FCN and MLP models, and fault detection was performed.
According to the results obtained, when 32 neurons in the first convolution layer, 64 neurons in the second convolution layer, and 128 neurons in the third convolution layer were used in the FCN model, it gave very good results. In this case, it can be seen that train accuracy is around 92% and validation accuracy values are around 97%. Detailed simulation studies confirmed the suitability and effectiveness of the proposed method. Therefore, it can be used as an important and effective protection method in power transformers.
Conflicts of Interest
The authors declare no conflicts of interest.
Funding
No funding was received for this research.
Open Research
Data Availability Statement
The data that support the findings of this study are available from the corresponding author upon reasonable request.


