Optimizing Virtual Power Plant Operations in Energy and Frequency Regulation Reserve Markets: A Risk-Averse Two-Stage Scenario-Oriented Stochastic Approach
Abstract
The intermittent nature of distributed energy resources (DERs) has introduced significant challenges in power system operations, particularly in terms of flexibility, efficiency, and market participation. Aggregating DERs into a virtual power plant (VPP) offers a promising solution to these challenges, but it requires effective strategies to manage the inherent uncertainties and optimize operations across multiple energy markets. This paper develops an optimal bidding strategy for an aggregated multienergy virtual power plant (MEVPP) participating in both the day-ahead (DA) energy market and the frequency regulation reserve market (FRRM). To effectively address these uncertainties, we propose a two-stage scenario-oriented stochastic optimization model that aims to maximize revenue and minimize operational costs by incorporating risk management strategies. Then, a novel fast forward selection and simultaneous reduction (FFS&SR) algorithm is proposed, which efficiently generates and refines scenarios, ensuring computational feasibility without compromising accuracy. The proposed VPP’s decision-making problem considers the VPP’s risk-averse nature, employing the conditional value at risk (CVaR) metric as a risk-aversion parameter. Simulation results conducted over a 24-h planning horizon validate the model’s performance, exhibiting superior performance in the bidding market scenarios. Furthermore, the numerical findings compare the risk-neutral VPP framework with the proposed risk-sensitive VPP strategy, revealing a trade-off between expected profit and CvaR, indicating that as the risk aversion parameter escalates, expected profits decline while CVaR value rises, underscoring the importance of risk management in VPP optimization.
1. Introduction
The proliferation of distributed energy resources (DERs) has presented a myriad of challenges to power systems, primarily attributed to their unpredictable behavior. This unpredictability has led to increased complexities and raised concerns over the flexibility and efficiency of the overall power system [1]. The comprehensive integration of these DERs necessitates efficient management and control structures to ensure the power system’s stability and reliability are maintained. Addressing these challenges calls for the development of novel algorithms and advanced communication networks. The concept of a virtual power plant (VPP) has emerged as a promising strategy for managing and aggregating DERs. The VPP serves as an effective tool for aggregating and managing DERs that contribute to the grid services, thus playing a pivotal role in the electricity market and maximizing its profit [2]. Nonetheless, the uncertainty inherent in DERs presents an ongoing challenge for the VPP framework and related research. This uncertainty is exacerbated by the increasing volatility in generation and demand in the system, which creates a need for a variety of ancillary services, such as frequency regulation and reserves [3]. Although the inclusion of heterogeneous small-scale DERs in the VPP potentially leads to additional uncertainties in the system, these DERs are particularly well-suited to providing ancillary services. This is due to their capabilities for faster ramping (for instance, battery energy storage system, BESS) and lower operational costs [4, 5]. In its role as a managerial entity, the VPP enables the aggregation of small-scale DER portfolios, allowing them to participate in the wholesale electricity market as a singular market participant [6]. Nevertheless, it also encounters considerable challenges, particularly the uncertainty associated with large-scale centralized DERs. Factors contributing to these uncertainties include fluctuating electricity market prices, the level of DER production, and variations in load demand and generation. Nevertheless, an often-overlooked aspect in this discourse is the potential risk associated with VPP participation in various energy markets. Ignoring this factor can significantly compromise the economic feasibility and operational stability of a VPP. In this regard, our study places a strong emphasis on this risk factor. We propose an operation and decision-making model that considers the risk-averse nature of the VPP, employing the conditional value at risk (CVaR) metric as a risk-aversion parameter.
2. Relevant Literature
2.1. VPP Bidding in DA-Ahead (DA) and Real-Time Markets
Recent research in optimal bidding strategies for electricity markets has concentrated on VPP components, addressing the challenges of extensive data forecasting. Various studies have explored VPP participation in DA and real-time markets. A key development is a bilevel stochastic mixed-integer linear programming (MILP) optimization model for technical VPP to trade in energy market [7]. This model perceives the DA energy market as the wholesale market and utilizes the multicarrier structure of the TVPP to compete with other electricity producers. Moreover, a two-stage bidding procedure for a price taker was analyzed, evaluating the DA energy and real-time market alongside a two-stage bidding approach for price-takers in DA and real-time markets, which exclude ancillary services [8]. Alongside these developments, numerous papers have highlighted the significance of managing uncertainties in VPP operations and scheduling, proposing innovative methods such as stochastic and local optimization in demand response (DR) programs [9–11]. The extensive body of research conducted to date has made a considerable contribution to the exploration of optimal control operations and bidding strategies for VPP. Such literature often employs optimization methodologies in their investigations. For instance, Hadayeghparast et al. proposed a noteworthy energy management model that leverages two-stage stochastic programming, taking into account the existence of renewable energy resources, to manage the operational scheduling of a VPP [12]. On the other hand, a unique combination of stochastic and adaptive robust optimization techniques to model uncertainties, particularly for the expansion planning problem related to generation and transmission, has been carried out in [13].
2.2. Risk Management Approaches for VPP
Risk management constitutes another significant research area for VPP bidding, scheduling, and seeking informed decisions. Notable studies in the literature have come up with distinct methodologies addressing risk-associated problems, for instance, risk-based VPP operation in [2, 14] and risk-averse VPP strategies in [15, 16]. These studies propose advanced stochastic optimization models to tackle uncertainties in market prices, renewable generation, and demand. Study [2] incorporates CVaR and Markov Chain Monte Carlo (MCMC) to optimize risk-based operations, while authors in [14] introduce a multiobjective programming model with p-robust stochastic programming to balance operational costs and risk regret levels. Similarly, in [15], a two-stage stochastic mixed-integer linear program is employed with CVaR to mitigate low-profit risks and maximize the generation companies’ expected profit in DA and balancing markets. Moreover, the literature in [16] further extends this framework by addressing real-time and spinning reserve markets, formulating a risk-constrained stochastic problem that integrates DERs, ESSs, and demand-side flexibility to maximize VPP profits. Nevertheless, many risk control strategies predominantly emphasize CVaR or boundary constraints in the optimization process, leaving other significant risk measures such as value at risk (VaR) and shortfall probability (SP) relatively underexplored. In [17], the authors address this gap by proposing a risk-averse stochastic decision-making framework that incorporates multiple risk metrics (CVaR, VaR, and SP) for energy trading in a wind-storage system within an electricity market. By embedding these metrics in a scenario-based risk-aware stochastic optimization model for wind-storage energy trading, the study demonstrates how this integrated approach can effectively manage uncertainties and accommodate the needs of multitype risk-averse decision-makers in electricity markets.
2.3. Role of Ancillary Services, Frequency Regulation, and Scenarios-Oriented Approaches for VPP
Although VPPs have been increasingly investigated in DA and real-time markets, however, despite this wealth of research, a notable gap persists in studies addressing their collective participation in DA energy and frequency regulation reserve markets (FRRM). This oversight, largely attributed to the complexities of accurately modeling uncertainties in DERs, limits the development of effective electricity market bidding strategies. With the added uncertainties in generation, demand, and market prices, the problem of electricity market bidding becomes even more critical in the ancillary services market (regulation and reserve services) compared to the DA energy market. Thus, the ancillary services market, particularly the frequency regulation reserve market referred to as FRRM, presents an untapped potential for leveraging the fast-ramping capabilities of DERs, potentially yielding higher profits and reduced operational costs [18]. Consequently, we found research scarcity involving the integration of slow-ramping resources (e.g., CHP, boiler, and thermal storage) with faster ramping renewables (such as BESS) within a VPP context. Since they have the capability of offering flexibility to the power system, we thus speculate that they are somehow ignored in the operational scheduling modeling of VPP taking into account multienergy market scenario. In this respect, some research studies have tried to address this issue through the inclusion of these slow-ramp resources in a VPP, thereby considering different electricity market environments. Notable exceptions include studies exploring optimal bidding strategies of CHP-DH and RES generators in DA and imbalance markets [19], and the operational scheduling of a coupled combined heat and power-virtual power plant (CHP-VPP) comprising heterogeneous DERs based on the electric power network and the district heating network thoroughly studied considering DA profit maximization and minimizing operational cost in the real-time market [20]. However, these studies fall short in incorporating a comprehensive VPP model that includes CHP, boiler, and thermal resources in a multienergy market setting, particularly the FRRM. Also, we noticed a similar research in [21]; however, it offers no applicability to the VPP concept. Hence, our paper aims to bridge this gap by integrating slow-ramping resources (CHP–EiB–thermal) with the fast-ramping resources (BESS) within an aggregated VPP, while allowing them to trade their capacities in DA market and FRRM. This approach also accommodates a hybrid energy storage (HES) system such as BESS and thermal storage, enhancing the flexibility and market benefits of various DERs [5]. Moreover, FRRM proved to be more suitable, effective, and flexible for various DERs due to their higher market benefits and stability offering to the balancing of the power system. To improve the social welfare, revenue maximization, and controlling operational costs, various scenarios-oriented modeling techniques have been developed in earlier literature which focuses on benefiting the market participants.
Although we might see a wide variety of research conducted previously on the scenario-oriented modeling techniques, while beneficial for market participants, they often struggle with accurate forecasting of demand and generation, computational efficiency, and market prices [22–24]. As per our understanding, we relate this discrepancy due to ineffective scenario generation and simultaneous reduction methods, which leads to inaccuracies in prediction, slower computation and execution, as well as a higher computational burden. Thus, to address these challenges, we introduce the fast forward selection and simultaneous reduction (FFS&SR) algorithm, designed for efficient and rapid processing of large-scale datasets. Our study also expands on the limited focus of the existing literature on FRRM-specific strategies for VPPs [25–28] and harnesses advancements in artificial intelligence and machine learning to improve forecasting and operational risk evaluation. A variety of approaches based on deep learning (DL), reinforcement learning (RL), long short-term memory (LSTM), and bidirectional long short-term memory (B-LSTM) have been investigated in published papers that help in superior uncertainty handling and higher financial benefits compared with scenario-based scheme [29, 30]. Besides, the current literature often overlooks the role of key resources, the evaluation of operational risk during bidding strategies, and the limitation to a single market operator. For instance, FRRM problem is addressed in [29] taking ESS, wind power (WP), EV, and DG as DERs, yet it lacks other key resource participations, lack of evaluating operational risk during bidding strategies, and limitation to a single market operator. To overcome these limitations, we turn to scenario-based research methodologies, which have proven to be more mature and precise in handling uncertain DER parameters.
In response to the identified research gaps, the pressing need is to develop and rigorously analyze sophisticated bidding strategies for VPP in multiple electricity markets, such as the DA market and FRRM. Our study proposes a stochastic optimization-based bidding strategy, focused on scenario counts, to assist VPP operations in these dual-energy markets. While our approach does not currently incorporate real-time bidding strategies, it remains applicable within the context of the balancing market. The FRRM, in particular, offers unique advantages in managing capacities for both upward and downward regulations, aligned with the precise dispatching of secondary frequency regulation signals [31]. In the context of performing regulation based on the automatic generation control (AGC) signal response, different electricity markets have adopted varying rules. For instance, the California ISO (CAISO) in the United States treats upward and downward regulation as distinct entities for regulation performance [32]; consequently, the PJM grid operator in the United States treats it as a single regulation entity [33]. These variations highlight the complexity and need for robust frameworks that can cater to multiple regulations simultaneously.
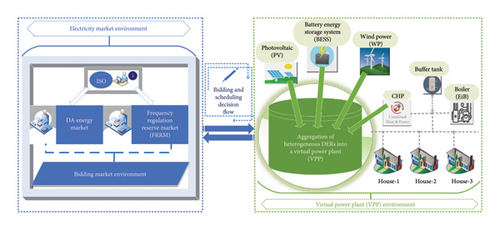
Our primary objective is to equip VPP operators with a flexible, robust, and realistic strategic bidding framework for market participation. This aims to maximize social welfare and economic benefits through efficient DER utilization and establish a more risk-averse VPP framework that effectively reduces uncertainties. Considering both upward and downward regulation services in our model allows for the full exploitation of DER capacities. The core of our work facilitates VPP participation in multiple energy markets, optimizing potential profits in dual-bidding scenarios. We achieve this by aggregating various DERs into a unified VPP, enabling its participation in both the DA market and the ancillary services market, particularly the FRRM, as depicted in Figure 1.
2.4. Summary of the Relevant Literature
The current literature on VPP bidding in energy markets demonstrates advanced methodologies for DA and real-time engagement, utilizing stochastic techniques. In the field of risk management, research has mostly focused on risk-based or risk-averse techniques, especially utilizing CVaR or boundary limitations, while neglecting measures like VaR and SP. While these strategies are essential for alleviating uncertainty in energy markets, their efficient integration with slow-ramping and fast-ramping resources across various market circumstances is a significant difficulty. Although there are many potential advantages to ancillary services markets, especially FRRM, there are not many thorough studies that include both slow-ramping resources (like CHP, boilers, and thermal storage) and fast-ramping resources (like BESS) in multienergy contexts. The existing scenario-based and AI/ML-driven models confront intricate uncertainties, although they often have trouble with forecasting inaccuracy, computing demands, and a limited emphasis on individual market operators or narrow risk metrics. Thus, there is an urgent requirement for a cohesive, risk-averse VPP architecture that can combine various DERs, complex risk metrics, and different market configurations. The subsequent sections expand on these observations, pinpointing the gaps and outlining our proposed solution.
3. Knowledge Gap
Existing literature highlights the effectiveness of scenario-based methods in offering a robust and precise framework to address uncertainties in DER parameters. These methodologies facilitate accurate forecasting of uncertain parameters across various scenarios, aligning well with the operational dynamics of VPP in diverse electricity markets. However, the wide range of scenarios introduces complexities in accurately modeling DER uncertainties, especially in generation, demand, and market prices, emphasizing the need for efficient large-scale data management. A significant challenge identified in prior research is the high computational burden and substantial optimality gaps associated with scenario generation and reduction, leading to inefficiencies in processing large datasets.
This study introduces, for the first time, the novel fast forward selection and simultaneous reduction (FFS&SR) technique. This approach is specifically designed for VPPs integrated with a diverse range of DERs, enabling efficient and rapid processing of large-scale datasets while significantly reducing computational burden and narrowing optimality gaps. This marks a significant improvement over the previous technique. Additionally, we propose a dual-stage stochastic optimization approach, tailored for large-scale datasets, to develop a robust and advanced bidding strategy for a risk-sensitive VPP operating in DA and FRRM markets. Our approach contrasts with recent researchers that confines VPP bidding strategies to specific market operators. Instead, it extends these strategies’ applicability universally across various global electricity markets, with a particular focus on FRRM. Moreover, within the FRRM context, we have identified a significant research gap in the ability of VPPs to regulate simultaneously in both upward and downward directions. Therefore, our research bridges this noteworthy knowledge gap, presenting a novel opportunity for VPPs to concurrently trade capacities in both regulatory directions, adhering to market regulations and system operator requirements.
4. Paper Contributions
- 1.
A two-stage scenario-based stochastic optimization method is devised to optimize the VPP’s power exchange participation in two distinct bidding markets: the DA energy market and the FRRM. This method is specifically designed to optimize the VPP’s bidding strategies across both markets by considering uncertainties such as renewable generation variability, fluctuating electricity prices, and dynamic market demand. Furthermore, the proposed model incorporates a risk-averse framework using the CVaR metric, offering an effective mechanism for managing uncertainties in a risk-sensitive manner. By benchmarking the risk-averse VPP strategy against a risk-constrained framework, the study evaluates multiple risk scenarios based on varying confidence levels and risk-aversion parameters. This comprehensive approach bridges the gap in optimizing VPP operations across dual-market settings taking into account financial and operational uncertainties.
- 2.
Current research often overlooks the operational complexities of VPP participation in ancillary services markets like FRRM. This study fills this gap by explicitly modeling the upward and downward regulation requirements of the FRRM. The model integrates a mechanism to respond dynamically to AGC Reg-D signals, enabling the VPP to segregate its resource allocation into Reg-Up and Reg-Down capacities. This segregation allows the VPP to optimize its resource utilization in response to market conditions and regulatory signals, thus augmenting grid stability and market responsiveness. The decision-making framework guarantees precise capacity trading based on the accuracy of the AGC signal responses. By integrating this regulatory adjustment capability, the study provides a practical solution for improving VPP operations in ancillary services markets, filling the gap in strategies for efficient capacity allocation and resource utilization.
- 3.
Managing uncertainties in VPP operations remains a critical challenge due to the intermittent nature of DERs, unpredictable market prices, and stochastic reserve requests. This study tackles this issue by developing and applying the novel FFS&SR algorithm. The algorithm generates, selects, and reduces large-scale scenarios efficiently, significantly improving computational performance. By retaining only, the most critical scenarios, the FFS&SR algorithm ensures that the optimization process remains computationally feasible without compromising accuracy. Comparative results indicate that this algorithm outperforms traditional scenario reduction techniques, yielding better results in terms of computation time, scenario representativeness, and solution quality. This contribution directly confronts the inefficiencies in uncertainty modeling, enabling the VPP to operate effectively in real-world conditions with enhanced scalability and precision.
- 4.
Although existing research offers theoretical optimization models, there is a lack of studies focusing on computational efficiency in solving large-scale VPP operational issues. The stochastic optimization problem presented in this study is transformed into a MILP model. The MILP formulation is solved by off-the-shelf general algebraic modeling system (GAMS) software (version 24.3) leveraging the high-performance IBM CPLEX solver. This approach ensures global optimality of the solutions while markedly reducing computational time. Extensive simulations validate the efficacy of the proposed method, showcasing its ability to handle real-world complexities and deliver actionable insights for VPP operators.
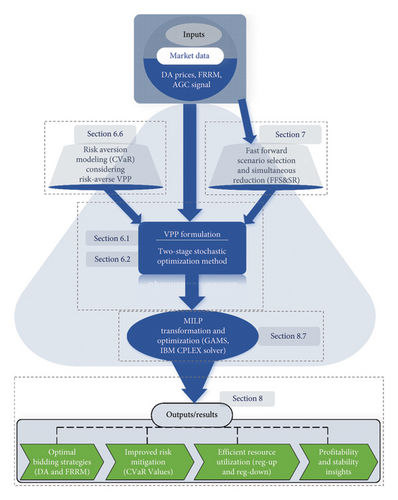
Aiming at the objective problem and proposed framework, the remainder of this paper is organized as follows: The aggregated structure of VPP and its joint market bidding model are developed in Section 5. Section 6 builds the formulation for the proposed two-stage stochastic programming method considering necessary constraints in two bidding markets. The uncertainty risk evaluation considering risk-aversion CVaR together with WP and photovoltaic (PV) power forecasting errors calculation is also demonstrated in this section. The FFS&SR algorithm is developed in Section 7. Afterward, the numerical experimental results are presented in Section 8. The discussion on key findings and their practical implications in real-world scenarios are presented in Section 9. Finally, Section 10 concludes this paper including a future research plan.
5. VPP Aggregated Structure and Its Bidding Model
Constraint (1a) emphasizes an objective function that aims to maximize potential profits while minimizing operational costs. Here, represents the revenue from the DA energy market, while denotes the earnings from the ancillary services market (FRRM) at a given time t under the expected probability of scenario Eω[⋅] and the operational cost of the system under the same conditions as shown in (1d) includes the operational cost associated with CHP units, the degradation cost of BESS, and operational cost of electric immersion boiler (EiB). The and represent the prices in the energy market and the FRRM, respectively.
6. Problem Formulation
6.1. Two-Stage Stochastic Programming Method
In this paper, we have proposed a two-stage stochastic programming method tailored for optimizing operational decisions and scheduling of a VPP within a multienergy market context. This approach is specifically designed to address scenario ω, with the focus on generating units g at temporal instance t. The proposed stochastic optimization model aims to maximize revenue and minimize costs for a VPP, considering two distinct stages of the bidding market, as highlighted in prior research [11]. The first stage involves the VPP submitting supply offers or demand bids in the DA energy market. Simultaneously, the second stage requires the VPP to provide both upward and downward regulation supply offers for the ancillary services market, particularly under the framework of pay-for-performance (PFP). This strategy is critical for ensuring precision and responsiveness to the dispatched AGC regulation signal. In the PFP model, market participants are compensated based on the regulation capacity offered and the extent of adjustments made to their dispatch set points following the system operator’s directives. Furthermore, rewards are contingent upon the degree of adherence to regulation signals, aligning with the standards set by established guidelines [36]. This two-pronged approach not only aligns with market demands but also enhances the operational efficiency and profitability of the VPP in a complex multimarket environment.
6.2. Objective Function
The initial segment (i) of the aforementioned objective function, indicated as (2a), is devoted to defining the intricacies of the energy market problem (DA). Conversely, the subsequent segment outlines the second-stage problem (ii) which explicates the workings of the regulation market (FRRM). In order to streamline this process further, we distinguish between functions within the objective function (2a) that are scenario-dependent and those that are not. For the first portion of the second stage (ii), we operate under the presumption that capacities remain constant and are not contingent on the specified scenarios. However, the second portion, specifically pertaining to the regulation market (within the second stage), is scenario-sensitive. This part takes into account factors such as mileages, operational costs, and risk assessment. The decision variable in the initial stage (i) is designated as , with symbolizing the corresponding price. The decision variables in the succeeding stage (ii) are and , which offer regulation capacity to the market, with the capacity available for both up- and downregulation. The (μMLG)Δt is utilized as a mileage factor, signifying the average distance to be covered within the time frame of Δt. The final component showcases a risk-aversion measurement, CVaR, which computes the expected profit for a given confidence level α in the worst scenarios. Equation (2b) refers to the operational costs of the participating resources, including CHP systems, BESS, and EiB. The operational cost of CHP includes both start-up and shut-down expenses, in addition to fuel costs tied under binary variables signifying the ON and OFF states of the CHP, respectively. Moreover, it is important to recognize that the operational costs of these generators fluctuate based on the distinct scenarios. Constraints (2c) is the representation for imbalance power in which is the power to purchase (to cover the demand shortage), whereas shows the excess power to be sold (maximum profit) in the energy market. Constraints (2d) shows that both the positive and negative power imbalances are non-negative. We have articulated all of the operational limitations for the generating units or resources within the VPP during the first stage (DA stage). This is achieved through submitting a number of bids—actions we classify as “here-and-now” decisions. Subsequently, contingent upon the outcomes of the first stage, decisions for the second stage (recourse decision) are formulated by dispatching the generating units and managing power exchange—decisions; we categorize as “wait-and-see” actions [37]. It is significant to note that certain types of resources, specifically WP and photovoltaic (PV), are listed as types that will not engage in the FRRM.
6.3. DA Energy Market and Its System Constraints (Stage 1)
6.3.1. BESS Constraints (Equations (4a)–(4n))
6.3.2. CHP Unit Constraints (Equations (5a)–(5f))
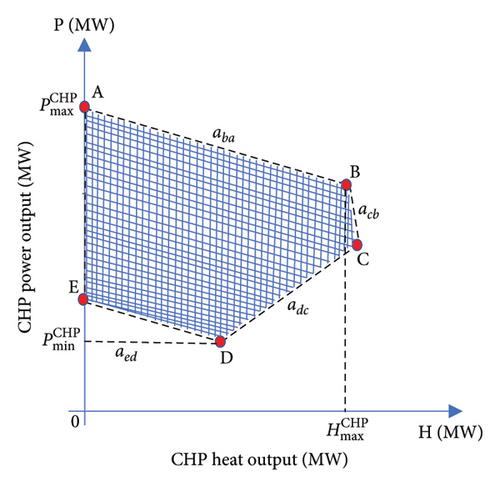
Constraints (5a)–(5d) represent the operational constraints applicable to the CHP units denoted as g, where index e represents the number of extreme points under a designated operation area (ABCDE) with its respective coordinates and . The set of extreme point is denoted as ∂CHP; however, denotes the combination coefficient of e − th extreme point of the g − th CHP unit. The Xg,ω,t is binary variable condition for generator ON and OFF status. Constraint (5e) signifies the linear operation cost associated with a CHP unit, and denotes operation cost at the e − th extreme point for g − th unit of CHP. Constraint (5f) lays out the stipulations for net power generation by a CHP unit. This constraint represents the power traded (selling power) in the energy market, and the capacity reserved instantaneously in the DA market for trading in the frequency regulation market.
6.3.3. EiB Unit Constraints (Equations (6a)–(6d))

Given that a CHP unit can function as a boiler, constraint (6a) represents the EiB, specifying the permissible limits for the input power of boiler unit g. Equation (6b) shows that the thermal power output for boiler unit g at time t under scenario ω is equal to the product of the input of electrical power and energy conversion efficiency of boiler. Constraint (6c) restricts the heat production of the boiler, a necessity due to the boiler’s finite heat storage capacity, which could potentially be exceeded by accumulated heat. The serves as a generic representation of the efficiency, illustrating the ratio of total energy output to total energy input for a boiler. Finally, equation (6d) represents the operational cost of the EiB.
6.3.4. Heat Accumulator (Storage) Unit Constraints (Equations (7a)–(7c))
6.3.5. Start-Up and Shut-Down Cost Constraints for Generator (CHP) (Equations (8a) and (8b))
Constraints (8a) and (8b) symbolize the start-up cost and termination cost associated with the operation of the CHP unit g, in accordance with scenario ω at time t. Binary variables Xg,ω,t serve to indicate the active (ON) and inactive (OFF) states of the CHP. Meanwhile, CSU and CSD signify both the costs incurred in initiating (starting-up) and in terminating (shutting down) a CHP unit, respectively. These costs represent the one-time costs required for the start-up and shut-down operations of the CHP unit.
6.3.6. Operational Constraints for WP and PV (Equations (9a) and (9b))
Constraints (9a) and (9b) illustrate the relationship between the power output of WP and PV and their randomly forecasted values. The variable nature of both WP and PV introduces uncertainty into their power output profiles. Hence, the power output range of both resources is constrained within the interval of zero and their forecasted power, signifying that the range of power output should not surpass the forecasted value. Further details on the forecasted error in WP and PV power are provided in Section 6.5.
6.3.7. Total Power Balance Constraints
6.3.8. Heat Load Balance Constraints
Equation (11) is the basic heat load balance constraints of the CHP and EiB.
6.4. FRRM and Its System Constraints (Stage 2)
Decisions within the FRRM are contingent upon the determinations made in the first stage (Stage 1). Subsequent are the system constraint models for those resources poised to deliver regulation services, which are based on the decisions made during the first phase of the two-stage stochastic model.
6.4.1. BESS Unit Constraints in Regulation Market (FRRM) (Equations (12a)–(12f))
BESS possesses the ability to follow the regulation signal. Hence, within a singular time interval, the charging and discharging state of the battery can exist in a binary form: either (1, 0) representing charging or discharging.
6.4.2. CHP Constraints in Regulation Market (FRRM) (Equations (13a) and (13c))
The constraints (13b) and (13c) demonstrate that if the CHP is engaging in downward/upward regulation, the amount of reduced/increased in regulation power must be within the operational bounds.
6.4.3. EiB Constraints in Regulation Market (FRRM) (Equations (14a) and (14b))
The equation constraints (14a) and (14b) depict that if the EiB is set to participate in downward/upward regulation, the amount of reduction/increase in heat (in terms of regulation power) must be within the operational bounds.
6.5. WP and PV Power Forecasting Error Calculation (Equations (15a) and (15b))
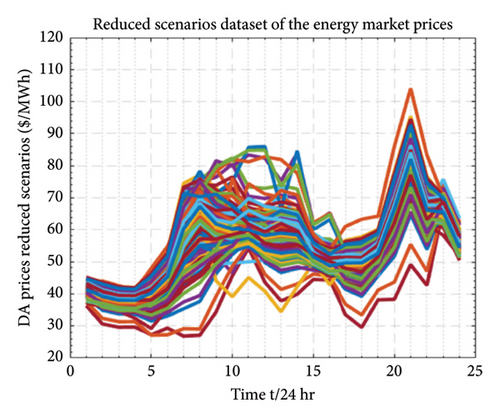
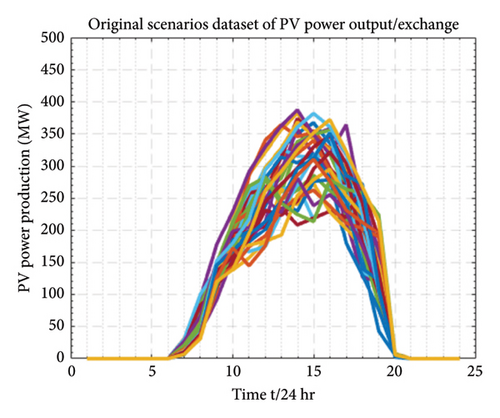
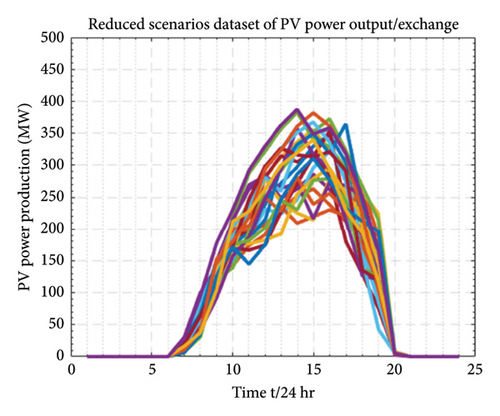
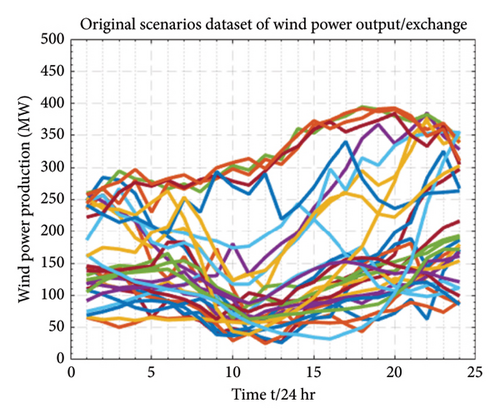
Equation (15a) formulates the forecasted error as the discrepancy between the actual power output and forecasted power, divided by both the installed WP and PV capacity. In (15b), B(a, b) is the beta function that normalizes the probability density function (PDF), where “a” and “b” are the shape parameters employed in the beta PDF to generate PDFs for different beta distributions. This equation signifies that under a given WP and PV forecast power condition, both the PV and WP forecast error follows the beta distribution. The analysis on scenario generation sets is carried out in Section 8.1, as demonstrated in Figures 5, 6, and 7. The generation and reduction of scenario sets employ the FFS&SR algorithm, and the forecasted errors are eliminated by the beta PDF distribution. The scenario generation set analysis builds future predicted possible scenarios that closely resemble the original set.

6.6. Risk Aversion CVaR Embedded in the Objective Function (Equations (16a)–(16c))
The first component of the multiobjective decision-making function, as demonstrated in (16a), represents the anticipated revenue accrued by the VPP, while the CVaR index is exhibited in the second term of the equation. Additionally, β serves as a weighting parameter that allows the VPP to manifest the balance between risk (CVaR) and anticipated profit (revenue), where β ∈ [0, 1]. The selection of β is directly tied to risk aversion decisions. For instance, a larger β value signifies a more risk-averse VPP. Generally, a risk-neutral VPP, which seeks to maximize its profit without considering risk factors, sets the β value to zero. The η denotes the VaR, while ζω is an auxiliary variable. Constraints (16a) and (16b) fulfill the requirements for the linear formulation of the CVaR metric incorporation into the model.
7. Proposed FFS&SR Algorithm (Equations (17a)–(17i))
For k = 1, …, n, where J[k − 1]≔{1, …, N}\{ω1, …, ωk−1}.
Here, and .
-
Step 1: The algorithm initiates by calculating the non-negative cost function value for each paired set of scenarios that comply with the Kantorovich distance, denoted as (17f).
-
Step 2: The iterative process commences by choosing an initial scenario that will contribute to the development of a condensed scenario set, which is mathematically depicted as ω2 in (17g). The chosen initial scenario ω2 can be thought of as an average scenario that will be distributed evenly from the rest of the scenarios.
-
Step 3: Following from the scenario selection in Step 2, during each iteration a new scenario is incorporated to the newly formed scenario set denoted as ωk in (17h). Here, is the set of the selected scenarios until Step 3. On the other hand, denotes the set comprising of those scenarios which have not been chosen in the Step 3. Furthermore, the current Step 3 is supposed to repeat times, where is the total number of scenarios containing reduced set .
-
Step 4 (the redistribution rule): As elaborated in (17i), the principle of probability redistribution is employed in this step. This rule instructs the incorporation of the probabilities of certain unselected final scenarios denoted as into the probabilities of those already comprising reduced set . As deduced from equation (17i), it can also be inferred that the optimal probability of each unselected scenarios is combined with the probability of closest selected scenario taking into account the cost function c(⋅). As a result, the set of reduced scenario is built from the scenarios associated with the probability .
-
Step 5 (Repetition): Steps 2 to 4 are iteratively performed until the required conditions for scenario reduction are met.
-
End of steps.
The discussion on simulation results of the proposed FFS&SR technique is detailed in Section 8.3.
8. Case Study
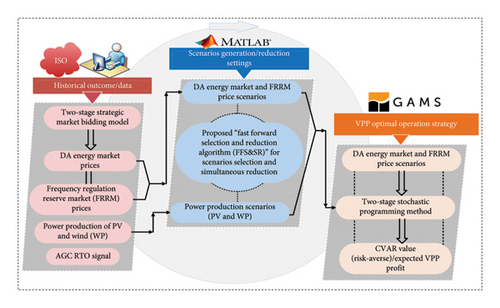
The case study presented here demonstrates the application of our proposed scenario-based risk-averse two-stage stochastic optimization model for the operational and scheduling decisions of a VPP. This case study, as illustrated in Figure 8, encompasses a comprehensive solution model of this paper, including the utilization of the PJM market environment for historical data collection, coding in MATLAB and GAMS platforms for the generation and reduction of scenarios, as well as for VPP optimal operation, scheduling, and bidding strategies.
8.1. Scenario Generation Settings
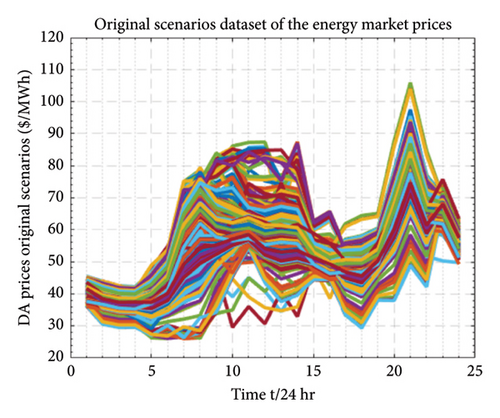
For this study, data including market prices were sourced from the PJM electricity market operator, encompassing DA and FRRM pricing, historical forecasts of wind and solar PV generation, and dispatched regulation signals under Reg-D. To predict next-day (D0 + 1) prices, we generated 13,000 random scenarios using April 2022 data [49]. Additionally, random scenarios for PV outputs and wind generation were derived from probabilistic historical data of April 2022 [50, 51], reflecting the inherent uncertainty in PV units and wind turbines. The large number of scenarios for our stochastic parameters, including renewable generation, demand, and pricing, represents the uncertainty inherent in decision-making problems. However, such a high number of scenarios renders the optimization problem complex and challenging to navigate. To achieve tractability and an optimal solution closely resembling the original problem, this study proposes the use of the fast forward scenario selection and reduction technique (FFS&SR). This approach streamlined the initial set of 13,000 DA scenarios to a more manageable 200 and then to 20, likewise, the random scenarios of PV and wind generation to 20. For a 24-h planning horizon, we selected these 20 reduced scenarios of market prices, PV, and WP production, focusing on the most likely occurrences in the uncertainty set. The probability of occurrence for these scenarios was set at 0.05. Figures 5, 6, and 7 illustrate the market price scenario generation and reduction process, and the output power production scenarios for wind and PVs, along with their reduced scenario set.
8.2. Case Settings
The operational parameters of our proposed aggregated VPP model, accommodating diverse heterogeneous resources, are detailed in Tables 1, 2, 3, and 4. It features three CHP units (each with a 30-MW maximum output, 16-MW/h ramp-up, 12-MW/h ramp-down limits), while a BESS unit with 40-MWh capacity and 20-MW charging/discharging power at 90% efficiency, based on data derived from [52]. Initially, CHP units start in an OFF state, activating with the bidding market. EiB and thermal/heat storage data, sourced from [53], include a 12-MW EiB unit at 90% efficiency and a 10-MWh thermal storage with 0.9 efficiency. Load profiles cover electrical (up to 320 MW) and thermal demands (up to 160 MW), with the VPP’s energy consumption set at 150 MWh. Additional resources are WP and PVs, with 450 and 400 MW capacities, respectively. Their operation is based on historical data reflecting inherent uncertainties. The maximum power for DA market trading is 800 MW, and for FRRM, it is 200 MW. The specific parameters for these resources are comprehensively listed that are employed in our VPP model, in the mentioned Tables 1, 2, 3, and 4.
| PCmax (MW) | PDmax (MW) | Emax (MWh) | Emin (MWh) | E0 (MWh) | EFFC () | EFFD () |
|---|---|---|---|---|---|---|
| 20 | 20 | 40 | 10 | 20 | 90% | 90% |
| Pmax (MW) | Pmin (MW) | VRC ($/MW) | OLC ($/h) | RU (MW/h) | RD (MW/h) | SUR (MW/h) | SDR (MW/h) | CSU ($) | CSD ($) |
|---|---|---|---|---|---|---|---|---|---|
| 30 | 10 | 40 | 6 | 16 | 12 | 20 | 10 | 80 | 60 |
| PCmax (MW) | PDmax (MW) | Emax (MWh) | Emin (MWh) | H0 (MWh) | EFFC () | EFFD () | PHL (MW/h) |
|---|---|---|---|---|---|---|---|
| 1.6 | 1.6 | 10 | 1 | 6 | 90% | 90% | 0.028 |
| Pmin (MW) | Pmax (MW) | Electric heat conversion efficiency |
|---|---|---|
| 1 | 12 | 90% |
8.3. Discussion on Proposed Fast Forward Scenario Generation and Simultaneous Reduction
The process of scenario reduction is an essential advantage for electricity market problem-solving, as it enables tractability within a large set of scenarios. The resultant reduced set appropriately characterizes the uncertainties involved, which are crucial for making informed market decisions [48].
8.3.1. Index-Based Comparative Analysis of Various Scenarios
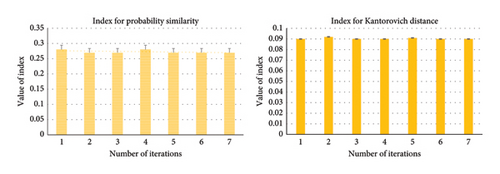
The proposed FFS&SR technique comparatively performs better showing robustness in scenario generation and simultaneously reducing for large number of scenarios. However, we find out that the critical problem lies in deciding a criterion of selecting the exact number of scenarios that could lead to an optimal solution. Thus, we present index-oriented criteria for choosing various number of scenarios. We have performed comparative analysis for different scenarios (20, 30, 40, and 50) to calculate the index of probability similarity and Kantorovich distance for different scenarios. In this course, we executed several numbers of iterations against the value of the index which led to some interesting and convincing results as illustrated in Figure 9. We noted that with the increasing number of scenarios, the index value greatly reduces. For instance, the value of the probability similarity index (difference of similarity between an original and reduced set of scenarios) in Figure 9(a), 9(b), 9(c), and 9(d) shows a downward trend with the increased number of iterations for various scenarios, depicting a close relationship of similarity between reduced and original scenarios. The increased number of scenario generations will lead to greater similarity of probability between the reduced sets and original ones. On the other hand, the comparison has also been established based on the Kantorovich distance metric for distinct scenarios to evaluate the value of indexes. The Kantorovich distance characterizes spatial features between original and reduced scenarios. From Figure 9, we can argue that the greater number of scenario generations results in a declining value of Kantorovich distance due to relatively lower distance among respective scenarios.


8.3.2. Comparative Analysis Based on FFS&SR’s Robustness and Optimality Gap
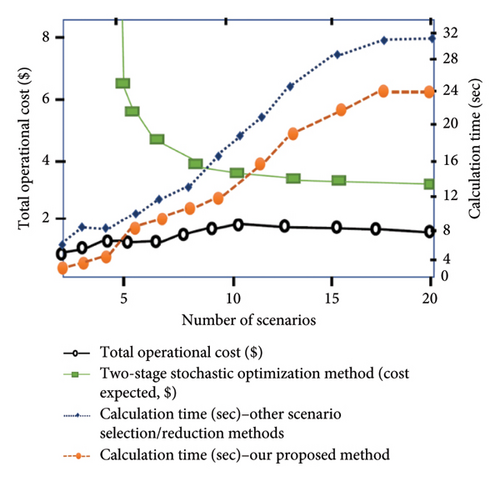
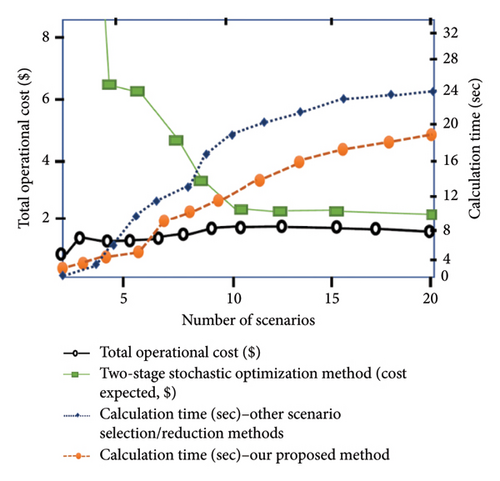
The proposed fast forward selection and reduction algorithm in this paper (detailed in Section 7) is further compared with existing scenario generation and reduction techniques previously examined and studied in the literature [47, 54–56]. This comparison is based on two critical differentiating factors: (1) the duration of computation during the scenario selection and reduction process and (2) the overall optimality gap. The duality gap was set at 1.0% for this analysis, which estimates the minimum number of scenarios required to achieve solution stability with reduced computational burden and a lower optimality gap. The findings in [47] indicate that solution stability is reached only when approximately 30 scenarios are considered. However, this approach employs a risk-neutral cost function, enabling a stable solution with a reasonably sized scenario set. In contrast, the risk-averse case tried in this work led to additional computational challenges due to the complexity of the cost function. The study in [54] compares various scenario reduction techniques based on operating costs and the computational time required for stochastic UC. The uncertainty model in scenario-based stochastic UC generates a single schedule for a given scenario set, aiming to minimize the expected operating cost over all scenarios. Unlike our study’s outcome, the extreme scenarios with low probabilities in this paper contributed to higher optimality gaps and increased computational time, as these scenarios emphasize minimizing operating costs for more probable, less extreme scenarios. The cost function proposed by Dupačová et al. in [55] demonstrates broad applicability across various problem settings but performs inadequately in stochastic environments. The resulting median computation time ranges from 50 to 60 s, and the method often fails to converge to the optimal solution, leaving optimization incomplete. Similarly, the study in [56] advocates using minimal information distance for best approximation methods, emphasizing close probability relationships in scenario generation, reduction, and optimality gap minimization. While this approach suggests higher convergence rates and faster computation, its numerical findings do not substantiate the theoretical and mathematical claims. Moreover, their method is better suited for smaller scenario counts (5 to 10), as it relies on stability estimates derived solely from problem-specific data without broader informational constraints.
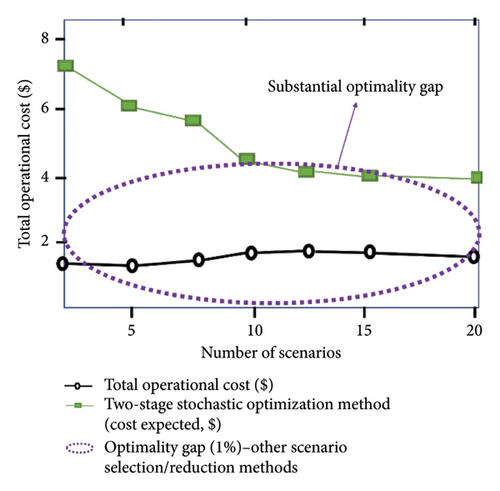
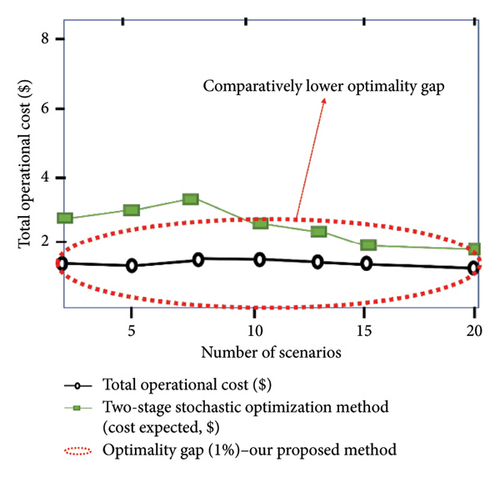
Within the context of the two-stage stochastic optimization method, our results are simulated under the assumption of 20 random scenarios related to the total operational cost, as shown in Figures 10 and 11. Figures 10(a) and 10(b) depict the production and simultaneous reduction of scenarios from the initial 20 random scenarios, demonstrating superior efficiency in comparison with other scenario generation and reduction techniques [47, 54–56] in terms of lower computational time and computational burden, as well as diminished operational costs. A substantial optimality gap was observed between the total operational cost and the expected cost when other scenario selection and reduction techniques were utilized, as illustrated in Figure 11. In contrast, our proposed method displayed superior performance by minimizing the optimality gap, more accurately capturing the range of operational cost against the expected cost. In summary, the FFS&SR technique excels in generating and simultaneously reducing scenarios, achieving the least expensive actual operating cost, the fastest solution time, and the lowest computational requirements to reach optimality. Its performance surpasses existing methods by ensuring solution stability with fewer scenarios and reduced computational overhead.
8.4. Discussion on Optimal Operation and Bidding Strategy of VPP
The historical real-time operation data of the Reg-D signal from PJM (September 2020) [57] have been utilized to simulate the VPP resources’ response. Frequency regulation capacity in FRRM involves reserving a specific capacity by a resource to follow AGC signals, earning capacity payments for reserved capacity, and mileage payments for actual delivery. Our simulations across various scenarios over a 24-h period indicate an optimal VPP performance, with a total expected profit of $22,456. This profit results from all DERs actively participating, generating social welfare in both the DA energy market and FRRM. However, this approach is more suited to less risk-averse VPPs (risk-neutral), which overlook potential risks in revenue generation linked to scheduling decisions. In contrast, more risk-averse VPP, considering worst-case scenarios and CVaR, are discussed further in Section 8.6. It can be noticed that VPP in the proposed risk-averse environment yields a total expected profit of $21,383 respecting potential risks while generating profits linked to scheduling decisions.
8.5. Comparative Results for VPP’s Optimal Bidding Strategy in DA and FRRM
The bidding strategy in this problem is mounted on a two-stage stochastic programming problem. (1) First-stage (here-and-now) bidding decisions: It utilizes the average price and power values to determine the optimal DA bidding decisions. (2) Second-stage (wait-and-see) recourse decisions: After the determination of the first-stage bidding decisions, the recourse decisions in the second stage are undertaken. For simplicity, we denote operating day with D0, and DA bidding with D0 + 1. The comparative bidding results are premised on the optimal power exchange in the DA energy and FRRM markets (up and down), across a 24-h timescale.
8.5.1. DA Bidding
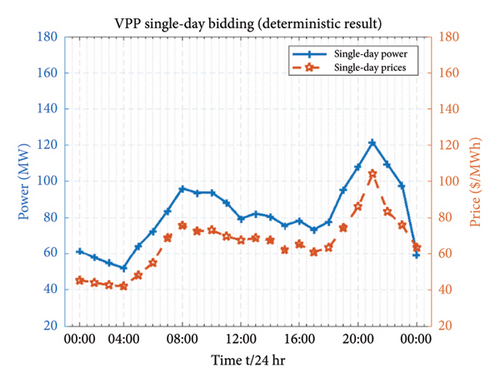
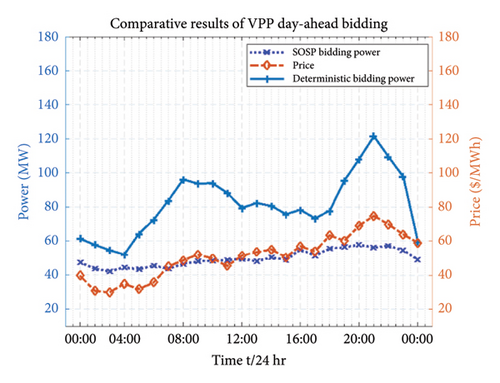
In order to get the optimal bidding decisions for VPP in DA energy market, we have further compared and differentiate the bidding results on two aspects, that is, deterministic bidding (D0) power for a single operating day and scenario-oriented stochastic programming (SOSP) bidding power (D0 + 1). The comparison has been drawn by taking the average values of market prices (PJM market results) which are assumed to be predicted through the price predictor. The deterministic bidding result for the single day (focuses on first-stage decision) has been illustrated in Figure 12(a) showing the average values of market prices as an input parameter to determine the deterministic bidding power. We notice relatively higher market prices and deterministic bidding power results in the evening hours (16:00–21:00) due to peak energy consumption. Additionally, the SOSP bidding decisions for the next bidding day (D0 + 1) have been conducted for each scenario. As explained earlier in this paper, we have generated and reduced large set of scenarios by utilizing FFS&SR. The SOSP is a recourse decision stage which predict and determine the bidding decision for next day. The comparative DA bidding results for the VPP are demonstrated in Figure 12(b). The deterministic bidding power stays higher for the whole 24 h compared with the SOSP bidding power. We can notice higher stochasticity in prices for SOSP to perform bidding decisions in the next operating day.
8.5.2. FRRM Regulation DN
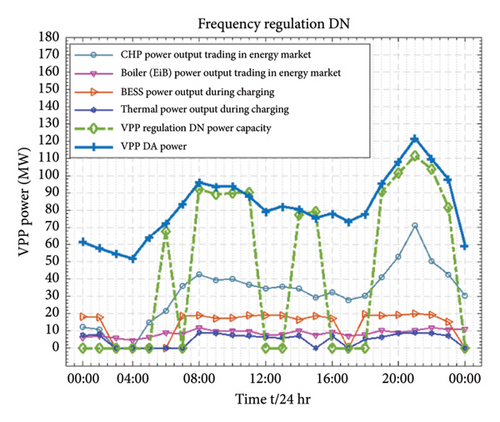
A fully operational VPP responds to the reserve request signal from the independent system operator (ISO), deploying its reserved capacity to meet the actual scenario requirements. Key periods for maximum downregulation are identified as (08:00 to 11:00), (14:00), and (19:00–23:00), exemplifying the best instances for downregulation (Reg-DN) in a 24-h span. During these times, the VPP manages overproduction and surplus load by regulating downward, thereby maintaining optimal power levels. In response to the Reg-D signal, VPP resources participating in FRRM reduce their power production (increasing consumption) to fulfill the downregulation requirement. This process is illustrated in Figure 13(a). The storages such as BESS and thermal (heat) begin their charging; meanwhile, EiB and CHP units maintain their operational status for consistent power output. Notably, market prices tend to peak in the evening (19:00 to 23:00), offering a lucrative opportunity for the VPP to sell energy in the DA market, thereby maximizing profits.
8.5.3. FRRM Regulation UP
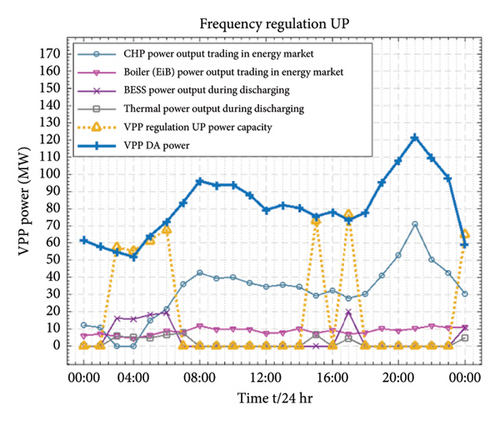
Regulation up highlights specific times when the VPP is most likely to engage in trading capacities in upward direction derived in Figure 13(b). During certain periods, specifically (03:00–05:00), (17:00) and (24:00), the VPP utilizes its resources to execute upregulation (Reg-Up). In response to the Reg-D signal, the VPP maximizes its capacity for upward regulation, ensuring adequate reserve capacity for these intervals. These periods are characterized by lower market prices and decreased power consumption and generation, leading the VPP to experience a generation deficit. Consequently, it purchases power from the energy market to fulfill the upward regulation requirements. To support this regulation, specific resources designated for FRRM, such as the BESS and thermal power units, start to discharge, while the EiB and CHP units contributing their respective capacities to compensate for the FRRM. Reg-Up illustrates how the VPP strategically deactivates and activates various resources, aligning with the market conditions and regulatory demands.
8.5.4. Simultaneous FRRM Regulation (UP and DN)
Herein, we have explored a unique situation where the VPP engages in simultaneous FRRM regulation, exhibiting both upward and downward trends. This occurrence is highlighted in the (06:00) and (15:00) time slots, as illustrated in Figure 13. In these specific time durations, the VPP responds to the Reg-D command signal, which necessitates an adjustment of capacities in both upward and downward directions. This signal prompts the VPP to strategically manage the operations of its resources. As a result, the VPP’s resources are directed to provide capacities in a dual, bidirectional manner. Such simultaneous regulation capability demonstrates the VPP’s advanced operational flexibility. It shows the VPP’s ability to rapidly adapt to varying market and regulatory conditions by modulating its resource outputs to meet the dynamic requirements of the FRRM. The VPP’s effective response to the Reg-D signal in this scenario underlines its potential in maximizing operational efficiency and market participation effectiveness.
8.6. Risk Assessment Under CVaR
- 1.
A more risk-averse strategy leads to the VPP trading a lower volume of energy in the energy market compared to a risk-neutral approach. High-risk aversion curtails the VPP’s selling and buying activities in the DA energy market.
- 2.
CVaR is a critical metric for optimizing VPP performance. Higher CVaR values typically guide the VPP towards achieving greater benefits.
| Risk scenario situation | Risk-aversion parameter β | Worst-case scenario CVaR ($) | Expected profit/operation cost ($) | VPP framework |
|---|---|---|---|---|
| 1 | 0.0 | 19572.17 | 22456.83 | Risk-neutral VPP |
| 2 | 0.1 | 19593.47 | 22303.02 | — |
| 3 | 0.2 | 19702.35 | 22114.22 | — |
| 4 | 0.3 | 19763.05 | 21905.01 | — |
| 5 | 0.5 | 19832.14 | 21711.32 | — |
| 6 | 0.7 | 20163.82 | 21603.03 | — |
| 7 | 0.9 | 20697.22 | 21493.42 | — |
| 8 | 1.0 | 21064.05 | 21383.07 | Proposed risk-averse VPP |
These conclusions underscore the importance of risk consideration in VPP operational strategies, particularly when engaging in energy market transactions.
8.7. Computation Efficiency
The proposed optimization problem is formulated as MILP model and solved in GAMS commercial software (version 24.3.3) [58] utilizing high-performance IBM CPLEX solver (12.6.01). The experimental results of the proposed two-stage scenario-based stochastic optimization model are executed through a PC with Intel (R) Core (TM) i7-9700 CPU 3.60 GHz processor with 32 GB of memory. The time required for computational execution is approximately 5 s, for efficient solution of the proposed model framework.
9. Discussion and Practical Implications of the Research Findings
9.1. Summary of Key Findings
This study presented a risk-averse two-stage stochastic optimization model designed for VPP operations in the DA and FRRM. Significant contributions encompass the incorporation of slow-ramping resources (e.g., CHP, EiB, and thermal storage) alongside fast-ramping resources (e.g., BESS) into a cohesive framework. The suggested approach utilizes the adaptability of various DERs to improve operational efficiency and market profitability, tackling significant issues encountered by VPP operators in multienergy markets.
A distinctive feature of this study is the FFS&SR algorithm, which emerged as a critical methodological innovation. This algorithm guarantees computational efficiency in handling extensive uncertainties in DER operations. It provides a streamlined approach to scenario reduction, preserving essential variability while minimizing computational burdens. The simulation results validated the proposed model over a 24-h planning horizon period across multiple scenarios, yielding a total expected profit of $21,383 through the optimal utilization of aggregated resources. Furthermore, the analysis revealed that the proposed model not only improved computational efficiency but also ensured scalability for larger systems with the higher number of scenarios, all while retaining performance within reasonable timeframes. The trade-off between risk aversion and profit maximization was evident; as with increasing values of the risk aversion parameter, expected profits showed a decline, but the CVaR value consistently increased, demonstrating enhanced risk mitigation. For example, under higher risk aversion, profits declined by a quantifiable amount, while the CVaR value aligned more closely with operators’ reliability expectations, underscoring the adaptability of the framework to varying risk preferences.
Moreover, the model demonstrated superior performance in dual-market environments, effectively optimizing bidding strategies for both DA and FRRM participation. The comparison between the risk-neutral VPP framework and the proposed risk-sensitive approach highlighted the latter’s ability to adapt to varying levels of risk aversion while preserving operational efficiency. Specifically, the model showed a marked improvement in flexibility, enabling operators to adjust resource allocation dynamically to respond to market fluctuations. The findings provide critical insights into how integrating diverse DER types and tailoring bidding strategies to specific market conditions can offer significant economic and operational benefits. By fully utilizing the strengths of aggregated resources, the framework supports an adaptive and resilient energy management strategy. These results lay the groundwork for a robust framework that enables VPP operators to navigate complex and uncertain energy markets with increased confidence and adaptability, providing a practical roadmap for enhancing grid reliability and market profitability.
9.2. Practical Recommendations for Engineers and Decision-Makers
This study’s findings offer practical insights for VPP operators, market regulators, and policymakers.
9.2.1. Optimized Bidding Strategies
Engineers overseeing VPPs can implement the proposed two-stage stochastic optimization model to improve bidding strategies in DA and FRRM. The incorporation of diverse DERs allows operators to leverage the adaptability of fast-ramping resources like BESS for frequency regulation while ensuring stability through slow-ramping assets such as CHP and thermal storage. This kind of strategy enables engineers to maximize profits while ensuring operational reliability throughout the varying market conditions.
9.2.2. Resource Allocation
Decision-makers are fortified to prioritize HES that integrate BESS and thermal storage to enhance flexibility and market benefits. This integration ensures optimal resource utilization, enabling responses to both short-term market fluctuations and long-term energy demands. By adopting these methods, engineers can uphold grid stability while improving revenue streams.
9.2.3. Risk Management
The adoption of the risk-averse framework, incorporating metrics such as CVaR, VaR, and SP, is recommended to alleviate market uncertainties. These solutions enable operators to reconcile profit goals with operational dependability, especially in volatile market conditions. Engineers can use these metrics to develop more robust operational plans that minimize potential losses while capitalizing on favorable market opportunities.
9.2.4. Regulatory Adaptation
Policymakers should consider designing regulatory frameworks that incentivize participation in ancillary services markets like FRRM. For instance, higher compensation for fast-ramping capabilities can encourage broader adoption of the proposed approach. Engineers, in turn, can leverage these incentives to execute advanced DER strategies that conform to regulatory standards, fostering innovation, and market engagement.
9.2.5. Market-Specific Implementation
Engineers should tailor the implementation of the proposed framework to meet the distinct requirements of their market. For example, while the CAISO distinguishes rules for upward and downward regulations, PJM treats them as a unified entity. Modifying or adapting the model to such variances can enhance its practical efficacy. By aligning operational strategies with market-specific rules, engineers can achieve higher efficiency and ensure compliance with regulatory standards.
9.2.6. Scenario-Driven Planning
Engineers can employ the FFS&SR algorithm to enhance scenario-driven planning through the effective management of large-scale data and uncertainties. This approach supports decision-makers in formulating precise, scalable strategies that adapt to dynamic energy market conditions.
9.3. Applications for Real-World Decision-Making
This research provides VPP operators with a strategic roadmap for navigating dual-market participation. By integrating the FFS&SR algorithm, operators can streamline computational efforts while maintaining high levels of accuracy in forecasting and decision-making. The methodology’s flexibility makes it suitable for diverse operational contexts, such as integrating RESs or expanding HES solutions. Furthermore, this approach allows for more efficient utilization of DERs in markets with fluctuating demand, allowing operators to synchronize their plans with immediate opportunities and enduring sustainability objectives.
For market regulators and policymakers, the study highlights the importance of enabling frameworks that support risk-averse decision-making and resource integration. Specifically, incentivizing the adoption of slow-ramping resources alongside fast-ramping assets can improve grid stability while ensuring economic viability. Additionally, policymakers are urged to establish common protocols and market regulations that enable the seamless involvement of VPPs across diverse markets. The proposed approach further aligns with global efforts to transition to low-carbon energy systems advocating for effective DER usage, improving energy security, and diminishing greenhouse gas emissions. Moreover, the integration of scenario-based optimization tools like FFS&SR provides actionable insights for addressing regulatory complexities, especially in regions with diverse energy policies. By incorporating these strategies, decision-makers can bridge the gap between theoretical optimization models and practical implementations, driving the adoption of innovative energy solutions at scale.
9.4. Limitations of the Study
- 1.
The model presumes optimal or ideal market conditions characterized by perfect competition and deterministic market price inputs. These assumptions streamline the research analysis but may inadequately reflect the complexities of real-world markets, such as price volatility, unpredictable market dynamics, and noncompetitive behaviors. Incorporating stochastic price models and imperfect market conditions in future work could enhance the model’s applicability and relevance.
- 2.
The exclusion of real-time market participation constrains the study’s scope to DA and FRRM. Real-time bidding strategies introduce unique challenges, including swift fluctuations in market prices and operational demands, necessitating sophisticated real-time optimization techniques. Future extensions could explore how the proposed framework performs under real-time market constraints and its ability to adapt dynamically to unforeseen changes.
- 3.
The FFS&SR algorithm, although highly effective in reducing computational burden, entails trade-offs that could result in the exclusion of low-probability but high-impact scenarios. This may lead to underestimating risks associated with extreme market events. Developing enhanced scenario generation techniques that balance computational efficiency with accuracy in representing such events is a potential direction for future research.
- 4.
The study’s emphasis on CHP, boiler, thermal storage, and BESS excludes the inclusion of emerging technologies such as hydrogen storage systems (HSSs), advanced electric vehicle (EV) aggregation, and vehicle-to-grid (V2G) systems. These technologies could markedly improve the flexibility and robustness of VPPs. Future work should consider incorporating these advanced resources to evaluate their potential impact on market performance and grid stability.
- 5.
The proposed framework does not account for regional regulatory and operational differences that might impact VPP performance. Markets across different regions vary significantly in their rules for ancillary services and bidding strategies. Expanding the study to include case studies from diverse regulatory environments would provide insights into the model’s global applicability and adaptability.
10. Conclusions
This paper proposed an optimal risk-averse strategy for a VPP that incorporates several DERs, participating in both the DA energy market and the FRRM. The core of this approach centers on a two-stage stochastic scenarios-oriented optimization method, designed to maximize VPP profits while managing operational risks from uncertainties in both the market and the operation of DERs. The utilization of the CVaR metric establishes a robust, risk-averse framework that accounts for fluctuations in profits and costs. These fluctuations stem from uncertainties in renewable generation such as WP and PV power, market conditions like electricity prices, and varying demand levels. This method provides a more reliable and economically sound strategy for VPP operators, ensuring better preparation for unexpected market conditions and augmenting long-term system stability.
- 1.
The proposed risk-averse VPP strategy employs a two-stage stochastic optimization model designed to maximize profits while managing operational risks caused by uncertainties in electricity prices, renewable generation, and demand levels. This model helps achieve a more reliable and economically sound VPP operation in both DA and FRRM markets.
- 2.
A novel contribution of this study is the FFS&SR algorithm, which efficiently models large-scale uncertainties while minimizing the computational burden. This innovation renders the proposed method applicable for real-time operations, allowing the VPP to handle complex market conditions with enhanced efficiency.
- 3.
Through a 24-h simulation, the VPP achieves $21,383 in expected profit by optimally leveraging its aggregated resources in both the DA and FRRM markets. This demonstrates how integrating diverse DERs into a unified framework can enhance profitability while ensuring operational stability and resilience to market fluctuations.
- 4.
The analysis reveals a trade-off between risk aversion and profit maximization. As the risk aversion parameter increases, the VPP tends to bid lower quantities of energy in the market, which leads to lower profits but better protection against market volatility, as evidenced by the higher CVaR values. Conversely, the risk-neutral approach allows the VPP to trade higher volumes of energy, exposing it to higher market risks but offering higher profits. This highlights the importance of adjusting bidding strategies based on the level of risk tolerance, allowing the VPP to adapt to market conditions while managing risk effectively.
- 5.
The VPP’s ability to engage in both upward and downward regulations within the FRRM further enhances its operational flexibility. This capability allows the VPP to respond dynamically to fluctuating energy demands and grid conditions. During downward regulation, the VPP reduces its generation or increases consumption to accommodate surplus energy, whereas, in upward regulation, the VPP increases generation or curtails consumption to meet higher demand. This flexibility maximizes profitability by capitalizing on market conditions, while simultaneously supporting grid stability by maintaining optimal power levels and avoiding imbalances.
Despite notable advancements in VPP research, high-level uncertainties remain, particularly due to the heterogeneous nature of distributed generation sources and variable demand. These uncertainties pose ongoing challenges, especially in the ancillary services market, where more robust solutions are required to adeptly navigate these complexities. Specifically, there is a need for better integration of slow-ramping and fast-ramping resources within the ancillary services markets to optimize the use of all available DERs. Future work could focus on improving the bidding strategies for VPPs, optimizing operations and scheduling in the presence of stochastic DER parameters, and addressing the limitations in the current market frameworks. Additionally, there is a growing need to refine optimization models for real-time market dynamics, particularly in the face of unpredictable price fluctuations and abrupt shifts in supply and demand. A prospective area of research focus is the integration of emerging DER technologies, like hydrogen storage and V2G systems, which could substantially improve the adaptability and market engagement of VPPs. By incorporating, these advanced technologies into hybrid systems may enable future studies to assess their economic viability, operational efficiency, and environmental impact, thereby augmenting VPP capabilities. Moreover, multioperator frameworks could be investigated to resolve regulatory inconsistencies and ensure seamless coordination across regional and national grids. Standardized protocols and interoperable systems could facilitate better collaboration among various market operators, enabling VPPs to optimize their operations over broader geographical regions.
Nomenclature
Acronyms
-
- VPP
-
- Virtual power plant
-
- DERs
-
- Distributed energy resources
-
- PV
-
- Photovoltaic
-
- CHP
-
- Combined heat and power
-
- DA
-
- Day ahead
-
- FRRM
-
- Frequency regulation reserve market
-
- RTO
-
- Real-time operation
-
- CVaR
-
- Conditional value at risk
-
- FFS&SR
-
- Fast forward scenario selection and simultaneous reduction
-
- UP
-
- Regulation up (upward direction)
-
- ACM
-
- Accumulator (for heat accumulation/storage)
-
- MILP
-
- Mixed-integer linear programming
-
- CAISO
-
- California ISO
-
- Reg-D
-
- Regulation signal D
-
- MEVPP
-
- Multienergy virtual power plant
-
- BESS
-
- Battery energy storage system
-
- WP
-
- Wind power
-
- EiB
-
- Electric immersion boiler
-
- EM
-
- Energy market
-
- AGC
-
- Automatic generation control
-
- FORs
-
- Feasible operation regions
-
- VaR
-
- Value at risk
-
- MLG
-
- Mileage (regulation mileage)
-
- DN
-
- Regulation down (downward direction)
-
- PDF
-
- Probability density function
-
- PJM
-
- Pennsylvania, New Jersey, and Maryland
-
- ISO
-
- Independent system operator
-
- SOSP
-
- Scenario-oriented stochastic programming
Indices and sets
-
- g
-
- Index of the generators or generating units, BESS, PV, WP, CHP, and EiB
-
- t
-
- Index for time (h)
-
- C
-
- Cost of generators
-
- e
-
- Index for the number of extreme points
-
- η
-
- Index for value at risk (VaR)
-
- ωi,
-
- Scenario sets in FFS&SR algorithm technique
-
- ω
-
- Index of scenario/s
-
- N
-
- Set of total number of generators
-
- ω ∈ Φn
-
- Index and set of predefined values for uncertainties modeling
-
-
- Index for combination coefficient of the e − th extreme point
-
- P,
-
- Probability measure set
Parameters
-
-
- Parameter for day ahead energy market revenue in time t ($)
-
-
- Operational cost of the system in time t ($)
-
- , ,
-
- Operational cost of CHP units, degradation cost of BESS, operation cost of electric immersion boiler (EiB), with scenario ω in time t
-
- Δt
-
- Length of time scheduling interval (h)
-
- ΠcapϒupΔt, −ΠcapϒdnΔt
-
- FRRM’s capacity price trade (up and down) in length of time scheduling interval t ($)
-
- α
-
- Confidence level
-
-
- Energy or SOC of BESS with scenario ω in time t
-
- ηch, ηdis
-
- Charging and discharging efficiency
-
-
- Heat accumulator
-
-
- Cost-to-startup and cost-to-shutdown CHP unit g
-
- ,
-
- BESS total energy charged/discharged in FRRM
-
-
- Ancillary service market revenue (frequency regulation reserve market) in time t ($)
-
-
- Prices in energy and FRRM market at time interval t in ($)
-
-
- Mileage price with scenario ω in time t ($)
-
- Γω
-
- Weight/probability of scenarios ω
-
- β
-
- Risk aversion (weighting) parameter
-
-
- Degradation cost of BESS unit g with scenario ω in time t ($)
-
- ,
-
- Maximum and minimum SOC of BESS g
-
-
- Initial and final state of energy (BESS)
-
- ,
-
- Startup and shutdown cost of CHP unit ($)
-
-
- BESS SOC in FRRM
Variables
-
- Eω[⋅]
-
- Expected values (probability of scenarios)
-
- ζω
-
- Scenario-specific auxiliary variable to calculate CVaR
-
-
- BESS maximum and minimum charging and discharging power condition
-
- ,
-
- BESS UP and DN regulation capacity trade
-
-
- CHP operation cost at the e − th extreme point
-
- ,
-
- Regulation capacities (UP and DN) reserved at the DA ahead stage
-
- ,
-
- Heat storage and released power
-
-
- Binary state variables for heat storage
-
- ,
-
- Actual PV power values and forecasted PV power values
-
-
- BESS’s regulation power capacities in FRRM
-
-
- Rated power capacity of BESS
-
- ,
-
- Purchasing power and selling power
-
-
- Maximum and minimum power bids in the energy market in time t
-
- ,
-
- BESS charging/discharging rate
-
- ,
-
- Electrical and thermal CHP’s output
-
-
- Power bids in the energy market
-
- ,
-
- Power and thermal output of EiB
-
- ,
-
- Initial and final states of heat storage
-
- ,
-
- Actual wind power values and forecasted wind power values
-
- ,
-
- Basic power and heat load of the whole VPP system
-
-
- Base power of BESS in FRRM
-
- κc
-
- Kantorovich functional or Kantorovich distance
Decision Variables
-
-
- Power traded in the DA energy market (MW)
-
- μMLG
-
- Mileage factor
-
-
- Cost allocation factor for EiB
-
-
- Regulation capacity bids in up and down direction in the FRRM
-
-
- Degradation cost factor for BESS unit g
Binary variables
-
- Xg,t or Xg,ω,t
-
- Binary variables for generators (CHP) ON/OFF status
-
-
- Binary variables for BESS unit g at time t
Conflicts of Interest
The authors declare no conflicts of interest.
Author Contributions
A.M. conceptualized the study, along with conducting the methodology, software, investigation, resources, data curation, and writing the original draft; Z.H. supervised the whole study as well as the methodology, validating results, formal analysis, review and editing the manuscript, and process the funding acquisition; J.W. took part in validating the resources and data curation, as well as conceptualization of the study; R.D. and L.L. were responsible for data curation, investigation, and visualization of the study; Z.B. reviewed and edited the concept, and validated the software and results. All authors have read and agreed to the published version of the manuscript.
Funding
This work was supported by the National Key Research and Development Program of China (Grant No. 2022YFB2403900).
Acknowledgments
This work was supported by the National Key Research and Development Program of China (Grant No. 2022YFB2403900).
No AI software or tools have been used to prepare the manuscript.
Open Research
Data Availability Statement
The datasets generated to support the findings of this study can be made available from the corresponding author upon reasonable request.


