Joint Optimization of Multienergy Virtual Power Plant Configuration and Operation Considering Electric Vehicle Access
Abstract
The problems of energy shortage and environmental pollution can no longer be ignored. How to make the best of energy and improve energy efficiency has always been a concern of researchers. The rapid development of electric vehicles (EVs) has made them an energy load that cannot be ignored. On this basis, an optimal configuration model of a multienergy virtual power plant (MEVPP) considering EV access is constructed to meet the multiple energy needs. To better consider EV users’ willingness to respond, this paper combines price demand response (PDR) with incentive demand response (IDR), establishes a fuzzy response model for EV charging and discharging under the joint response strategy (JRS), and analyzes the influence of user responsiveness and large-scale EV access on MEVPP planning and operation under different incentive levels. Meanwhile, to realize the low carbon, a stepped carbon trading mechanism (SCTM) is introduced. Based on the gazelle algorithm and mixed integer linear programming (MILP), the capacity and output of the system energy equipment are jointly optimized, and the running curve of MEVPP in a typical quarter is analyzed. The example analysis shows that the joint response strategy proposed reduces the operating cost by 7.1%, and the introduction of SCTM reduces the carbon emission by 13.7%, realizing the low-carbon and economic running of MEVPP.
1. Introduction
As the energy crisis intensifies and the greenhouse effect intensifies, it is particularly important to develop a sustainable energy system [1]. WT, PV, and other renewable energy (RE) have the characteristics of clean and renewable, to making the best of them is the key to realizing China’s “double carbon” goal. Under the new situation of energy development, VPP technology has developed rapidly because of its characteristics of integrating power generation resources and improving energy production and utilization [2]. Controllable loads such as EVs, RE, and energy storage (ES) have gradually become the main body of controllable aggregate resources inside VPP [3–5].
At present, domestic and overseas researchers have carried out some studies on VPP. Reference [6] makes a detailed analysis of the technical difficulties and solutions of trusted transactions in VPP and looks forward to its future development. Reference [7] presents an optimal allocation method for distributed generation and DR resources in a VPP. Reference [8] has built a VPP electric heating capacity optimal allocation model aiming at the economic optimization of WT transmission in regional grid protocol. Reference [9] explores the problem of optimal allocation of multiple power sources capacity in a VPP and thinks the uncertainty of RE output and electricity price. The energy storage characteristics of EVs make them an aggregable resource in VPP, which is not taken into account in the VPP studied in the above reference. Reference [10] proposes an optimal allocation method of ES in distribution networks considering the aggregation regulation of EVs, and results show that the carbon emissions are reduced and the photovoltaic utilization rate is improved. In Reference [11], the optimal allocation model of frequency modulation capacity of VPP with ES, EV, and thermal power units is established thinking the response uncertainty of EVs. Given the impact of renewable distributed power supply and large-scale EV access on the distribution network, Reference [12] proposes an optimal configuration method of distributed power supply and EV charging stations based on space-time characteristics and DR. Reference [13] sets up thinking EV-VPP photovoltaic high flexibility and access model of distribution network planning. The proposed model reduces the planning and running costs and increases the absorption rate of photovoltaics. However, the modeling and analysis process of the response behavior of EVs in the abovementioned reference is relatively simple. In real life, the response behavior of EV users will be affected by many factors, including charging cost and battery discharge loss. Therefore, the user’s willingness to respond should be fully considered, which will be conducive to formulating a reasonable response strategy to optimize the EV load.
The effective use of a variety of energy sources, including RE, is the focus of applied energy research, which can improve energy efficiency through the way of multienergy complementarity [14]. The operation process of traditional VPP lacks multienergy coupling supply and demand optimization means and flexible peak regulation strategy, while VPP uses information technology to provide a development direction for the transformation of the energy system structure [15–17]. Reference [15] has built an optimal scheduling model based on the cooperation of VPP and electricity-heat-gas IES, and the results show that the system has a better economy and environmental protection. In Reference [16], an multienergy virtual power plant (MEVPP) including a PV plant, WT plant, and ES battery was built, and a two-stage optimal scheduling model was established. In Reference [17], aiming at the problem of insufficient interaction between energy supply and demand in a comprehensive energy scenario, an optimal operation model of a VPP was established thinking the participation of multiple energy coupling devices and demand response. At present, most of the reference on MEVPP is studied from the perspective of optimizing operation, while research on optimizing configuration is rare. The optimal configuration is the premise and basis of optimal scheduling. Therefore, it is important to study the optimal allocation of MEVPP.
For the model solution method, most of the literature uses a two-layer optimization solution method. The upper layer mostly uses genetic algorithms, particle swarm optimize (PSO) algorithms, gray wolf algorithms, tree species algorithms, and so on [18]. The lower layer algorithms invoke the CPLEX solver for solving, and most of them have economy as the optimization objective, and some of the literature consider the indicators of power supply reliability, low carbon, safety, and so on [19–21]. However, all of the abovementioned algorithms were proposed very early, and there are inevitably problems of low solving efficiency and solving accuracy when solving the model.
On this basis, the MEVPP optimization model considering EV access is constructed to meet the various energy needs. To better optimize the EV load of the access system, this paper combines PDR and IDR to establish a fuzzy response model of EV load under JRS so as to better consider the user’s response willingness. The effects of user response and the number of large-scale EVs on MEVPP planning and operation under different incentive levels were analyzed. In this case, the JRS proposed can improve the low carbon economy and improve the rationality planning and operation. Meanwhile, the SCTM is introduced to further realize the low carbon. Based on the gazelle algorithm and MILP, the capacity and output of energy equipment of the system are jointly optimized, and the running curve of MEVPP in typical quarters is analyzed. Example analysis shows that the joint response strategy proposed can decrease the running expense of MEVPP by 7.1%, and the introduction of the SCTM reduces the carbon emission by 13.7%, which realizes the low-carbon economic running of MEVPP.
2. Structural Diagram of MEVPP Considering EV Access
Figure 1 displays the structure of the MEVPP build. The energy facilities included in the MEVPP model are as follows: WT, PV, combined heating and power (CHP), gas boiler (GB), absorption cooler (AC), electric cooler (EC), electric boiler (EB), electric ES (EES), cold ES (CES), and heat ES (HES). Thus, a multienergy coupled VPP polymerization unit is constructed.
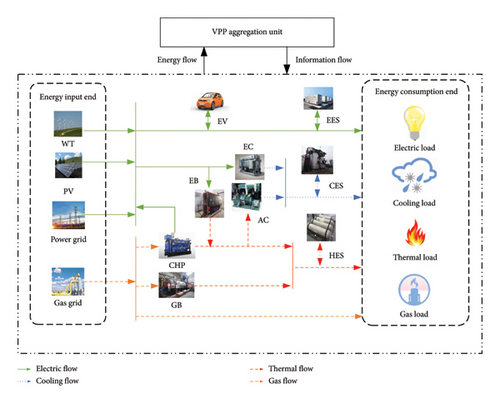
By using advanced information technologies such as the internet of things and big data, VPP establishes an interactive platform for information flow and energy flow to realize the operation and management of VPP. MEVPP manages a variety of aggregated controllable resources within it through unified scheduling, which can achieve efficient complementary utilization of heterogeneous energy and meet a variety of energy consumption requirements.
2.1. EV-JRS Model
Monte Carlo simulation is a simulation statistical method whose practical application scenario is to simulate unavailable data [22]. Using this method to simulate the EV group load, the specific modeling process is referred to in Reference [23]. See Table 1 for EV’s detailed arguments.
| Parameter name | Parameter value |
|---|---|
| ls | 0.25 Kw · h |
| Cev | 38 Kw · h |
| 0.9 | |
| 0.9 | |
| 10 Kw | |
| 10 Kw |
When EVs participate in DR, they are not only constrained by the objective response capability but also affected by the subjective willingness of users. In this paper, we consider the EV type as a private car, which has a long residence time to participate in the system scheduling after finishing a day trip. Some studies only guide EV charging and discharging through PDR, and while PDR has a limited role in guiding EV charge and discharge activities, it is necessary to optimize EV charging and discharging behaviors by combining with IDR [24].
2.2. SCTM
At this stage, China, mainly through the government regulatory authorities, has emission reduction obligations to market players to allocate free initial carbon quota and market players under their practical carbon emissions to attend the carbon trade market for carbon quota-free trade [26]. Adoption of the baseline methodology for determining systematic carbon allowances and the carbon emissions mainly come from purchased electricity, the CHP equipment, and GB.
3. MEVPP Two-Tier Planning Model
3.1. Upper-Tier Capacity Allocation Model
3.1.1. Objective Function
3.2. Lower-Tier Optimization Operational Model
3.2.1. Objective Function
3.2.2. Restrictive Condition
3.2.2.1. Energy Balance Constraints
3.2.2.2. Heat Balance Constraints
3.2.2.3. Cold Energy Balance Constraints
3.2.2.4. Gas Balance Constraints
3.2.2.5. Unit Climbing Constraints
3.2.2.6. Energy Storage Constraints
3.2.2.7. EV Demand Response Constraints
4. Model Solution
For the optimal planning model proposed, the upper model is addressed by employing the gazelle optimization algorithm; the lower model is addressed by invoking the CPLEX solver through MATLAB.
4.1. Gazelle Optimization Algorithm (GOA)
For the study of MEVPP capacity allocation, a large amount of references has used traditional algorithms such as PSO and genetics for optimization and solution. The GOA proposed in 2023 is used to solve the established two-tier allocation model. The GOA is a novel, simple, and search-capable global stochastic optimization algorithm [28]. GOA is explored and developed with the core idea of gazelle’s behavior of escaping from predators as follows.
4.1.1. Initialization
4.1.2. Development Phase
4.1.3. Discovery Phase
4.2. Solution Process
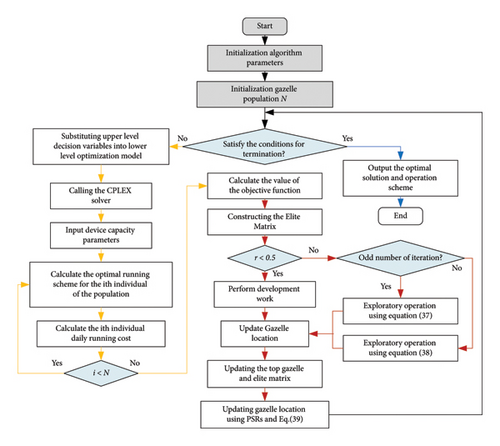
For the two-layer model, an optimization algorithm with the GOA and CPLEX solver in the upper and lower tiers is used to solve the model. The solution procedure of the optimization model is given in Figure 2.
- (1)
Enter the WT, PV, and load forecasts for each typical day, electricity and gas prices, and utility parameters for energy coupling equipment;
- (2)
Initialize the GOA parameters, set the digit of algorithm populations, the largest number of iterations, and the upper and lower bounds of the search space for decision variables;
- (3)
Population initialization, random initialization of gazelle populations;
- (4)
Determine whether the termination condition is met; if so, output the optimal solution and running scheme; if not, continue with (Step 5);
- (5)
Substituting the upper-level decision variables into the lower-tier constrains the tier optimization model;
- (6)
Invoke the CPLEX solver to address the lower model and get the optimal operating scheme and daily operating cost;
- (7)
Calculate the objective function value and construct the elite matrix for the next search step;
- (8)
Determine whether r is less than 5; if less, then carry out the exploitation operation; if not less, then determine whether the number of iterations is odd; if odd, then use Formula (37) to explore the operation; and if even, then use Formula (38) to investigate the operation;
- (9)
Update the gazelle position, top gazelle, and elite matrix. Then, renew the gazelle position again using the PSRs and Equation (40) to prevent it from falling into a locally optimal solution;
- (10)
Skip to Step 4.
5. Calculus Analysis
A residential park in northern China is used as an algorithm for simulation analysis. A year is divided into summer, winter, and transition season, and a typical day in summer is selected for analysis. In this paper, the wind and light output scenes are clustered by the Latin hypercube method, and the scene is reduced by the probabilistic distance fast reduction method.
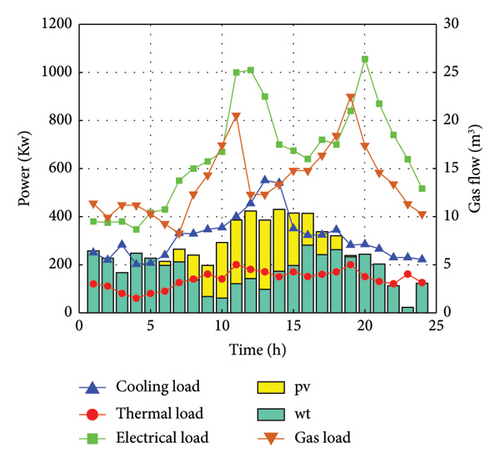
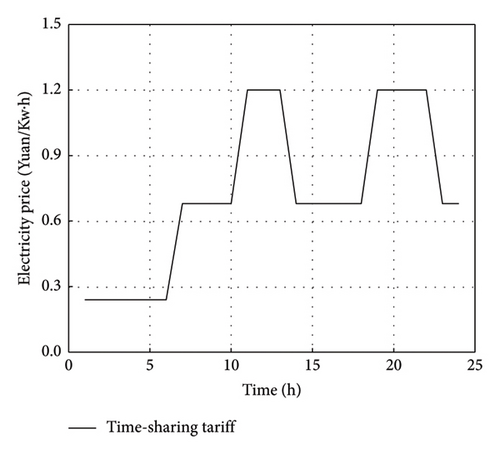
The load curves of cold, heat, electricity, and gas on this typical day are shown in Figure 3. The price of gas is constant at 3.5 yuan/m3, and the time of use price curve is shown in Figure 4. For details about device parameters in the system, see Table 2. Assume that the EV holding capacity of the park is 30.
| Energy equipment | Longevity (year) | Unit investment cost (yuan · Kw−1) | Unit operation and maintenance costs (yuan · Kw−1) | Efficiency (%) |
|---|---|---|---|---|
| WT | 25 | 6000 | 0.01 | 20 |
| PV | 25 | 12,700 | 0.01 | 30 |
| CHP | 15 | 4600 | 0.015 | Electronic: 55, hot: 45 |
| GB | 20 | 310 | 0.01 | 80 |
| EB | 15 | 2100 | 0.01 | 88 |
| EC | 15 | 900 | 0.02 | 80 |
| AC | 15 | 1050 | 0.01 | 90 |
| EES | 20 | 1440 | 0.01 | 90 |
| HES | 20 | 90 | 0.013 | 95 |
| CES | 20 | 136 | 0.01 | 95 |
5.1. Typical Daily Operating Curve Analysis
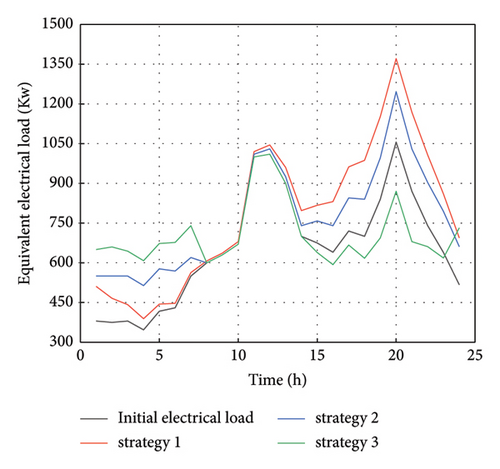
To prove the effectiveness of the proposed strategies, different DR strategies were developed to guide EV charging and discharging behavior. The policies are as follows: Strategy 1: no DR; Strategy 2: EV-PDR; and Strategy 3: EV-JRS. As shown in Figure 5, by subsidizing the load transferred by the EV, the joint response strategy proposed can better optimize the load of EVs, thus balancing the peak-valley difference of the electrical load of the system.
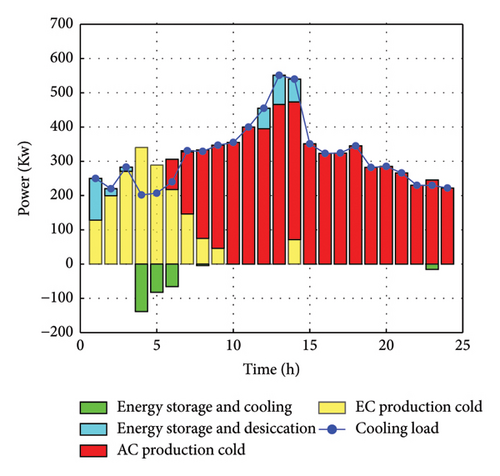
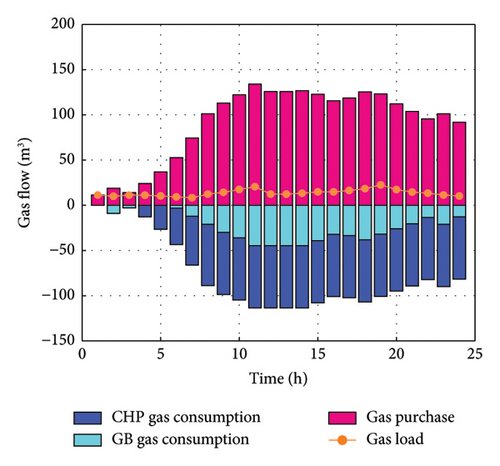
MEVPP optimizes system operation by using JRS to optimize EV’s load; the scheduling results of the system’s load are shown in Figure 6.
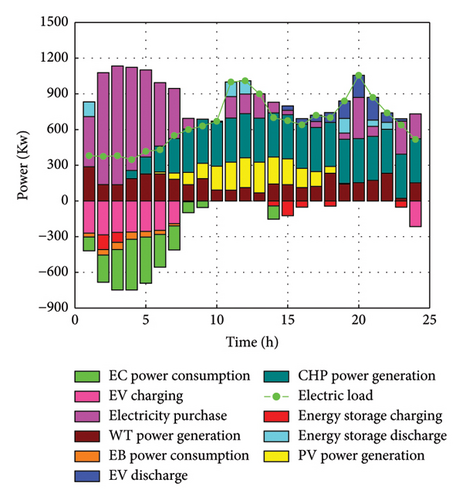

In Figure 6(a), the WT prioritizes the energy supply to the system for 1–6 h, and the shortfall of electricity is mainly satisfied by the system purchasing energy. At the same time, the system schedules EVs to charge at this time, and the EES stores the surplus power. The 11–13 and 18–22 time periods are the peak periods of power consumption, and the system schedules PV, WT, CHP, and EES to coordinate the power to supply the energy. In the 18–22 time periods, some private car EVs have finished their trips, and the system schedules the EV discharging to participate in its own optimized operation.
As shown in Figure 6(b), the heat demand in periods 1–4 is low and is mainly supplied by EB and HES. In the rest of the day, influenced by the CHP unit cogeneration, thermal energy is jointly supplied by the CHP unit and GB, while the system is equipped with a specific capacity of HES to flexibly charge and discharge the heat so that enhance the economy of the system operation.
From Figure 6(c), in the 1–6 time periods, the tariff valley hours, the EC mainly supplies the cold energy, the spare cold energy is stored by the CES. In the 12–14 h, the demand for cold energy is higher, and the CES releases the previously stored cold energy and cooperates with the cold output of the AC for a joint supply of cold energy. In the rest of the time, the cold energy demand is mainly met by the AC output.
From Figure 6(d), in 1–3 time periods, the purchased gas of the system is primarily used to satisfy the gas load demand of the customer side and the gas consumption of the GB. In the remaining period, CHP unit and GB operations consume a certain amount of natural gas, so the number of purchased gas units increases. Because the high power demand and low heat demand, the output of the CHP unit has thermoelectric coupling, so the CHP became the main gas-consuming equipment of the system in this period.
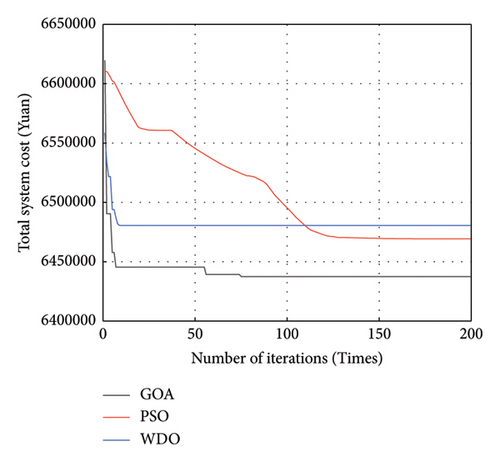
To confirm the superiority of the GOA, the PSO and wind-driven optimization (WDO) are, respectively, used to solve the model. Set the population and iterations number of the algorithms to 50 and 200. As shown in Figure 7, the WDO is easy to fall into local optimal values, and its convergence time is short. While the PSO does not easily fall into local optimal values, its convergence performance is poor. The convergence time of GOA is between the two, but its convergence ability and convergence accuracy are better than the two.
5.2. Analysis of Optimized Configuration Results
We set up different cases for comparative analysis as follows: Case 1: EV-no DR, traditional carbon trading; Case 2: EV-PDR, traditional carbon trading; Case 3: EV-JRS, traditional carbon trading; and Case 4: EV-JRS, cascade carbon trading (the case in this paper). The obtained system configuration results with annualized cost and carbon emissions are given in Tables 3 and 4.
| Configuration capacity (Kw · h) | Case 1 | Case 2 | Case 3 | Case 4 |
|---|---|---|---|---|
| CHP | 721 | 681 | 644 | 668 |
| GB | 388 | 401 | 451 | 437 |
| EB | 100 | 83 | 42 | 69 |
| EC | 543 | 543 | 548 | 557 |
| AC | 441 | 457 | 450 | 532 |
| BT | 245 | 234 | 222 | 247 |
| HSE | 300 | 232 | 238 | 253 |
| ISE | 300 | 292 | 284 | 277 |
| Parameter name | Case 1 | Case 2 | Case 3 | Case 4 |
|---|---|---|---|---|
| Investors (ten thousand yuan) | 102.4 | 100.27 | 97.74 | 100.59 |
| Energy purchase (ten thousand yuan) | 479.34 | 454.78 | 395.89 | 385.29 |
| Operation and maintenance (ten thousand yuan) | 14.11 | 13.95 | 13.73 | 13.93 |
| Demand response (ten thousand yuan) | 0 | 5.84 | 21.17 | 21.17 |
| Carbon trading (ten thousand yuan) | 102.17 | 100.06 | 94.75 | 132.93 |
| Operation (ten thousand yuan) | 595.62 | 574.63 | 525.54 | 553.32 |
| Carbon emissions (t) | 3929.78 | 3848.49 | 3644.24 | 3392.67 |
In Table 3, the different response strategies for EVs have different impacts on the configuration results of the system. Case 3 shows a decrease in the configured capacity of CHP and EB units compared with Cases 1 and 2. The configured capacity of the GB increases due to its lower unit configuration cost. Case 4 introduces a stepped carbon trading mechanism based on Case 3. GB produces carbon emissions during operation, while EB is relatively cleaner. The configured capacity of CHP and EB under Case 4 is increased, given the CHP units’ coupled heat and power output.
As shown in Table 4, different EV response strategies have different impacts on system annualized expenses and carbon emissions. Case 3 decreases the investment expenses of the system by 4.6% and 2.5%, and the operation cost by 11.8% and 8.5%, respectively, compared with Cases 1 and 2. This shows that JRS is effective in guiding EV charging and discharging behavior, which has a positive influence on the planning and running of the system. Meanwhile, carbon emissions in Case 3 are decreased by 7.3% and 5.2% compared with Cases 1 and 2, which also illustrates the effectiveness of the system in realizing carbon emission reduction by scheduling orderly charge and discharge of EVs. Compared with Case 3, the Case 4 further reduces the carbon emissions.
5.3. Sensitivity Analysis
5.3.1. Affect of Different Charging and Discharging Incentive Subsidies
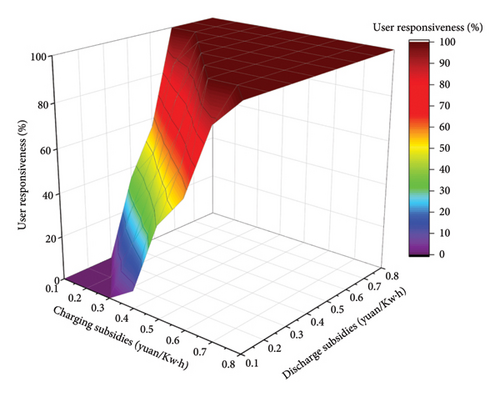
In Section 5.2, the system configuration results and operating costs under different EV response strategies are obtained. In this section, the EV-JRS model established in Section 2.1 will be used to analyze user responsiveness under different incentive levels. Figure 8 shows a boundary graph of user responsiveness at different incentive levels. With the improvement of the incentive level, the user’s willingness to respond is increasing. When the incentive level is increased to a certain value, the user’s response reaches a saturated state.
The user responsiveness and system expense under different incentive levels as shown in Table 5 (discharge subsidy constant 0.27 yuan/KWh) and Table 6 (charging subsidy constant 0.25 yuan/KWh), respectively. The charge and discharge response capabilities under different charge and discharge subsidy prices are shown in Figure 9. The charge–discharge response capacity under different charging subsidy prices is shown in Figure 9(a). The response power is shown in Figure 9(a)(A) and 9(a)(B). The charge–discharge response capacity under different discharge subsidy prices is shown in Figure 9(b). The response power is shown in Figure 9(b)(A) and Figure 9(b)(B).
| Charging subsidies (yuan/KW · h) | 0.25 | 0.30 | 0.35 | 0.40 | 0.45 |
|---|---|---|---|---|---|
| User responsiveness (%) | 33 | 42 | 53 | 70 | 96 |
| Investor (ten thousand yuan) | 107.34 | 105.25 | 103.32 | 102.73 | 101.24 |
| Demand response (ten thousand yuan) | 11.14 | 15.54 | 20.67 | 27.14 | 37.89 |
| Operation (ten thousand yuan) | 546.41 | 543.46 | 538.38 | 543.36 | 549.29 |
| Discharge subsidies (yuan/KW · h) | 0.27 | 0.32 | 0.37 | 0.42 | 0.47 |
|---|---|---|---|---|---|
| User responsiveness (%) | 33 | 41 | 48 | 59 | 74 |
| Investor (ten thousand yuan) | 107.34 | 105.92 | 104.53 | 103.01 | 102.52 |
| Demand response (ten thousand yuan) | 11.14 | 14.97 | 17.84 | 22.02 | 26.79 |
| Operation (ten thousand yuan) | 546.35 | 543.99 | 540.17 | 542.31 | 544.01 |
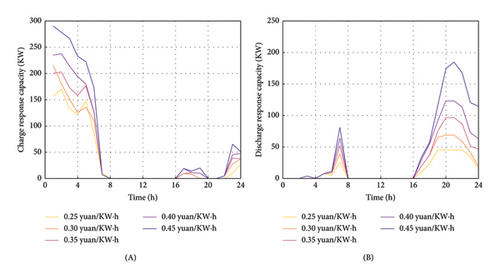
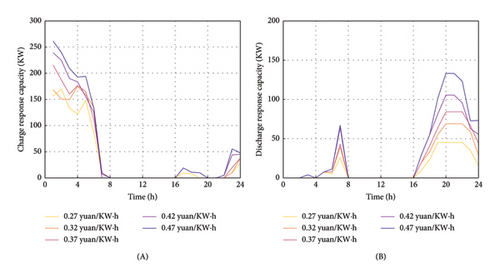
Table 5 shows that as the charging subsidy price increases, users’ willingness to respond continues to increase. The system can decrease the investment expense by scheduling the load of EVs. On the contrary, the running expense of the system is first reduced and then increased. This is because when the charging subsidy is set to 0.35 yuan/Kwh, the charge and discharge response of the EV access system reaches saturation. When the charging subsidy price continues to increase, the subsidy cost of MEVPP operators to charge and discharge EVs continues to augment, and the operating expenses begin to increase.
Table 6 shows the system costs at different discharge subsidy prices. With the increase of the discharge subsidy price, the charge and discharge response ability of EVs increases, and the changing trend of system investment and operating cost is the same as when the charging subsidy price changes. As shown in Figure 9(a)(B) and 9(b)(B), unlike the charging subsidy incentive, the guiding effect of the discharge subsidy incentive on EV discharge is somewhat weakened during load peaks because EV users are affected by the cost of battery loss. When the discharge subsidy is set to 0.37 yuan/Kwh, the charge–discharge response capacity of the EV access system reaches saturation, and the system has a good economic benefit.
5.3.2. Influence of Different Carbon Trading Base Prices
Based on Case 4, this paper simulates the planning results and system operation under different carbon prices.
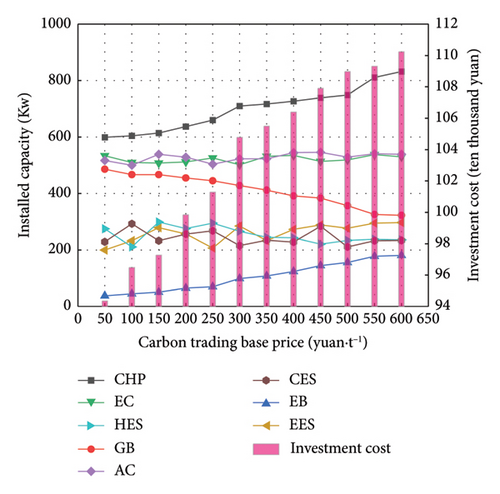
In Figure 10, with the increase of trading price, the installed capacity of CHP units and EB appears an overall rising trend, while the installed capacity of GB appears a declining trend. As the continuous improvement of the carbon trading floor price, the system decreases the purchase of coal power with higher carbon emissions per unit by increasing the configuration capacity of CHP units fueled by natural gas and achieves low carbon emissions. Meanwhile, due to the influence of thermal and electrical cogeneration of CHP units, the GB configuration capacity of the system is reduced during operation, and there is a certain carbon emission, while the relatively environmentally friendly EB increases the configuration capacity to make up for the insufficient heat output that may be caused by the reduction of GB. As the augment of carbon trading price, the continuous increase of cogeneration units and EB equipment with higher unit configuration cost is the main reason for the continuous increase of system investment cost.
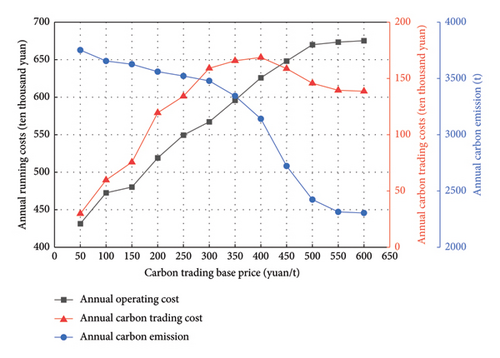
As shown in Figure 11, as the augment of carbon price, the system presents a trend of increasing annual operating expense and decreasing carbon emissions, and carbon cost first increases and then decreases. When the trading price is 400 yuan/t, the carbon emission fee reaches its peak. Since then, as the price continues to augment, carbon emissions continue to reduce under the influence of the economic operation so that the carbon trading cost begins to decline, while the annual operating cost of the system has a steady growth trend.
5.3.3. Impact of EV Holdings on System Operation
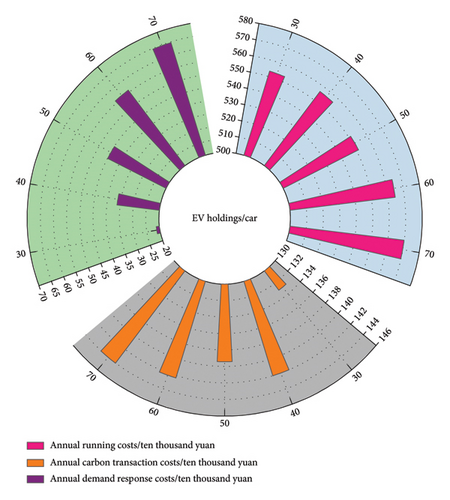
To analyze the effect of EV access numbers on the economic running, assuming that the numbers of EVs in the park is 30, 40, 50, 60, and 70, respectively, and the system is connected for simulation and comparison. As shown in Figure 12, the annual demand response cost augments as the number of EV system connections. When the access volume of EVs is 50, the annual running expenses is the lowest, and the carbon trading expenses is also low at this time, indicating that the access volume of EVs and the system achieve better supply–demand interaction and coordination, and the EV access volume reaches saturation. After that, as the number of EV access increased, the annual running expenses of the system began to increase, and the annual carbon trading costs also began to rise.
6. Conclusion
- (1)
For EV load, the joint response strategy developed in this paper can well optimize EV charging and discharging behavior, and the proposed strategy can enhance the economy and low carbon to a certain extent. Meanwhile, considering EV users’ willingness to respond, the formulation of reasonable incentive subsidy prices is conducive to improving the rationality of MEVPP planning and running.
- (2)
Compared with traditional carbon trading, SCTM has a better low-carbon emission effect. It is worth noting that different carbon trading prices affect the planning and operating costs of the system. MEVPP operators should set reasonable carbon trading prices to balance the low-carbon and economic running.
- (3)
A better-performance GOA is selected to handle the model. Compared with the PSO and WDO, the GOA has better convergence ability and convergence accuracy and enhances the accuracy of model solving.
At present, this paper assumes that the number of EV access systems is small and does not consider the influence of the uncertainty of user response. Future studies will consider the influence of large-scale EV access and the uncertainty of EV user response on the system. Further in-depth research on the low-carbon performance can be carried out, and the subsequent research can conduct in-depth studies and discussion on the carbon emissions of the whole life cycle of WT, PV, and EV.
Conflicts of Interest
The authors declare no conflicts of interest.
Funding
This research was funded by the National Natural Science Foundation of China, grant number 52167014; the Key Research and Development Program of Gansu Province, grant number 23YFGA0084; the Major Science and Technology Special Project of Gansu Province in China, grant number 23ZDGA007; the Industrial Support Plan Project of Gansu Province in China, grant number 2024CYZC-18; and the Joint Research Fund Project of Gansu Province in China, grant number 24JRRA827.
Acknowledgments
This research was funded by the National Natural Science Foundation of China, grant number 52167014; the Key Research and Development Program of Gansu Province, grant number 23YFGA0084; the Major Science and Technology Special Project of Gansu Province in China, grant number 23ZDGA007; the Industrial support plan project of Gansu Province in China, grant number 2024CYZC-18; and the Joint Research Fund Project of Gansu Province in China, grant number 24JRRA827.
Open Research
Data Availability Statement
The data used to support the findings of this study are included within the article.


