Economic and Environmental Benefits of Grid-Connected PV-Biomass Systems in a Bangladeshi University: A HOMER Pro Approach
Abstract
This study addresses Bangladesh’s urgent power crisis by evaluating a grid-connected PV-Biomass hybrid system at the Pabna University of Science and Technology (PUST). Using the hybrid optimization of multiple energy resources (HOMER) software, the project showcases a cost-effective and environmentally friendly solution. The system achieves a cost of energy (COE) of $0.0347/kWh and a net present cost (NPC) of $4,712,218, with annual operating costs of $95,679.09. It significantly reduces carbon dioxide emissions from 1,920,065 kg/yr to 839,600 kg/yr and offers a competitive payback period of 6.52 years. These results highlight the system’s economic viability and environmental advantages, proposing a scalable model for similar institutions in developing countries striving for sustainable energy solutions. This approach not only mitigates the current energy challenges but also aligns with global sustainability goals.
1. Introduction
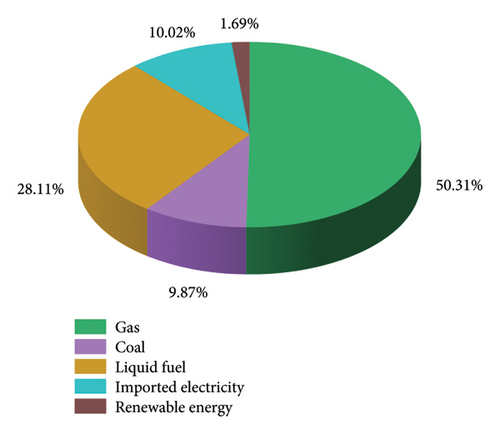
In the face of escalating global energy demands and the pressing need to combat climate change, the quest for sustainable and renewable energy solutions has never been more critical. Bangladesh, a developing country with a burgeoning population, is at a crossroads, grappling with a significant power crisis that threatens its socioeconomic development and environmental sustainability [1–3]. The reliance on nonrenewable energy sources not only exacerbates the country’s energy insecurity but also contributes to environmental degradation through substantial carbon dioxide (CO2) emissions [4]. In this context, the integration of renewable energy systems, such as photovoltaic (PV) and biomass, into the national grid emerges as a promising solution to address both the energy crisis and environmental concerns. According to data from the Ministry of Finance, as illustrated in Figure 1, 50.32% of Bangladesh’s grid-based power output in 2022 came from gas, 9.87% from coal, 28.11% from liquid fuels, 10.02% from imported electricity, and 1.69% from renewable sources [5]. Figure 1 shows the electricity generation system relying on Bangladesh’s power grid.
The sustainable replacement for fossil fuels, renewable energy, provides a greener and more ecologically friendly source of electricity [6, 7]. By 2022, only 3% of Bangladesh’s 10% target for electricity output from renewable sources had been met, despite the country’s renewable energy strategy [8, 9]. Table 1 shows the present scenario of installed renewable energy in Bangladesh.
| Technology | Off-grid (MW) | On-grid (MW) | Total (MW) |
|---|---|---|---|
| Solar | 366.79 | 601.69 | 968.48 |
| Wind | 2 | 0.9 | 2.9 |
| Hydro | 0 | 230 | 230 |
| Biogas to electricity | 0.69 | 0 | 0.69 |
| Biomass to electricity | 0.4 | 0 | 0.4 |
| Total | 369.88 | 832.59 | 1202.47 |
With 39.5% of Bangladesh’s 3% renewable energy consumption coming from solar energy, this is the leading renewable energy industry in the nation [5]. Bangladesh now has around 537 MW of installed solar PV capacity in 2022 compared with 480 MW in 2021, according to the International Renewable Energy Agency [10]. However, the country only uses 0.11% of its solar energy to meet its fundamental energy demands [11, 12]. Figure 2 shows the total solar PV installed capacity in Bangladesh from 2019 to 2022.

This research article delves into the feasibility, economic viability, and environmental benefits of implementing a grid-connected PV-biomass net metering system at Pabna University of Science and Technology (PUST) in Pabna, Bangladesh. PUST campus is committed to promoting research in science and technology, boasting 5 faculties, 21 departments, 172 teaching staff, and 5000 students achieving recognition through high-quality education [13]. The study leverages the hybrid optimization of multiple energy resources (HOMER) Pro software, a sophisticated tool for simulating and optimizing mixed-energy systems, to conduct a comprehensive technoeconomic analysis of the proposed renewable energy system [14].
The study utilizes HOMER software to assess the economic viability of a grid-connected hybrid (PV) power system for Bhilai Steel Plant, showcasing improved solar system reliability through storage devices [15]. However, challenges include the reliance on backup generators or storage batteries for solar system reliability and the necessity for a large storage battery bank to address load demands during adverse weather conditions. The study in [16] proposes a grid-connected hybrid renewable energy system (HRES) optimized for optimal renewable penetration using HOMER Pro software, presenting it as a viable solution for energy-shortfall countries like Pakistan. While temporary solutions are expensive and emit harmful gases, renewable energy-based systems are seen as promising despite their variable nature. The study in [17] does a technoeconomic analysis of a grid-connected renewable energy system with wind turbines and solar PV providing 20% and 62% of the electricity, respectively, using HOMER software. The optimization procedure reduces the cost of energy from 0.060/kWh to 0.0446/kWh. Using logistic type numerical models built in HOMER software, the article in [18] undertakes technical and economic analysis of a grid-connected HRES in Tunis, Tunisia, with a focus on audiovisual applications. The research results in a $5.21 million net present cost (NPC) and a $0.0669/kWh levelized cost of energy (LCOE). The best design for an airport’s grid-connected HRES, consisting of 1.15 MW of solar PV and 50 kW of fuel cells, is determined by the study using HOMER Pro software was studied in [19]. According to technoeconomic analysis, the configuration successfully and economically satisfies the electrical load requirements of the airport. In order to determine which combination of PVs, biomass, a converter, and a grid connection is the most efficient in terms of cost of energy (COE) and NPC, the paper in [20] analyzes the cost-effectiveness and efficiency of a HRES using HOMER software. It focuses on the cost optimization and analysis of different grid-connected renewable resources, including a thorough analysis using HOMER. The study in [21] presented an optimal design study for a grid-connected HRES. Technoeconomic and sensitivity analysis is conducted across eight configurations using HOMER software. The results illustrate the advantages of the hybrid system over conventional configurations and show which option is both economical and ecologically good. This study explores in [22] the feasibility of an on-grid hybrid solar/wind/biomass power system in Monshaet Taher village, Egypt, optimizing its design and economics using HOMER software to leverage new feed-in tariffs. The use of solar, wind, and biomass for standalone hybrid power systems in Al-Jouf, Saudi Arabia, focusing on pastoral electrification is studied in [23], where four system configurations were analyzed using HOMER to determine the most cost-effective setup. The paper in [24] analyzes a hybrid PV-biomass microgrid to electrify a remote apple farm in Albaha, KSA, optimizing components for low total annual cost and NPC using the harmony search and firefly algorithm. The study in [25] analyzes a hybrid biomass-PV microgrid using a new HIWO/PSO algorithm for optimal sizing in Egyptian farms, focusing on agricultural waste energy generation and meeting combined irrigation and household demands. The paper in [26] conducts a detailed feasibility analysis of a HRES for Baha University, Saudi Arabia, integrating PV, wind turbines, fuel cells, and batteries, emphasizing economic and ecological benefits. A technoeconomic analysis of an off-grid PV-biomass hybrid system using various optimization algorithms to select the optimal generator capacities and battery technologies, aiming to minimize costs and maximize efficiency, was studied in [27]. This article in [28] presents a cost-effective, grid-tied hybrid green energy system optimized for a small Egyptian hamlet using wind, PV, and batteries, enhancing grid stability and addressing power outages. This paper in [29] outlines a method for optimizing HRESs for rural residential electrification, considering climate diversity and building efficiency, utilizing ArcGIS and particle swarm optimization to balance cost, reliability, and renewable energy use. The optimal sizing for a biomass and fuel cell microgrid using a multiobjective particle swarm optimization (MOPSO) to minimize the cost of energy and loss of power supply probability, enhancing system reliability and economic efficiency was explored in [30]. The research in [31] evaluates the technoeconomic feasibility of off-grid solar PV and fuel cell hybrid systems in remote and urban areas of Egypt, using the flower pollination algorithm to optimize system components for minimal cost and enhanced performance. The study in [32] evaluates a PV/battery grid-connected system in El Dabaa, Egypt, using HOMER software, comparing five battery technologies for backup during outages and analyzing costs and renewable energy efficiency. The article in [33] explores the use of the harmony search algorithm for optimizing the component sizing of a HRES, including PV, wind turbines, and batteries, demonstrating superior performance over other methods like HOMER in achieving cost-efficiency and reliability in energy supply. This study in [34] introduces a statistical and ANN-based framework for evaluating optimization strategies in a hybrid, off-grid PV-wind system with nickel–iron battery storage. It compares various metaheuristic optimization algorithms, validating the proposed model’s effectiveness with ANN metrics, notably PSO’s 99.7% R-squared. The study in [35] investigates solar battery storage systems as sustainable alternatives to fossil fuels. Comparing five battery technologies, it identifies grid-connected PV/nickel–iron systems as most efficient under frequent grid outages. The research in [36] optimizes off-grid wind, solar, biomass gasifier, and fuel cell systems using a the hybrid firefly genetic algorithm. It achieves 100% renewable energy for a university campus, demonstrating cost-effectiveness and high-quality outputs. A feasibility study of a grid-connected PV-biomass system for providing electricity to Monshaet Taher village, Egypt, analyzing environmental and economic aspects using HOMER software, showing effective emission reduction without increased investment was studied in [37].
By focusing on PUST campus as a case study, this research not only addresses the immediate energy needs of the university but also sets a precedent for the broader adoption of renewable energy systems in Bangladesh’s educational institutions and beyond. The integration of PV and biomass energy sources, supported by net metering, offers a unique opportunity to generate clean, sustainable power, reduce dependence on nonrenewable energy sources, and mitigate CO2 emissions significantly.
The findings of this study highlight the economic and environmental benefits of the proposed PV-biomass system, presenting a compelling case for its scalability and replication across Bangladesh. With a detailed analysis of the total NPC, LCOE), operating costs, and CO2 emission reductions, this research underscores the potential of renewable energy systems to contribute to sustainable development, energy security, and environmental preservation in a developing country context. As Bangladesh strides toward achieving its sustainable development goals (SDGs) [38], the insights from this study offer valuable guidance for policymakers, educators, and energy planners in prioritizing renewable energy solutions. The adoption of grid-connected PV-biomass systems can serve as a cornerstone for building a resilient, sustainable, and low-carbon energy future for Bangladesh and similar developing countries facing energy and environmental challenges.
The research introduces a novel grid-connected PV-biomass hybrid system at PUST, significantly reducing costs and emissions by integrating renewable energy with grid connectivity and converter technology. It presents a feasible, scalable model for sustainable energy solutions in educational institutions in developing countries.
2. Methodology
The design and optimization of a grid-connected solar-biogas power system for the PUST campus is the main emphasis of the research technique used in this work. The main instrument for system modeling and analysis is HOMER Pro software [39]. The process used to evaluate the viability and sustainability of the suggested renewable energy solution for the PUST campus includes data collecting, system setup, sensitivity analysis, and cost-benefit analysis.
2.1. Architecture of HOMER Pro Software
HOMER Pro software has a modular architecture with modules for result analysis, simulation, data input, and optimization. Microgrid and distributed energy systems are optimized through the integration of renewable energy sources and system components. Figure 3 shows the architecture of HOMER Pro software.
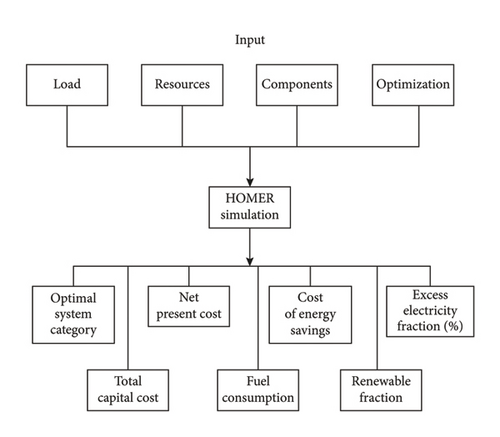
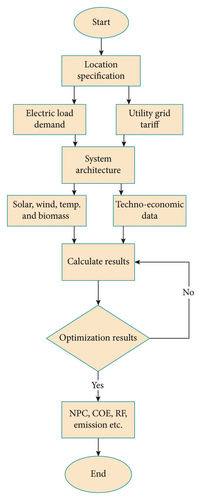
Entering data on resources, components, and limitations is the first step in HOMER Pro’s optimization process. It analyses performance and cost by simulating setups. The software produces a comprehensive report detailing the ideal renewable energy system design from input to final suggestion, identifying optimal options based on efficiency, dependability, and cost-effectiveness. Figure 4 shows the methodology flowchart of the proposed work [17].
2.2. Economic Factors
2.3. Components
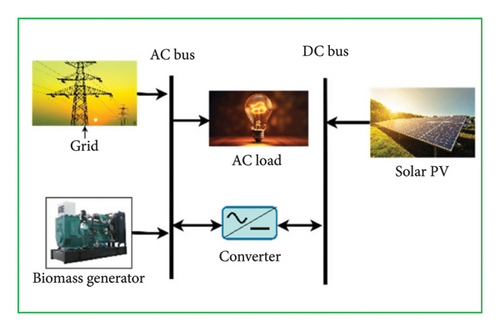
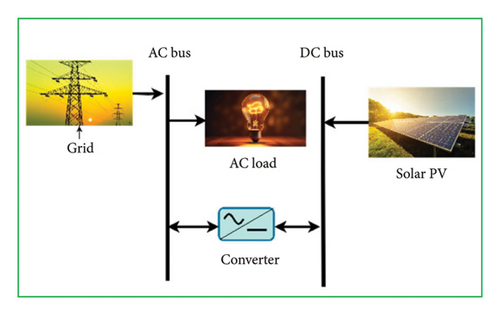
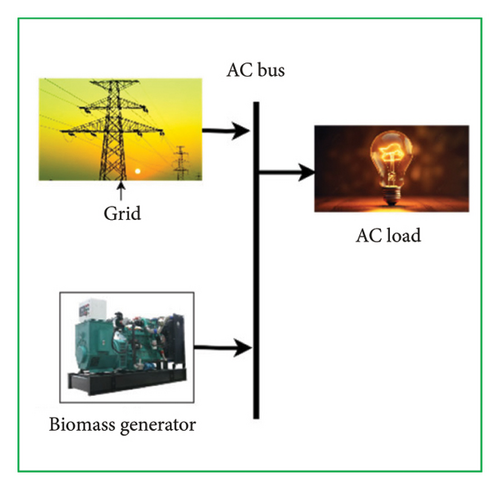
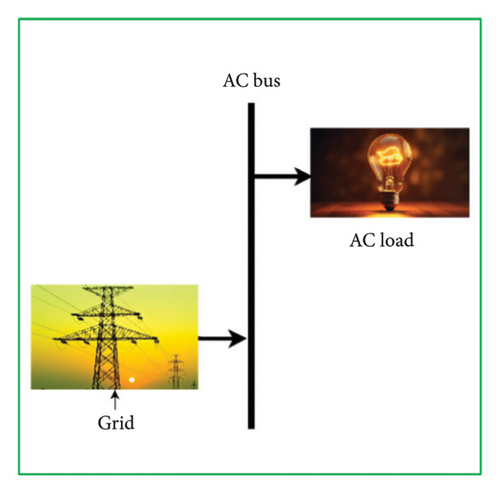
Figure 5 illustrates various models in schematic form: (a) Case I, (b) Case II, (c) Case III, and (d) the Base Case, which integrates essential components such as solar PV panels, a biomass generator (BioGen), a system converter, the grid, and the load.
2.3.1. PV Panels
2.3.2. BioGen
2.3.3. Converter
In HOMER software, a converter’s function is to manage and convert energy between different forms. It efficiently transforms DC electricity from sources like PV panels or batteries into AC electricity for grid compatibility or vice versa. This ensures optimal integration and utilization of various renewable and conventional energy sources in a microgrid. In this study, a system converter is considered with a capital and replacement cost of $280.00 USD per KW. The converter and inverter both maintain 95% efficiency and have a lifespan of 15 years.
3. Case Study on the PUST Campus
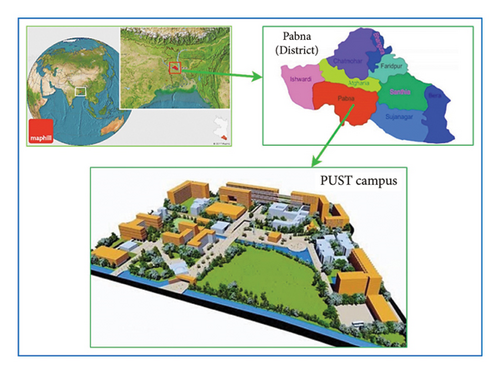
Established in 2008, PUST in Pabna, Bangladesh, is renowned for its focus on science and technology education and research. Covering 30 acres, the campus is a testament to the seamless integration of educational facilities and natural beauty, featuring academic and administrative buildings, as well as accommodations for students and faculty. This contributes significantly to its role in fostering knowledge and innovation. Located in Rajapur, about 5 km northeast of central Pabna, PUST is positioned at latitude 24.013050 and longitude 89.279446, marking it as a pivotal educational landmark in the region. Figure 6 shows the location of the PUST campus.
3.1. Solar Radiation
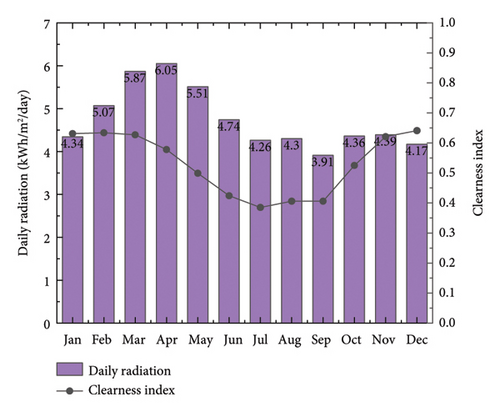
Climate information, including temperature and solar radiation, is available from several trustworthy sources. NASA’s surface meteorology and solar energy database provided monthly averaged global horizontal irradiance (GHI) measurements for this investigation. The database was based on records covering the preceding 22 years [45]. Figure 7 shows the solar irradiance and clearness index for Pabna, Bangladesh.
3.2. Temperature
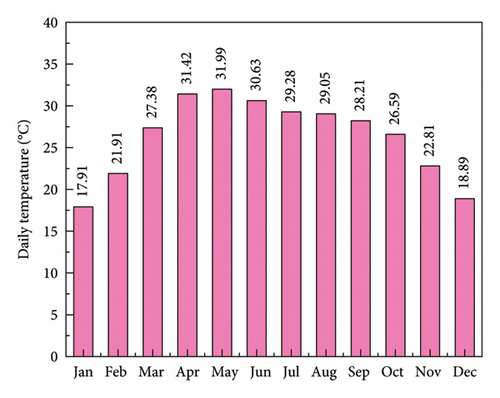
The daily average temperature for Pabna, Bangladesh, is shown in Figure 8, which gives a graphic depiction of the year-round variations in temperature in relation to solar energy [45].
3.3. Biomass Resources
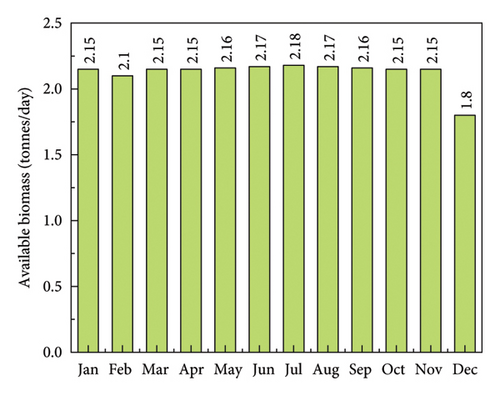
Table 2 displays data regarding the accommodation, population, and biomass information for the PUST campus. The campus generates a significant amount of biomass wastes as a result of the fast urbanization. It has a negative impact on public health and the environment. In Bangladesh, garbage produced by the rural population is just 0.15 kg per person per day, whereas waste produced by the urban population is between 0.4 and 0.5 kg per person per day [47]. For this study, 0.5 kg per capita waste has been considered.
| Sl no. | Types of accommodation | Capacity of population | Average kitchen waste/day/person (kg) | Total waste/day (kg) | Total waste/day (ton) |
|---|---|---|---|---|---|
| 1. | Student hall (male)-1 | 500 | 0.50 | 250 | 0.25 |
| 2. | Student hall (male)-2 | 1000 | 0.50 | 500 | 0.5 |
| 3. | Student hall (female)-3 | 500 | 0.50 | 250 | 0.25 |
| 4. | Student hall (female)-4 | 1000 | 0.50 | 500 | 0.5 |
| 5. | Teachers and staff dormitory | 300 | 0.50 | 150 | 0.15 |
| 6. | Teachers and staff dormitory and canteen | 1000 | 0.50 | 500 | 0.50 |
| Total | 2150 kg | 2.15 ton | |||
The PUST campus’s daily accessible biomass resources are displayed in Figure 9. December’s biomass availability is restricted because the PUST campus is closed for winter vacation during the final week of the month.
3.4. Load Profile
This study analyzed the load profile for PUST equipment, including lamps, TV, fan, fridge, computer, AC, and sockets. Table 3 shows the equipment wise total load distribution of the PUST campus.
| Sl no. | Equipment | Load (kW) | Quantity | Total load (kW) |
|---|---|---|---|---|
| 1. | Lamps | 0.03 | 11,988 | 359.64 |
| 2. | TV | 0.125 | 288 | 36 |
| 3. | Fan | 0.08 | 6660 | 532.8 |
| 4. | Fridge | 0.15 | 348 | 52.2 |
| 5. | Computer | 0.18 | 1996 | 359.28 |
| 6. | AC | 3.5 | 804 | 2814 |
| 7. | Socket | 0.75 | 2350 | 1762.5 |
| Total | 5916.42 kW or 5.91642 MW | |||
Figure 10 depicts the percentage load distribution of different equipment at PUST.
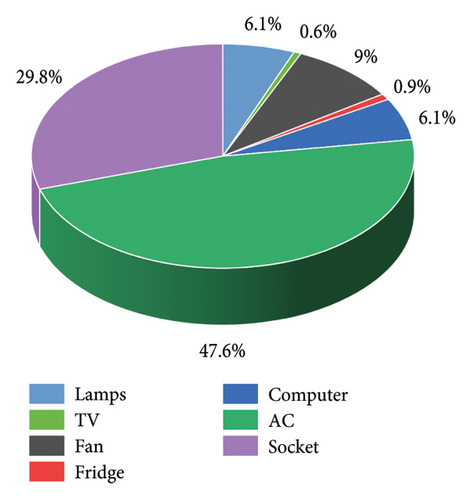
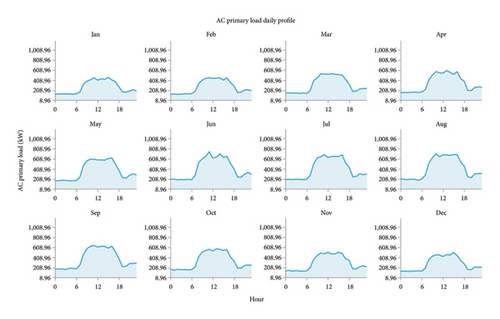
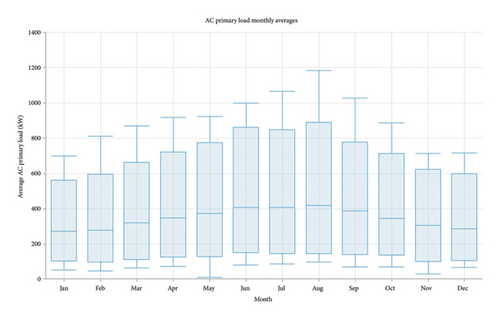
Figure 11 represents the AC primary daily load profile for PUST campus while Figure 12 shows AC primary monthly load profile for PUST campus. It reveals an average daily electricity consumption of 8500 kWh and a peak demand of 1210.71 kW, providing insight into the campus’s power usage patterns.
3.5. Purchasing and Sellback Tariff
In this research investigation, the grid power purchase tariff is specified at 0.09 USD/kWh, and the net metering sellback price is set at 0.06 USD/kWh as per regulations in Bangladesh [48]. This tariff arrangement serves to incentivize the uptake of renewable energy sources while concurrently leading to a notable decrease in COE. The combination of lower operating costs and a desirable feed-in rate results in a short payback period, making this integrated system a desirable choice for the PUST campus. This decision successfully satisfies environmental and economic objectives.
4. Result and Discussion
HOMER Pro was used to evaluate the intended microgrid’s operational and financial aspects. With its simplified, nonderivative optimizer, HOMER Pro can execute a large number of simulations quickly. HOMER Pro eliminates any impractical options—such as those involving inverters, power supplies, or other issues—and ranks workable solutions based on total NPC [49]. Throughout a 25-year planning horizon, an hourly time-series simulation is examined for every potential system microgrid configuration. Table 4 presents a summary of various configurations analyzed. The Base Case involves grid dependency. Case I incorporates PV with converter, BioGen systems, and grid. Case II integrates PV with converter and grid. Case III combines BioGen with the grid.
| Components | Configuration |
|---|---|
| Grid | Base case |
| PV-BioGen-grid-converter | Case I |
| PV-grid-converter | Case II |
| BioGen-grid | Case III |
4.1. Technical Specification of PV and Biomass
Table 5 outlines the technical specifications for a 1500 kW CanadianSolar PV system, including costs, maintenance, lifetime, derating, and ground reflectance. Table 6 details a 60 kW BioGen’s costs, maintenance, and operational lifetime.
| Parameters | Units | Value |
|---|---|---|
| Capacity | kW | 1500 |
| Capital cost | $ | 545 |
| Replacement cost | $ | 545 |
| O&M cost | $/kW | 10 |
| Lifetime | Years | 25 |
| Derating factor | % | 88 |
| Ground reflectance | % | 20 |
| Parameters | Units | Value |
|---|---|---|
| Capacity | kW | 60 |
| Capital cost | $ | 60,000 |
| Replacement cost | $ | 50,000 |
| O&M cost | $/hr | 1 |
| Lifetime | hours | 15,000 |
4.2. Technoeconomic Assessment of the Microgrid
Table 7 illustrates various configurations in a case study, comparing capital costs, NPCs, COE, operating costs, renewable fraction, and payback periods. The Base Case requires no capital investment but incurs significant operating costs. Case I and Case II show reduced capital costs and COE with moderate payback periods, while Case III presents minimal capital expenditure, significantly reduced COE, and a shorter payback period.
| Configuration | Capital cost ($) | Net present cost ($) | COE ($/kWh) | Operating cost ($) | Renewable fraction (%) | Payback period (yr) |
|---|---|---|---|---|---|---|
| Base Case | 0.00 | 10,025,570.00 | 0.090 | 273,427.00 | 0.00 | — |
| Case I | 1,204,013.75 | 4,712,218.00 | 0.03467 | 95,679.09 | 64.2 | 6.52 |
| Case II | 1,139,202.50 | 4,810,876.00 | 0.03539 | 100,137.40 | 58.80 | 6.30 |
| Case III | 70,000.00 | 9,876,423.00 | 0.08866 | 267,450.10 | 6.60 | 4.77 |
This table compares different configurations for a project based on financial and performance metrics. Case I shows the best outcomes across the board, with the lowest NPC ($4,712,218), COE at $0.03467/kWh, and operating cost ($95,679.09), alongside a high renewable fraction of 64.2% and a reasonable payback period of 6.52 years. Despite the higher initial capital cost compared with Case III, Case I significantly outperforms the Base Case and other alternatives in cost-efficiency and sustainability, making it the optimal choice considering lower financial burdens and higher renewable integration. Figure 13 shows the comparison of various factors of different cases: (a) capital cost and NPC and (b) COE and operating cost.
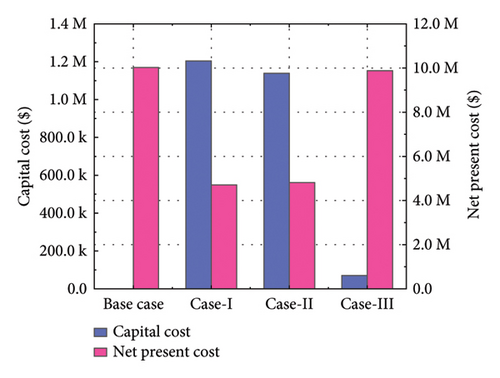
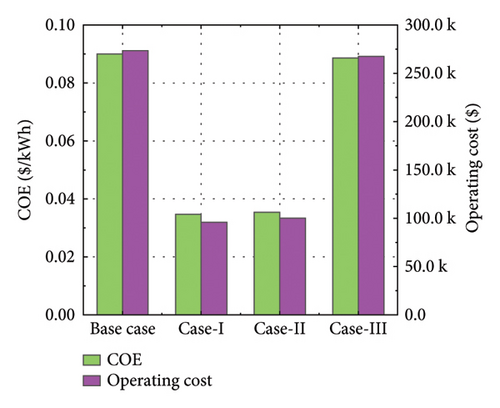
Table 8 shows the energy transactions for various configurations, and Figure 14 shows the graphical representation of energy purchase and sold for different cases.
| Configuration | Energy purchased (kWh/year) | Energy sold (kWh/year) |
|---|---|---|
| Base Case | 3,038,078 | 0 |
| Case I | 1,328,403 | 668,787 |
| Case II | 1,526,113 | 669,686 |
| Case III | 2,837,741 | 42.9 |
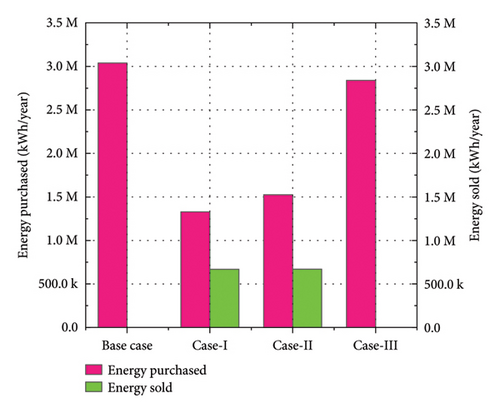
Here, the Base Case involves purchasing 3,038,078 kWh/year without selling any energy. Case I significantly reduces energy purchases to 1,328,403 kWh/year and sells 668,787 kWh/year, showcasing the most efficient energy management among the scenarios. Case II and Case III also show reductions in purchases and engage in energy sales, with Case II selling slightly more than Case I, despite higher energy purchases, while Case III has minimal energy sales.
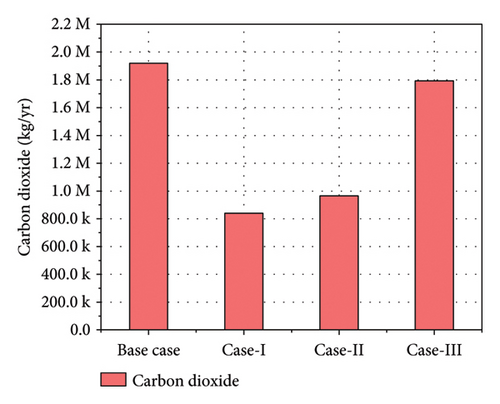
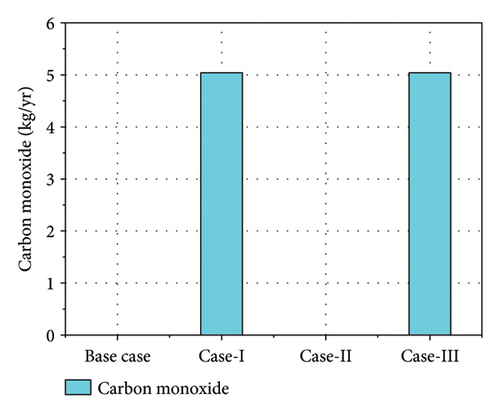
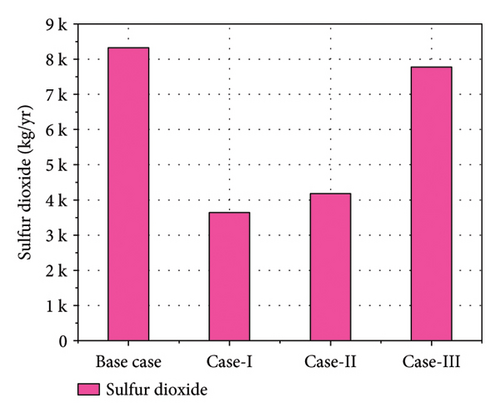
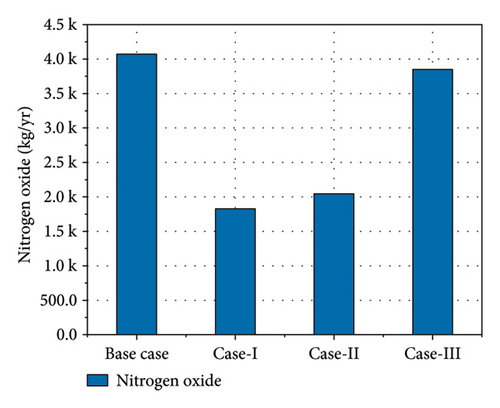
Table 9 presents the annual greenhouse gas (GHG) emissions across different cases. Case I significantly reduces emissions, cutting CO2 to 839,600 kg/yr and achieving the lowest levels of sulfur dioxide and nitrogen oxides among the cases. Although Case I introduces a minor amount of carbon monoxide (5.04 kg/yr), it showcases the most substantial overall reduction in GHG emissions, indicating its effectiveness in environmental impact mitigation compared to the Base Case and other scenarios.
| Quantity | Base Case | Case I | Case II | Case III |
|---|---|---|---|---|
| Carbon dioxide (kg/yr) | 1,920,065 | 839,600 | 964,504 | 1,793,501 |
| Carbon monoxide (kg/yr) | 0 | 5.04 | 0 | 5.04 |
| Sulfur dioxide (kg/yr) | 8324 | 3640 | 4182 | 7775 |
| Nitrogen oxides (kg/yr) | 4071 | 1825 | 2045 | 3848 |
Figure 15 illustrates the variations in GHG emissions across different scenarios, highlighting (a) CO2 emissions in kilograms per year, showcasing significant reductions especially in Case I; (b) the introduction of carbon monoxide emissions in Case I and Case III, which is absent in other scenarios; (c) the decrease in sulfur dioxide emissions across all cases with Case I achieving the most significant reduction; and (d) a similar trend in nitrogen oxides emissions, with all alternative cases reducing emissions compared with the Base Case, and Case I leading in minimization efforts.
4.3. Integrating Supercapacitor as an Energy Storage Device to Case I
A supercapacitor is an energy storage device that rapidly stores and releases large amounts of electrical energy with high power density and long cycle life. Table 10 presents a comparative analysis of various configurations for energy systems. Case I, without a supercapacitor, has a capital cost of $1,204,013.75, an NPC of $4,712,218.00, and a COE of $0.03467 per kWh. In contrast, the configuration with a supercapacitor shows higher figures with a capital cost of $1,974,665.31, an NPC of $5,234,000.00, and a COE of $0.03831 per kWh. Despite the higher renewable fraction of 79.1% in the supercapacitor case, Case I is the best in terms of COE and NPC, indicating lower overall costs.
| Configuration | Capital cost ($) | Net present cost ($) | COE ($/kWh) | Operating cost ($) | Renewable fraction (%) | Payback period (yr) |
|---|---|---|---|---|---|---|
| Case I | 1,204,013.75 | 4,712,218.00 | 0.03467 | 95,679.09 | 64.2 | 6.52 |
| Case I with supercapacitors | 1,974,665.31 | 5,234,000.00 | 0.03831 | 88,891.69 | 79.1 | 10.6 |
4.4. Optimal System
Considering the comprehensive analysis, Case I emerges as the optimal choice due to its superior balance between economic efficiency and environmental sustainability. It achieves the lowest NPC, the most competitive COE, and significantly reduces operating costs while offering the highest renewable fraction. This configuration effectively minimizes GHG emissions, notably CO2, and demonstrates efficient energy management by reducing purchases and maximizing sales. The combination of PV, BioGen systems, and grid integration, along with a converter, positions Case I as the most advantageous in both technoeconomic assessment and environmental impact mitigation.
4.4.1. Proposed System Architecture
Table 11 outlines the proposed system architecture for an energy project, featuring a 70 kW BioGen and 1500 kW of CanadianSolar MaxPower CS6X-325P PV panels, paired with a 1130 kW system converter. The architecture utilizes a HOMER Load Following dispatch strategy, integrating with the grid for optimal energy management and efficiency. In a research article, a 1500-kW solar system was selected for the PUST campus due to spatial constraints, with the total rooftop area available being approximately 15,000 square meters. Considering that a standard solar panel system typically necessitates between 9 and 23 square meters per kilowatt of capacity [50], our decision was based on an allocation of 10 square meters per kW, optimizing the space to achieve the maximum PV capacity of 1500 kW.
| Component | Name | Size (KW) |
|---|---|---|
| Generator | Biomass generator (BioGen) | 70.0 |
| PV | CanadianSolar MaxPower CS6X-325P (PV) | 1500 |
| System converter | System converter | 1130 |
| Grid | Grid | — |
| Dispatch strategy | HOMER load following | — |
4.4.2. Cost Summary
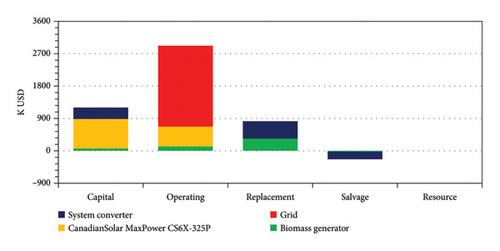
Figure 16 and Tables 12 and 13 provide a detailed cost summary of the proposed energy system, highlighting the NPC and annualized costs. The system encompasses a $70,000 BioGen, $817,500 in PV panels, a system converter costing $316,514, and grid integration at no initial cost. The total NPC reaches $4.71 M, factoring in capital, operating, replacement costs, and salvage values, demonstrating a comprehensive financial overview of the system’s investment and operational expenses.
| Name | Capital | Operating | Replacement | Salvage | Resource | Total |
|---|---|---|---|---|---|---|
| BioGen | $70,000 | $123,498 | $339,708 | −$22,073 | $0.00 | $511,133 |
| PV | $817,500 | $549,995 | $0.00 | $0.00 | $0.00 | $1.37 M |
| Grid | $0.00 | $2.25 M | $0.00 | $0.00 | $0.00 | $2.25 M |
| System converter | $316,514 | $0.00 | $481,063 | −$211,976 | $0.00 | $585,601 |
| System | $1.20 M | $2.92 M | $820,771 | −$234,049 | $0.00 | $4.71 M |
| Name | Capital | Operating | Replacement | Salvage | Resource | Total |
|---|---|---|---|---|---|---|
| BioGen | $1909 | $3368 | $9265 | −$601.99 | $0.00 | $13,940 |
| PV | $22,296 | $15,000 | $0.00 | $0.00 | $0.00 | $37,296 |
| Grid | $0.00 | $61,309 | $0.00 | $0.00 | $0.00 | $61,309 |
| System Converter | $8632 | $0.00 | $13,120 | −$5781 | $0.00 | $15,971 |
| System | $32,837 | $79,677 | $22,385 | −$6383 | $0.00 | $128,516 |
4.4.3. Cash Flow
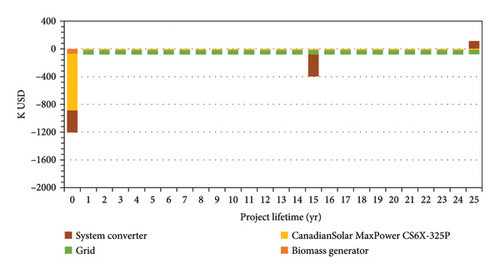
Figure 17 illustrates the financial dynamics of capital investments, operating expenses, replacement costs, and salvage values, while Figure 18 breaks down the cash flow associated with PV, BioGens, the grid, and system converters.

4.4.4. Electrical Summary
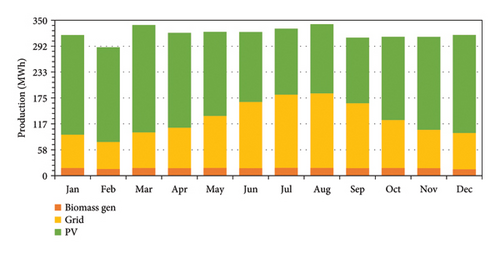
Table 14 reveals the production dynamics of the proposed system, where PV panels contribute the most, generating 2,310,232 kWh/year (60.2%), followed by grid purchases at 1,328,403 kWh/year (34.6%), and BioGen production at 200,471 kWh/year (5.22%). In contrast, Table 15’s consumption summary shows that AC primary load accounts for the majority of usage at 3,038,078 kWh/year (82%), with grid sales returning 668,787 kWh/year (18%), indicating a strategic balance between generation and consumption. Figure 19 shows the component wise monthly electric production. This microgrid requires 10,154 kWh/day and has a peak of 1186 kW. In the proposed system, the following generation sources serve the electrical load.
| Component | Production (kWh/yr) | Percentage (%) |
|---|---|---|
| PV | 2,310,232 | 60.2 |
| BioGen | 200,471 | 5.22 |
| Grid purchases | 1,328,403 | 34.6 |
| Total | 3,839,107 | 100 |
| Component | Consumption (kWh/yr) | Percentage (%) |
|---|---|---|
| AC primary load | 3,038,078 | 82.0 |
| Grid sales | 668,787 | 18.0 |
| Total | 3,706,864 | 100 |
4.4.5. Generator: BioGen
Table 16 provides details on the electrical output of a 70-kW BioGen.
| Quantity | Value | Units |
|---|---|---|
| Electrical production | 200,471 | kWh/yr |
| Mean electrical output | 69.4 | kW |
| Minimum electrical output | 56.2 | kW |
| Maximum electrical output | 70.0 | kW |
Table 17 summarizes the fuel usage of the same generator, covering annual fuel consumption. Table 18 presents operational statistics of the generator. Figure 20 visually represents the output in kW of the 70-kW BioGen.
| Quantity | Value | Units |
|---|---|---|
| Fuel consumption | 775 | tons/yr |
| Specific fuel consumption | 2.71 | kg/kWh |
| Fuel energy input | 828,922 | kWh/yr |
| Mean electrical efficiency | 24.2 | % |
| Quantity | Value | Units |
|---|---|---|
| Hours of operation | 2887 | hrs/yr |
| Number of starts | 2121 | Starts/yr |
| Operational life | 5.20 | yr |
| Capacity factor | 32.7 | % |
| Fixed generation cost | 5.06 | $/hr |
| Marginal generation cost | 0 | $/kWh |

4.4.6. PV: CanadianSolar MaxPower CS6X-325P
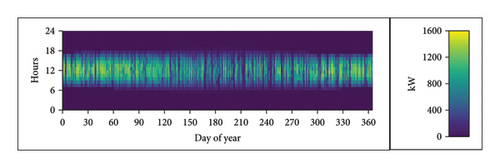
Tables 19 and 20 show the PV electrical summary and statistics, respectively. The CanadianSolar PV system, with a nominal capacity of 1500 kW, achieves an annual production of 2,310,232 kWh. It boasts a specific yield of 1540 kWh/kW and a low LCOE at $0.0161 per kWh. The system has a capital cost of $817,500 and annual maintenance expenses of $15,000, achieving a PV penetration rate of 76%. Figure 21 shows the PV electrical output.
| Quantity | Value | Units |
|---|---|---|
| Minimum output | 0 | kW |
| Maximum output | 1452 | kW |
| PV penetration | 76.0 | % |
| Hours of operation | 4373 | hrs/yr |
| Levelized cost | 0.0161 | $/kWh |
| Quantity | Value | Units |
|---|---|---|
| Rated capacity | 1500 | kW |
| Mean output | 264 | kW |
| Mean output | 6329 | kWh/d |
| Capacity factor | 17.6 | % |
| Total production | 2,310,232 | kWh/yr |
4.4.7. Converter: System Converter
Tables 21 and 22 shows the system converter electrical summary and statistics, respectively. Figure 22 shows the system converter electrical output.
| Quantity | Value | Units |
|---|---|---|
| Hours of operation | 4373 | hrs/yr |
| Energy out | 2,177,990 | kWh/yr |
| Energy in | 2,292,621 | kWh/yr |
| Losses | 114,631 | kWh/yr |
| Quantity | Value | Units |
|---|---|---|
| Capacity | 1130 | kW |
| Mean output | 249 | kW |
| Minimum output | 0 | kW |
| Maximum output | 1130 | kW |
| Capacity factor | 22.0 | % |

4.4.8. Grid
Table 23 provides monthly data on grid energy transactions and associated charges, including energy purchased and sold (in kWh), net energy transactions, peak demand (in kW), and energy charges for each month and the annual total. Figure 23 depicts the trend of energy purchased from the grid over time in kW. Figure 24 illustrates the trend of energy sold to the grid over time in kW.
| Month | Energy purchased (kWh) | Energy sold (kWh) | Net energy purchased (kWh) | Peak demand (kW) | Energy charge |
|---|---|---|---|---|---|
| January | 74,942 | 98,410 | −23,468 | 484 | −$1408 |
| February | 60,696 | 87,969 | −27,272 | 444 | −$1636 |
| March | 80,044 | 86,216 | −6172 | 542 | −$370.31 |
| April | 91,231 | 60,155 | 31,076 | 601 | $2797 |
| May | 117,095 | 36,555 | 80,540 | 689 | $7249 |
| June | 149,131 | 20,294 | 128,838 | 914 | $11,595 |
| July | 164,928 | 18,535 | 146,393 | 943 | $13,175 |
| August | 167,974 | 20,552 | 147,423 | 1077 | $13,268 |
| September | 146,371 | 24,931 | 121,440 | 766 | $10,930 |
| October | 107,885 | 47,495 | 60,391 | 610 | $5435 |
| November | 86,402 | 78,093 | 8310 | 579 | $747.89 |
| December | 81,702 | 89,584 | −7881 | 494 | −$472.88 |
| Annual | 1,328,403 | 668,787 | 659,617 | 1077 | $61,309 |


4.4.9. Economics and Environmental Metrics Comparison
Table 24 demonstrates the comparison of financial and environmental metrics between base system and proposed system. The proposed system demonstrates significant improvements over the base system in both financial and environmental metrics. With a lower net present cost of $4.71 M, $1.20 M capital expenditure (CAPEX), $95,679 operating expenditure (OPEX), and reduced emissions of 839,600 kg/yr CO2, it offers a compelling advantage.
| Metric | Base system | Proposed system |
|---|---|---|
| Net present cost | $10.0 M | $4.71 M |
| CAPEX | $0.00 | $1.20 M |
| OPEX | $273,427 | $95,679 |
| LCOE (per kWh) | $0.0900 | $0.0347 |
| CO2 emitted (kg/yr) | 1,920,065 | 839,600 |
4.5. Sensitivity Analysis
In HOMER Pro, sensitivity analysis assessed how variations in input parameters influence the performance of energy models, determining the resilience of system configurations across various scenarios. Table 25 presents key input variables, including solar radiation, temperature, biomass price, and biomass availability, each tested at multiple values to reflect potential changes. This analysis identifies which variables most significantly affect microgrid costs and performance, supporting optimal system design through data-driven decision-making. The findings allow for adjustments to the microgrid design, accommodating possible fluctuations in environmental conditions and economic factors.
| Input sensitive variable | Values |
|---|---|
| Solar radiation (kWh/m2/day) | 2, 3, 4.75, 5, 6 |
| Temperature (°C) | 22, 24, 26.34, 28, 30 |
| Biomass average price ($/ton) | 0, 10, 20, 30, 40 |
| Available biomass: scaled annual average (ton/day) | 0.1, 1, 2.13, 3, 4 |
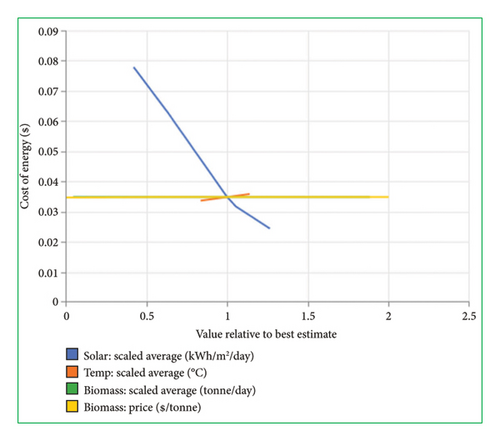
The spider plot in Figure 25 presents a sensitivity analysis from a HOMER Pro simulation, depicting how the COE varies with changes in four key variables: solar radiation, temperature, biomass availability, and biomass price. It illustrates that solar radiation significantly impacts COE, with a sharp decrease in cost as solar input increases. In contrast, variations in temperature show a minimal impact on COE, as indicated by the relatively flat line. Biomass availability and price show slight variations in their influence on COE, suggesting that these factors are less sensitive compared to solar radiation. This analysis aids in understanding which parameters are most critical in optimizing the performance and cost-effectiveness of a microgrid system.
The surface plot in Figure 26 demonstrates the sensitivity of total NPC to variations in solar radiation and temperature, as simulated in HOMER Pro. This visual suggests that increasing solar radiation significantly reduces total NPC, highlighting solar energy’s role in lowering system costs. At higher levels of solar radiation, total NPC decreases dramatically, indicating that the system configuration becomes more economically efficient as solar resources increase.
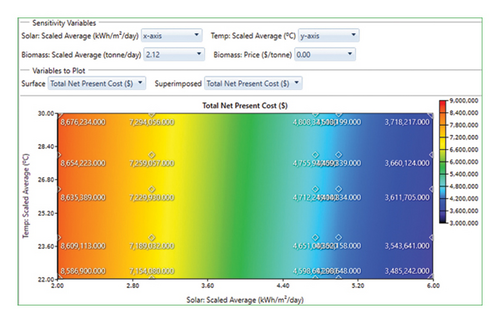
In contrast, temperature shows a limited effect on total NPC, as indicated by the horizontal bands in the figure. Although slight cost variations are visible, temperature fluctuations do not substantially influence total NPC compared with solar radiation. This analysis underscores the importance of solar availability in cost-effective system design, offering guidance for locations where solar resources are abundant to maximize economic efficiency.
To sum up, the sensitivity analysis highlights solar radiation as the most influential variable in reducing both COE and total NPC, demonstrating its critical role in achieving cost-effective microgrid designs. Temperature, biomass price, and biomass availability show comparatively minor impacts, indicating that optimizing solar input is essential for maximizing economic efficiency in energy systems.
4.6. Practical Challenges and Policy Recommendations
In implementing grid-connected PV-biomass systems, several practical challenges need to be considered. Operational requirements, including consistent maintenance and technical support, are critical for sustained performance, especially in remote or resource-constrained areas. Ensuring a reliable local workforce capable of handling these systems is essential; however, this may require specialized training and upskilling initiatives to meet technical demands. In addition, the need for consistent biomass supply poses logistical and environmental challenges, necessitating careful resource planning. To support broader implementation, policies that incentivize renewable energy integration in educational institutions and government subsidies for initial setup costs would be beneficial. Institutional support through partnerships with renewable energy companies and technical training programs could further strengthen the feasibility of such projects. Addressing these challenges and enhancing policy support will be essential for scaling the adoption of PV-biomass systems in developing countries, thus supporting long-term sustainability and energy independence.
4.7. Comparison With Other Works
Table 26 shows the comparison of the proposed work with other published works. Comparing various renewable energy systems in Bangladesh, the proposed PV-biogas-grid system at PUST in Pabna offers a competitive COE of 0.0347 USD/kWh and NPC of 4,712,218 USD, outperforming several other systems in terms of cost-effectiveness.
| References | Authors | Published year | Research location | Load specifics | System configuration | Results (COE in USD/kWh, NPC in USD) |
|---|---|---|---|---|---|---|
| [51] | Ahmed et al. | February 2023 | Rangpur metropolitan region, Bangladesh |
|
PV, generator, storage, and converter |
|
| [52] | Hasan et al. | November 2023 | Ukhiya, Cox’s Bazar, Bangladesh | 8022.3 kWh/day, 694.44 kW | PV, wind, battery, grid, and converter |
|
| [53] | Kabir et al. | May 2020 | Patenga Chittagong, Bangladesh |
|
PV, wind, diesel, battery, grid, PLC, and converter |
|
| [54] | Mahmud et al. | June 2022 | Mohammadpur, Dhaka |
|
Wind, PV, grid, battery, and converter |
|
| [55] | Islam et al. | 2024 | Kaunia Upazila Health Complex, Rangpur Bangladesh |
|
PV, grid, diesel, battery, and converter |
|
| [56] | Shamim, Silmee, and Sikder | May 2022 | Daffodil Smart City, Dhaka, Bangladesh |
|
PV, grid, and converter |
|
| [57] | Das and Kundu | June 2023 | Mountainous region in Bangladesh |
|
PV, biomass, storage, wind turbine, hydrokinetic turbine, and converter |
|
| [58] | Ahmed, Das, and Tushar | October 2023 | Baluadanga Dinajpur, Bangladesh |
|
PV, wind, grid storage, and converter |
|
| [59] | Ahmed et al. | January 2023 | Baliadangi Healthcare Center, Thakurgaon, Bangladesh |
|
PV, diesel generator, storage, grid, and converter |
|
| Proposed system | PUST, Pabna, Bangladesh |
|
PV-biomass generator-grid-converter |
|
||
The proposed grid-connected PV-biomass system at PUST offers a tangible solution to Bangladesh’s energy crisis, providing a sustainable and economically viable model for similar institutions. Its novelty lies in integrating renewable energy sources with grid connectivity and converter technology, significantly reducing both costs and carbon emissions. The main contribution lies in demonstrating the feasibility and benefits of such hybrid systems in real-world applications, paving the way for widespread adoption of green technologies.
5. Conclusion
In conclusion, the investigation into the economic and environmental benefits of a grid-connected PV-Biomass system at the PUST using the HOMER Pro approach has demonstrated significant potential for sustainable energy solutions in Bangladesh. The proposed Case I configuration, combining PV panels and a BioGen with grid connectivity and a converter, has emerged as the optimal system design. This configuration not only achieves the lowest NPC ($4,712,218) and COE ($0.0347/kWh) but also significantly lowers operating costs ($95,679.09) and offers a substantial renewable fraction (64.2%). Furthermore, it presents an attractive payback period of 6.52 years, underlining its financial viability.
Environmental benefits are equally compelling, with the system poised to drastically reduce CO2 emissions from 1,920,065 kg/yr to 839,600 kg/yr, showcasing its contribution to mitigating climate change impacts. The study’s methodology and findings underscore the viability of integrating renewable energy sources into existing power grids, offering a replicable model for universities and similar institutions in developing countries facing energy challenges. The adoption of such hybrid systems can play a crucial role in achieving energy security, economic savings, and environmental sustainability, aligning with global efforts toward cleaner energy futures. This case study not only highlights the potential of renewable energy in Bangladesh but also sets a precedent for the adoption of green technologies in educational institutions worldwide, offering insights into the planning, implementation, and benefits of sustainable energy systems. Future work could involve implementing the optimized grid-connected PV-biomass system at the PUST to empirically compare its performance and efficiency with the simulated results obtained through HOMER Pro analysis.
Nomenclature
-
- BioGen
-
- Biomass generator
-
- CAPEX
-
- Capital expenditure
-
- COE
-
- Cost of energy
-
- GHG
-
- Greenhouse gas
-
- GHI
-
- Global horizontal irradiance
-
- HOMER
-
- Hybrid optimization of multiple energy resources
-
- HRES
-
- Hybrid renewable energy system
-
- LCOE
-
- Levelized cost of energy
-
- NPC
-
- Net present cost
-
- OPEX
-
- Operating expenditure
-
- PUST
-
- Pabna University of Science and Technology
-
- PV
-
- Photovoltaic
-
- SDG
-
- Sustainable development goals
-
- UGC
-
- University grants commission
Conflicts of Interest
The authors declare no conflicts of interest. No financial or personal relationships with other people or organizations have influenced the work, results, or conclusions presented in this study.
Funding
The authors would like to thank the University Grants Commission (UGC), Bangladesh, for providing the necessary funding for the financial year 2022-2023 to support and complete the project. In addition, the authors would like to express their gratitude to Pabna University of Science and Technology, Pabna, for providing opportunities to use the renewable energy lab to support and complete this research project.
Acknowledgments
The authors would like to thank the University Grants Commission (UGC), Bangladesh, for providing the necessary funding for the financial year 2022-2023 to support and complete the project. In addition, the authors would like to express their gratitude to Pabna University of Science and Technology, Pabna, for providing opportunities to use the renewable energy lab to support and complete this research project.
Open Research
Data Availability Statement
The data used to support the findings of this study are available on request from the corresponding author.


