Investigation of Robust Controllers and Model Uncertainty on Nonideal Boost Converter Lifetime in Hybrid Electric Vehicle
Abstract
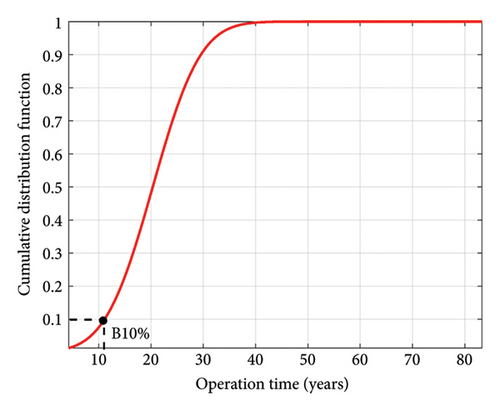
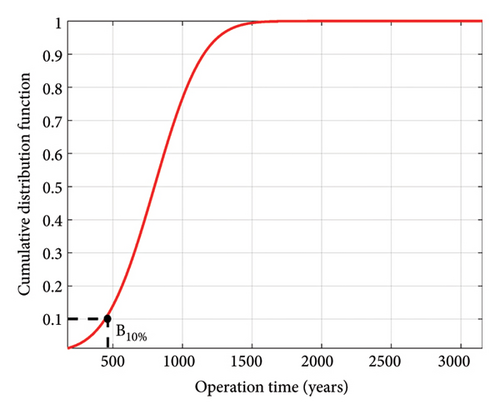
Electric vehicles (EVs) have caught significant attention in recent years due to their potential to reduce greenhouse gas emissions and dependency on fossil fuels. The reliability analysis of power electronic (PE) converters in EVs is crucial to improve their performance, cost-effectiveness, and long-term viability. In this paper, the lifetime estimation of IGBT in a hybrid EV unidirectional converter is evaluated based on control system impacts and statistical model uncertainties. For this purpose, a closed-loop model of a hybrid EV is developed in MATLAB using the Artemis mission profile to simulate the unidirectional converter output power. In the next step, the average model of the nonideal boost converter with Kharitonov’s controller is employed to calculate the IGBT losses. The robust controller is able to maintain converter model stability during long-term output power mission profile simulation. By applying the thermal impedance, the junction temperature profile of the switch is obtained, enabling lifetime analysis via rain flow (RF) and Miner’s rule methods. The results show that the controller selection considerably affects total consumed lifetime (TCL). Each controller can have a different TCL compared to other choices. Since the model coefficient for solder joint and bond wire failure mechanisms have been obtained based on the accelerated test results in the empirical method, considering the parameter statistical distribution and utilizing the Monte Carlo (MC) method can create a better view in the selection of IGBT and the converter design. Furthermore, based on the statistical results and the probability density function, it is feasible to determine how many percent of the IGBTs in the statistical community are damaged after a certain time. The B10 parameter for the failure mechanisms of bond wire and solder is 11.2 and 450 years, respectively. This approach provides insights into risk assessment and design optimization.
1. Introduction
Nowadays, the thermal model is an integral part of the planning and evolution of power electronic (PE) converters. Since the thermal performance of power semiconductor component is one of the most important factors influencing the efficiency, reliability, and dimensions of a converter, it is essential to conduct accurate estimations and evaluations of device lifetime based on temperature to optimize the cost and design of power converters [1–3]. Additionally, semiconductor devices are among the most vulnerable components in PE converters and electrical systems. According to a research report based on field experiences of PE device manufacturers, about 31% of 56 respondents considered PE semiconductor devices the most fragile components [4]. Moreover, the assessment of PE semiconductor reliability has been conducted in many studies, such as solar cells [5–10], motor drives [11–13], wind turbines [14–16], and electric vehicles (EVs) [17–19]. These studies have demonstrated that semiconductor devices are usually one of the most prone devices to damage in such systems. EVs have received significant attention as a hopeful solution for reducing greenhouse gas emissions and dependency on fossil fuels [20–22]. With the surging demand for EVs, there is a crucial need to investigate the reliability and lifetime estimation of their electrical systems, including PE converters that control EV power [23, 24]. Reliability and lifetime estimation straightforwardly influence the performance and safety of the EVs, making them vital considerations for design. Moreover, the lifetime assessment of PE converters is imperative to ensure that the electrical devices of EVs can withstand continuous operational stress and deliver stable performance over a long time. Consequently, understanding the reliability and lifetime estimation of EVs, along with evaluating the reliability issues in PEs, is notable for advancing EV development and adoption [25, 26]. This includes evaluation of the device durability, predicting failure rates and implementing effective maintenance strategies to ensure long-term reliability. One of the aspects of studies in the field of reliability is based on the prediction of its level in a system. It can be categorized into three approaches for the IGBT in PE converters. The first relies on constant failure rate models presented in Military-Handbook-217F [27]. While simple, this method lacks accuracy due to not considering some factors such as wear-out and temperature effects. Notably, Military-Handbook-217F was abolished in 1995 and the updated version, MHB-217H, was presented based on the fundamental physics method [28]. The second approach stems from the empirical lifetime models derived from the experimental test data [13, 18, 29]. This method is widely used to estimate the lifetime of IGBTs, but the main drawback is that it relies on statistical data analysis. Therefore, they do not accurately describe the damage mechanisms [30]. Several empirical methods are utilized to estimate the lifetime of IGBTs in PE converters. In accelerated power cycling tests, IGBT modules are subjected to rapid and extreme temperature cycles (heating and cooling) to accelerate aging processes [29]. Data collected during these cycles (junction temperature swings, switching frequency, and current load) are then used to develop statistical models and predict lifetime under normal conditions. In field data analysis, operational data from IGBTs in real-world applications, such as operating temperatures, switching frequencies, and load currents, are collected. Statistical analysis of data is considered to identify trends and correlations between operating conditions and failure rates [31]. However, combined data from accelerated tests with field data to create more robust and accurate lifetime predictions are used [32]. The third approach involves physics of failure (PoF) modeling which accounts for strain and stress variations induced by thermal–mechanical cycles [33]. Although PoF provides deeper insight into failure mechanisms, its application is limited by the incompetence of precise material and structural data for IGBTs [32]. One aspect of this study is reliability from the control attitude. The reliability and lifetime of the PE converter in EVs are directly related to the control system of the PE converter. The control system of PE converters is one of the fundamental assignments of the power management systems of EVs. It plays a vital role in optimizing performance, reducing the risks of malfunction and failure, and increasing their reliability and lifetime. Consequently, the research and development in dynamic control methods and performance optimization of PE converters to improve reliability and lifetime remain a substantial concern in EV technology. The effect of island control and maximum power point tracking on efficiency and reliability in photovoltaic systems has been studied [34]. Reference [35] shows that the control algorithm can reduce motor losses of up to 70%. In EVs, where power cycles vary significantly, it is inevitable to use a controller for maintaining converter stability. Kharitonov’s theorem offers a framework for designing robust controllers to handle uncertainty [36], and its application for different converters has been investigated [37–39]. When it comes to using Kharitonov’s theorem, there is a range of controllers for the converter. Consequently, choosing an optimal controller for maximum lifetime can be challenging. Moreover, variations in empirical lifetime model coefficients and statistical analysis can also affect the device lifetime. The IGBT lifetime in PE converters is relevant to two well-known failure mechanisms: solder joint and bond wire failure [40]. When the amount of failure cycles attains a specific number, the solder joint and bond wire in the device will fail. The rain flow (RF) counting analysis is commonly used to extract cycles’ characteristics from junction temperature mission profiles [41].
It is assumed that each temperature cycle causes a certain amount of damage to IGBT [14]. Therefore, Palmgren–Miner’s rule model is used to estimate lifetime [42]. The Monte Carlo (MC) method can be employed to study variations of coefficients in lifetime models. It is employed to explore the statistical characteristics of heat and humidity in the PoF lifetime estimation model [43]. Reference [44] utilized MC simulation to analyze uncertainties in IGBT on-state saturation voltage degradation for online prognostic purposes. The geometrical effects of IGBT were investigated by the MC method [45]. The investigation into circuit and environmental effects on PE devices and converters was conducted in many papers [13, 18, 37].
In this paper, the impacts of the controller design and the empirical lifetime model coefficients are investigated using Kharitonov’s theorem and the MC method, respectively. The analysis is based on the Artemis motorway mission profile standard for hybrid EVs [46]. A nonideal average converter model enables rapid mission profile simulation while accounting for all parasitic elements. Moreover, this approach facilitates designing the optimal controller from the lifetime vantage point for a specific mission profile and calculating the IGBT loss profile simultaneously. Additionally, statistical analysis of semiconductor devices community based on lifetime model parameters provides more comprehensive information about converter reliability during the design phase. A robust controller provides the possibility to consider all uncertainties arising from mission profiles and converter working conditions. On the other hand, the robust controller designed via Kharitonov’s theorem ensures converter output voltage stability despite converter variable changes. This paper is classified into the following sections.
The mission profile in hybrid EV, the converter, and power analysis are introduced in Section 2. In Section 3, the recommended models are considered for studying the effect of the controller and specifications of the lifetime estimation model. In Section 4, the lifetime estimation method and failure mechanisms in IGBT are discussed. The simulation outcomes are proposed in Section 5. In Section 6, the conclusion is submitted.
2. Analysis of the Mission Profile, Power Relationships, and Controller in the Converter
For estimating the lifetime of the converter, it is indispensable to investigate the EV, the converter in question, and its power losses.
2.1. Vehicle Model, Mission Profile, and Required Power Analysis
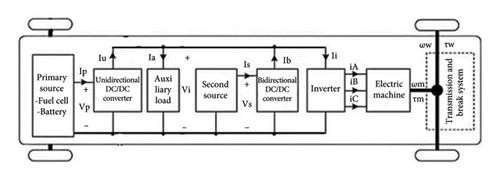
The energy supply source in an EV can include a fuel cell [47–50], a battery, or a combination of a fuel cell with other energy storage systems such as batteries, ultra-capacitors, solar panels, and superconducting magnetic energy storage, collectively known as a hybrid EV [51–53]. The general scheme of a hybrid EV with two sources is illustrated in Figure 1 [47]. Stable power is catered by the two sources. The primary source supplies steady power while the second source is used for instantaneous power fluctuation during sudden acceleration or deceleration.
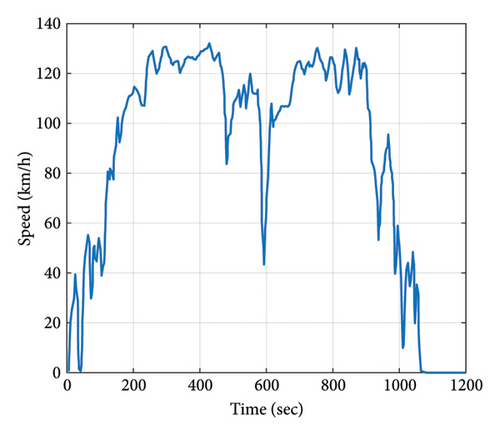
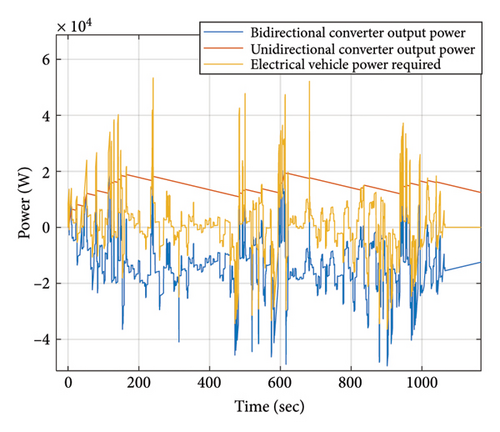
The Artemis motorway standard, depicted in Figure 2, serves as the input for the closed-loop model in Figure 3. This mission profile determines the contribution of unidirectional and bidirectional converters in supplying the vehicle energy demand. The specifications of the desired EV are presented in Table 1. It is achieved based on the weight and power requirements to follow the input speed mission profile in the closed-loop system. As can be seen from Figure 4, the vehicle maximum instantaneous power demand reaches approximately 50 kW. The unidirectional converter acts as a main power supplier. This converter cannot absorb power in deceleration modes. Therefore, its output power is always positive. A rate limiter with rising and falling rates of 600 and −30, respectively, separates the unidirectional converter from the bidirectional converter output power. The value of the falling rate is smaller than the rising rate to provide forward power flow for the unidirectional converter, while higher rates increase output power variation. Consequently, it broadens the range of uncertainty which results in the designing of a slower Kharitonov controller and a reduction in converter response. Figure 4 highlights both positive and negative power flows corresponding to acceleration and deceleration in the mission profile. The power flow in the unidirectional converter is from source to load called forward direction. This converter contributes to the base and positive power. The bidirectional one can flow the power in forward and backward directions to give/attract the power.

| Specifications | Value |
|---|---|
| Maximum DC converters output power (kW) | 50 |
| DC link output voltage (V) | 400 |
| Primary battery voltage (V) | 200 |
| Primary battery internal resistance (Ω) | 0.05 |
| Vehicle wheel radius (m) | 0.3 |
| Vehicle mass (kg) | 1000 |
| Vehicle torque (N.m) | 400 |
2.2. Parasitic Boost Converter
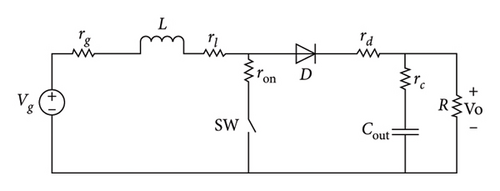
It should be mentioned that the average state-space equations are used as the converter model during output power mission profile simulation, and small signal TF is employed for controller design by Kharitonov’s theorem.
2.3. Kharitonov’s Theorem
Uncertainties in the converter arise from variations in each element, as presented in Figure 5. Since lifetime estimation is based on a mission profile that exhibits significant fluctuation in speed over time, the required power of the vehicle and the output power of the converters also vary considerably. To obtain the IGBT loss profile, it is necessary to simulate the average model of the converter based on its output power. However, classic controllers are not sufficient to maintain stable output voltage under uncertainties induced by the output power mission profile.
2.4. Power Loss Analysis
2.4.1. Switching Loss Calculation in IGBT
2.4.2. Computation of Conduction Losses in IGBT
2.5. Thermal Model and Junction Temperature Estimation
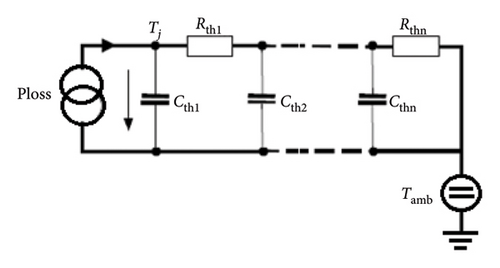
The junction temperature in the converter switch is determined based on the computed losses from the previous section. The electrothermal dynamic model is presented in Figure 6. Tj is the junction and Tamb represents the ambient temperatures. The values of capacitors and resistors are based on Cauer’s model [32].
3. Lifetime Estimation Model for Two Perspectives
3.1. The Presented Model for Evaluating Controller Changes
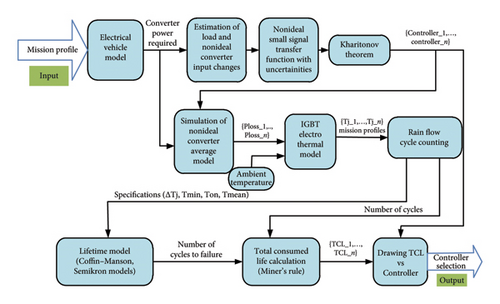
The process of analyzing the controller effect on the total consumed lifetime (TCL) is presented in Figure 7. This approach allows for choosing the optimal controller coefficients for the system. First, a mission profile is applied to the hybrid EV to determine its required power. Then, the output power of the unidirectional converter is determined using a rate limiter. Based on the unidirectional output power, variations in the load and input voltage resulting from the internal resistance of the primary source are acquired. In the following, the nonideal small signal model and parasitic elements are taken into account, and the range of coefficient variations based on Section 2 is obtained. According to the controller model, the interval closed-loop TF is created and Kharitonov’s theorem is applied to identify the acceptable area for controller selection. By selecting different points from the acceptable controller area and applying the required power to the average nonideal model of the converter, IGBT losses are obtained. Exerting the losses to the electrothermal model, the junction temperature is determined. Subsequently, the number of temperature cycles for each mission profile and their characteristics are obtained using the RF manner. For two common failure mechanisms in IGBTs, the number of cycles before device failure is attained. The calculation of TCL is performed using Miner’s rule method for different controllers. Finally, the TCL curve is obtained according to the coefficients of the controller so that the best controller is selected based on the minimum TCL.
3.2. The Model Presented to Investigate the Changes in the Coefficients of the Lifetime Estimation Model
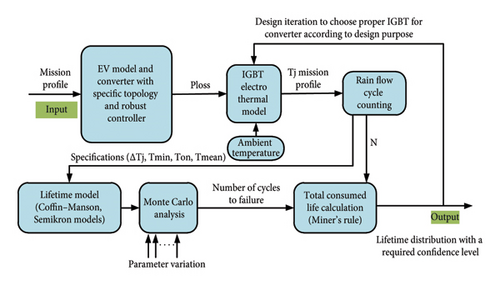
Figure 8 exhibits the MC analysis process. Similar to Figure 7, the mission profile is exerted on the EV model for acquiring unidirectional converter output power. In the next step, it is applied to the converter to determine the power loss in the IGBT. The junction temperature mission profile in IGBT is then derived by applying losses to the electrothermal model. This profile is analyzed using the RF method based on the number of cycles and their characteristics. It is crucial to note that the impact of speed variation in the EV mission profile is appeared in junction temperature cycles. Moreover, because the coefficients of the lifetime estimation models used in this paper are obtained based on a confidence level [32, 60], they follow a normal distribution with a specific standard deviation. In the following, the lifetime analysis is performed for a particular population of IGBTs using the MC method with details presented in the simulation section. The feedback from the output part to the electrothermal model of the IGBT enables the iterative design to select the best choice.
4. Estimation of Lifetime and Failure Mechanisms Based on the MC Method
Solder joint and bond wire failure mechanisms are two important factors that can lead to device failure and malfunction. Damages may occur due to changes in temperature, pressure, vibrations, or mechanical modifications [40]. The best lifetime model is one where the test conditions closely match the operational conditions. However, due to the time required, this is not practical. For this reason, accelerated testing concepts have been widely used in reliability engineering over the past decades to reduce testing time. The key challenge is choosing a suitable and justifiable model for lifetime estimation.
4.1. The Lifetime Model
4.2. The MC Analysis
Using equations (20) and (21) along with RF analysis finally results in a constant TCL for each failure mechanism. In contrast, this does not reflect reality, as it does not account for the statistical variations in the model parameters. In practice, the age of an IGBT varies due to variations in physical parameters, lifetime model coefficients, and different operating stresses. To address these uncertainties, a statistical approach based on MC simulation is considered in this paper to analyze parameter variations in the lifetime model. Parameters β1 and β2 which are associated with temperature variations and minimum temperature in equations (20) and (21) are modeled using a normal distribution. The sensitivity of TCL to each parameter is evaluated separately and cumulatively within a specific confidence interval. Further details are provided in Section 5.
4.3. Miner’s Rule Model
5. Simulation Results
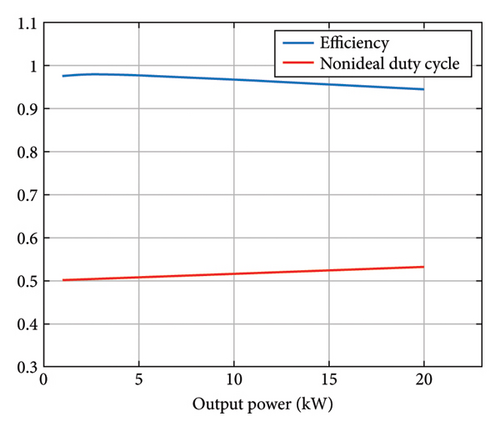
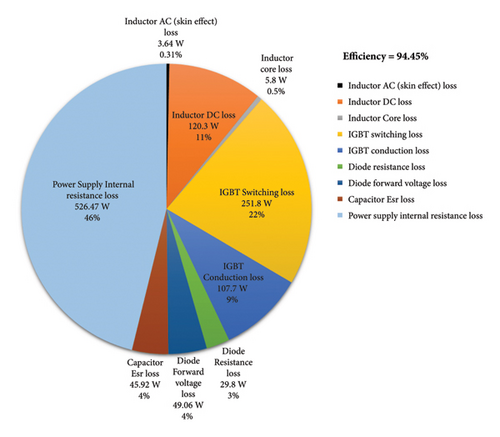
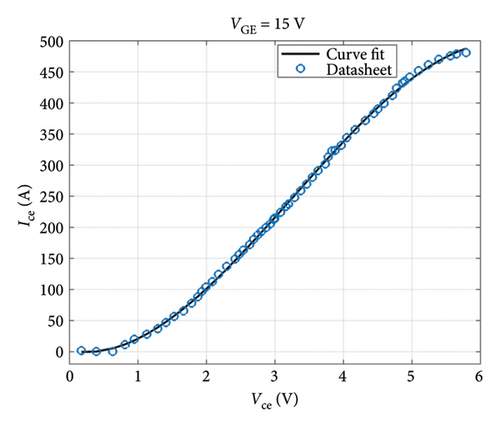
In order to design a unidirectional converter in a hybrid EV, it is first necessary to determine the mission profile and model of the EV. Therefore, the required power of the EV can be obtained as depicted in Figure 4. The nominal characteristics of the desired converter are designed and presented in Table 2, considering the output and input voltages as well as the output power of the unidirectional converter. Figure 9(a) illustrates the converter’s efficiency and duty cycle for different output power levels. As output power increases, converter efficiency decreases. Furthermore, the duty cycle escalates which plays a considerable role in enhancing power losses and reducing efficiency. Given that the converter power changes from 10.91 kW to 19.5 kW, converter efficiency varies from 96.6% to 94.45%. A pie chart in Figure 9(b) shows the distribution of different losses at 19.5 kW output power. The necessary information for IGBT and diode is extracted from the datasheet. The tolerable voltage and current, minimum thermal impedance, and losses are the criteria for selecting an IGBT to achieve a lower TCL. The diode is also chosen based on the tolerable voltage and current for the converter. To limit the size of the inductor, the peak-to-peak ripple inductor current ΔILp−p is set to 20% of the average inductor current. Moreover, to minimize voltage fluctuations in the output voltage, the peak-to-peak ripple voltage ΔVout is limited to 1% of the average output voltage. As evident from the analysis, the switch losses form an integral part of the converter total losses. The unidirectional converter efficiency at maximum output power is obtained as 94.45%.
| Specification | Value | |
|---|---|---|
| Input voltage (V) | Vin | 200 |
| Output voltage (V) | Vout | 400 |
| Nominal duty cycle | D | 0.5 |
| Maximum output power (kW) | Pout | 19.5 |
| Switching frequency (kHz) | Fsw | 20 |
| Source inner resistance (Ω) | rg | 0.05 |
| Inductor (µH) | L | 258 |
| Ripple inductor current (A) | ΔIL | 19.9 |
| No. of turns | N | 92 |
| DC resistance (Ω) | Rdc | 0.0114 |
| AC resistance (Ω) | Rac | 0.112 |
| Capacitor (µF) | C | 700 |
| Core type | High flux 58,337 | |
| ESR (Ω) | rc | 0.0182 |
| Switch | IGBT | AUIRGPS4067D1 |
| Diode | D | IDW100E60 |
5.1. Effect of Controller Changes on Lifetime
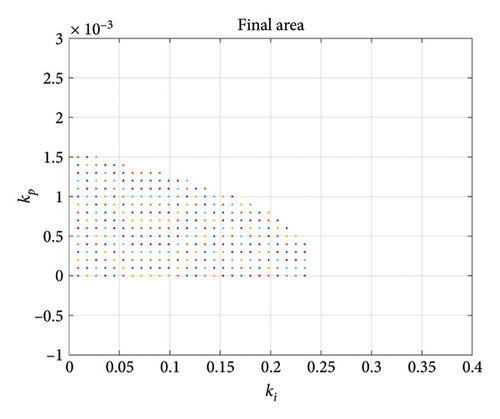
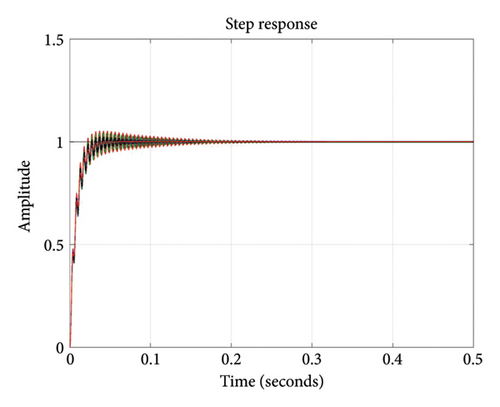
As presented in Figure 4, the power fluctuations at the output of the unidirectional converter range from 10.91 kW to 19.5 kW. Considering the inner resistance of the primary source, input voltage variations in the unidirectional converter range from 194.8 to 200 V. Considering the mentioned parameters variations, Table 3 illustrates the interval quantity of the coefficients of the converter TF for quantized changes and equation (23) expresses the TF interval. Using equations (8)–(11) and Ruth–Hurwitz stability criterion, the acceptable area for selecting a controller that ensures the stability of the converter output voltage due to variations in output power and input voltage is shown in Figure 10. For instance, selecting kI = 0.2 and kp = 0.0004, the step responses for 16 Kharitonov systems are obtained as shown in Figure 11, demonstrating that the system remains stable under all changes.
| Vi (v) | Po (KW) | D | Transfer function |
|---|---|---|---|
| 194.8 | 19.5 | 0.5174 | |
| 194.8 | 10.91 | 0.5152 | |
| 200 | 19.5 | 0.5048 | |
| 200 | 10.91 | 0.5026 |
| Parameter | Value | ||
|---|---|---|---|
| Rthi (°C/W) | 0.0564 | 0.0888 | 0.0547 |
| Cthi (°C/W) | 0.0044858 | 0.0355292 | 0.2722669 |
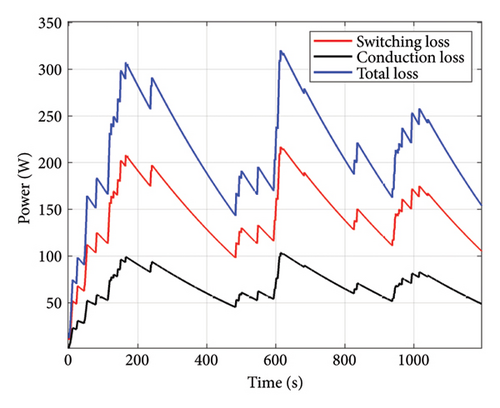
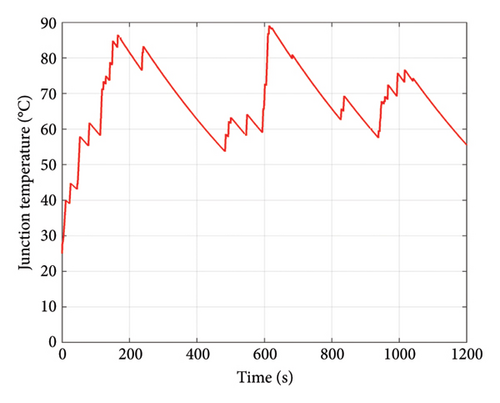
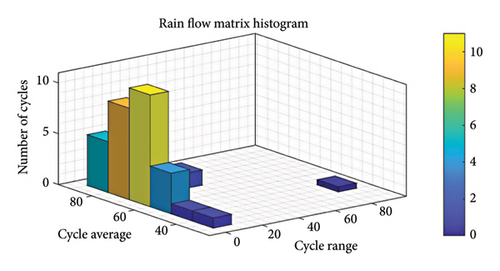
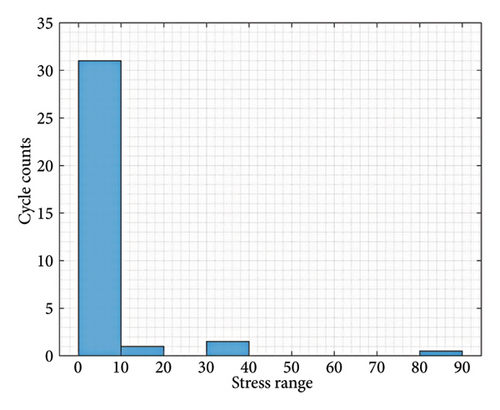
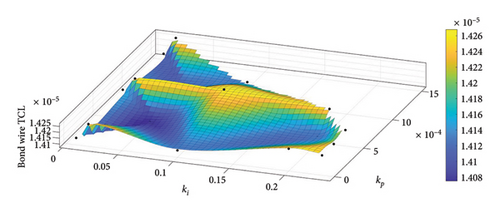
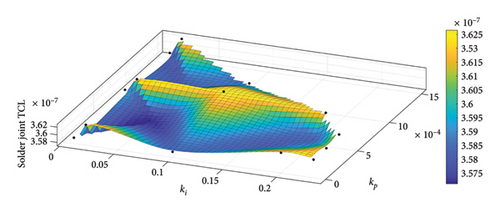
Figure 13 presents the conduction, switching, and total IGBT losses during the mission profile for kI = 0.005 and kp = 0.001. As observed, switching losses constitute a significant portion of the total losses. By applying the thermal model from the IGBT datasheet in Table 4, the junction temperature of the IGBT is achieved as shown in Figure 14. Moreover, the analysis of temperature cycles using the RF method is illustrated in Figure 15. This process is repeated for multiple controller selections from the acceptable area. Finally, Figure 16 presents TCL for two common failure mechanisms in the IGBT based on controller values. As it is known, there is no unique TCL applicable to all controllers. For some parameter selections, a lower TCL is achieved, indicating a better choice of controller from the reliability perspective in the converter.
5.2. Changing the Converter Parameters and the MC Approach
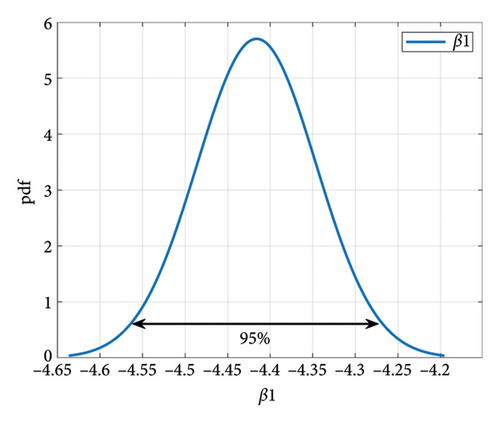
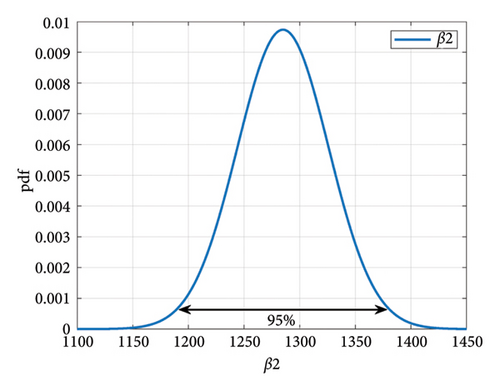
In this part, the reliability investigation of the IGBT is conducted by considering the long-term performance and changes in the model parameters. Each lifetime model should be regarded as particular test conditions and limitations, such as device technology and failure mechanism. Moreover, there is variability in manufacturing quality, so the coefficients might vary among IGBTs. The statistical distributions of coefficients in the Coffin–Manson and Semikron lifetime models for IGBTs are determined through a combination of experimental data analysis and statistical inference. The applied lifetime models in this study are derived from the testing data. The variations of the constants in equations (20) and (21), as well as the boundaries of the testing conditions, are available based on the data shown in [60]. To investigate the sensitivity of TCL to the input parameters, sensitivity analysis has been conducted for lifetime models’ coefficients. The results indicate that β1 and β2 have the most significant influence on TCL. The two temperature-related constants β1 and β2 are considered sources of uncertainty in the lifetime model, respectively. They are specifications of the junction temperature mission profile and have a considerable impact on TCL and IGBT lifetime. The sensitivity of TCL and lifetime to β1 and β2 can be evaluated individually or collectively, and the distribution of the TCL and lifetime of the IGBT can be obtained, allowing for a lifetime analysis with a specified confidence level. The lifetime can ultimately provide a more accurate and interval-based estimation to the lifetime and TCL of solder and bond wire failure mechanisms in a population of 10,000 IGBTs. Therefore, a certain standard deviation and average for the parameters are considered, and the MC method is used to randomly select β1 and β2. Each selected parameter is assigned to a specific IGBT. Since the inputs (β1 and β2) are nondeterministic, the lifetime prediction is also nondeterministic. This means that the result of the lifetime analysis, based on β1 and β2 (inputs represented by probability distributions), is itself a probability distribution. It is assumed that β1 and β2 have variations of 5% and 20%, respectively [32, 60]. In Figure 17, the confidence interval is set to 95%.
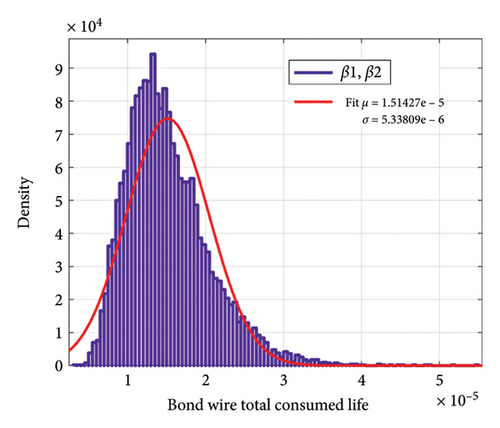
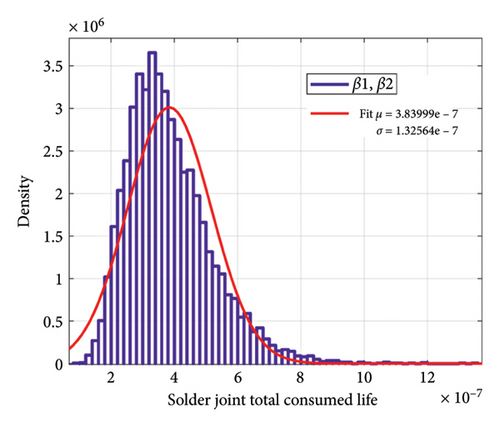
Considering kI = 0.2 and kp = 0.0007, the TCL of two failure mechanisms, using the MC method for a population of 10,000 IGBTs, is shown in Figures 18 and 19. Although β2 has a large value and percentage change compared to β1, the standard deviation of TCL distribution for both failure mechanisms is larger for β1 changes than for β2.
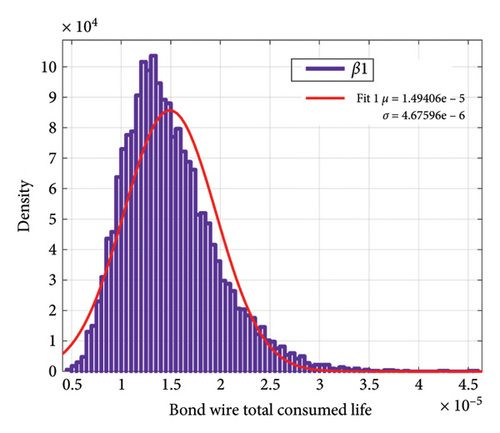
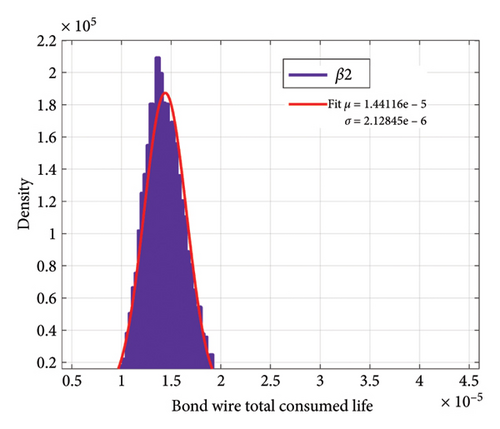
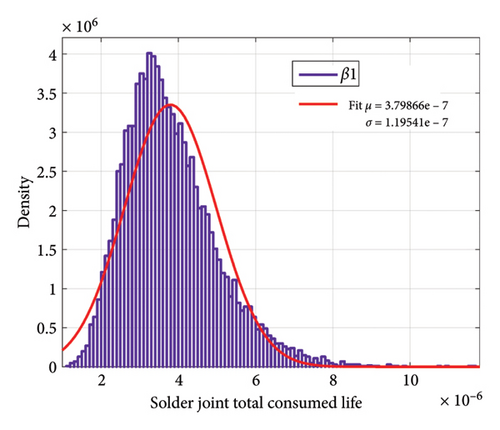
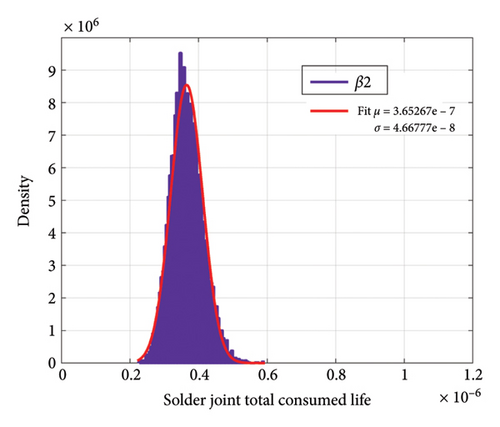
Figure 20 shows the changes in TCL according to the simultaneous changes of β1 and β2. As can be seen, in this case, the standard deviation in both failure mechanisms is larger than the effect of changes in either β1 or β2.
Now, if we consider the number of mission profile iterations in Figure 2 as 10 times a day, we can achieve the aging distribution of the IGBT converter according to the changes in the model parameters. Figure 21 indicates the distribution of sample ages for bond wire failure according to the changes in each of the parameters β1 and β2. In Figure 22, the distribution of the lifetime of the samples for solder joint failure is shown according to the changes in each of the parameters β1 and β2. Despite the large percentage of changes in β2 compared to β1, the standard deviation of the lifetime due to changes in β2 for bond wire and solder joint failure mechanisms is 2.88 and 97.89 years, respectively, while these numbers are 6.37 and 252.6 years due to changes in β1, respectively. Figure 23 indicates the distribution of lifetime for two failure mechanisms with the simultaneous shift in β1 and β2. With a confidence level of 95%, for the selected samples, for the bond wire failure mechanism, the age is between 6.1 and 34.6 years, while for the solder joint fatigue failure mechanism the age ranges from 245.2 to 1351.5 years.
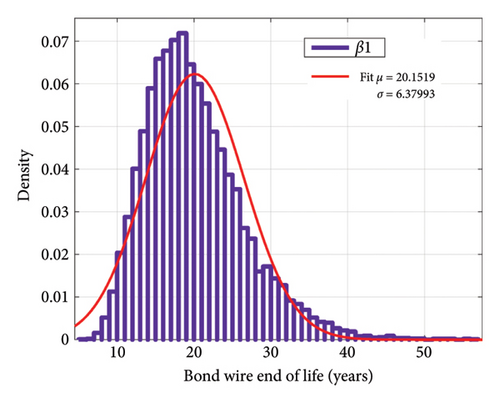
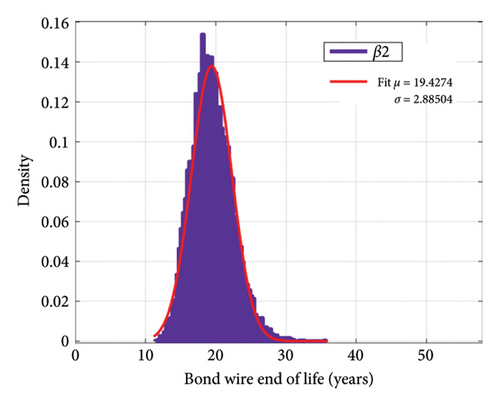
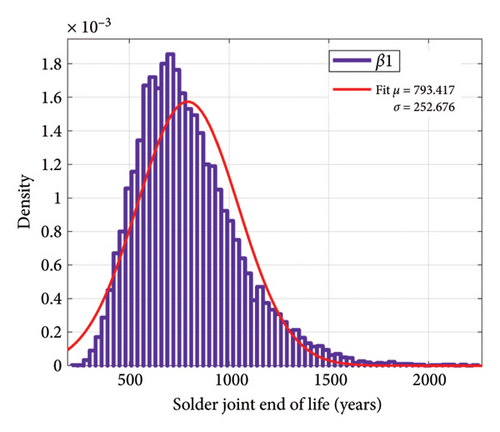
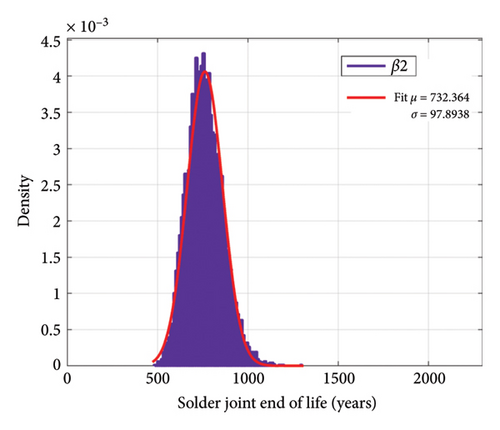
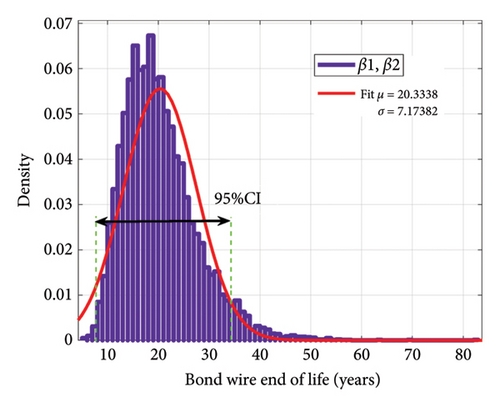
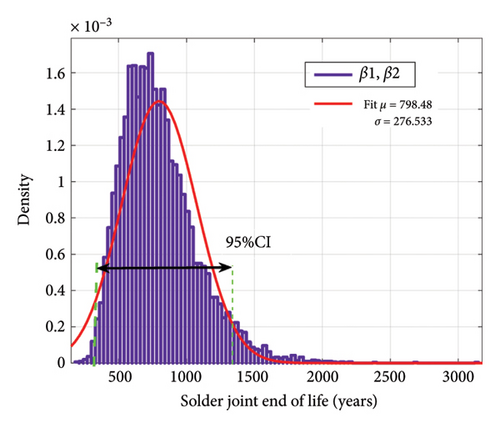
Figure 24 shows the cumulative distribution function for two IGBT failure mechanisms under simultaneous changes of β1 and β2. As it is known, 10% of IGBTs are expected to fail due to bond wire fatigue after 11.2 years and approximately 450 years for the solder fatigue failure mechanism. Considering the 50% and 90% failure rate of IGBTs, these numbers are 19.2 and 29.8 years for the bond wire failure mechanism and 750 and 1160 years for the solder joint fatigue mechanism, respectively.
6. Conclusion
In this paper, IGBT reliability analysis was conducted from two perspectives. Choosing a robust controller from the reliability vantage point and lifetime estimation might be controversial issues in the devising of PE converters. It is shown that the selection of the controller can affect the IGBT lifetime by several percent. The presented method can be used to design the converters and other electrical systems. From the statistical analysis point of view and MC, due to the use of the empirical method, normal distributions were considered for the coefficients of the lifetime model. Considering a statistical population of 10,000 IGBTs and a confidence level of 95%, the age range for bond wire and solder joint failures was between 6.1 and 34.6 and between 242.5 and 1351.5 years, respectively, for all parameter variations. The provided MC and control analysis can be applied to all the specifications in lifetime models and circuit variables to investigate their effects on the performance and reliability of the EV converter.
Conflicts of Interest
The authors declare no conflicts of interest.
Author Contributions
The corresponding author contributed to the conception. All authors contributed to the study and model design. All authors commented on the manuscript. All authors read and approved the final manuscript.
Funding
No funding was received for this manuscript.
Open Research
Data Availability Statement
The data presented in this article are available on request from the corresponding author. The data of this study are displayed.


