Hybrid Control DC Microgrid Embedded With BESS and Multimode Adaptive Standalone PV
Abstract
The advantages of DC distribution over AC distribution, combined with greater penetration of photovoltaic (PV) systems, have enhanced the popularity of DC microgrids. With the intermittency of a PV system, power management in a DC microgrid is an issue, but it can be addressed by using a battery energy storage system (BESS) as a backup. The goal is to maintain a constant DC-link voltage while balancing demand and supply. The study establishes a hybrid control approach for a DC microgrid involving PV, BESS, and DC loads, utilizing both the PV system and the BESS. PV will operate as a primary voltage regulator, making BESS a secondary control, resulting in decreased battery consumption and extended battery life. To achieve this objective, a flexible power point tracking (FPPT) algorithm is suggested, which requires the PV to track the load profile by adaptively modifying its PV power output. The effectiveness of the devised control method is tested by running time domain simulations on several case studies. To assess the adapted system’s tolerance to seasonal changes, k-means clustering is utilized to generate a cluster of irradiance profiles. These clustering solar irradiance and load profiles were simulated for 24 h to illustrate the resilience of the devised control method.
1. Introduction
In the last 2 decades, there has been a rapid increase in renewable energy storage systems such as solar and wind and storage units in the electric sector to reduce greenhouse gas emissions, air pollution, and deregulation of the energy market and privileged prices of green energy [1]. Solar energy is the most abundantly available resource and easy to use but they are uneconomical and unreliable when used independently due to its intermittent nature. However, a photovoltaic (PV) system can be effectively used if used in conjunction with some backup supply such as battery energy storage systems (BESSs). Solar in conjunction with other backup sources is also known as a hybrid renewable energy source [2]. The use of hybrid renewable energy storage systems (HRESs) improves reliability and reduces power fluctuations, voltage variations, etc.
The major concerns with AC grids such as reactive power imbalances, stability and regulation, and increased penetration of PV systems and direct current (DC) devices into the grid have resulted in the increased popularity of DC microgrids [3]. In the DC microgrid, there are specific issues such as DC-link voltage variations and power management [4], and a suitable control technique can be developed to tackle these issues. The primary task for an algorithm is to track the load requirement and adjust the PV system power output accordingly. Once the PV can regulate the load power, there must be a control strategy for the overall control of BESS integrated with solar PV.
The idea of extracting maximum power from the PV is known as maximum power point tracking (MPPT). It is a controller that compensates for the changing voltage and current characteristics of solar panels [5]. The MPPT controller monitors the voltage and current of the PV panel and then determines the operating point (OP) that will deliver the maximum power from that particular panel. If the power levels increase, then the voltage also perturbs in the same direction, thereby reaching the maximum point and vice versa. The perturbation and observation method is the most popular method [6] to achieve MPPT. In this method, the maximum power point is reached by increasing or decreasing the voltage depending upon the power levels.
With increased PV capacity in the grid, control with MPPT techniques may lead to DC-link overvoltages and sometimes may overcharge the battery if connected to the system. Therefore, there is a need for another control algorithm which can fulfill the load demand and also maintain the DC-link voltage constant by controlling the output power extracted from PV panels. Such a technique is known as the flexible power point technique (FPPT). Unlike conventional MPPT, FPPT provides enhanced control by adjusting PV power output dynamically, which is particularly beneficial for grid-connected and hybrid microgrid systems. If the load power requirement is greater than the maximum power of the PV panel, the system tends to work in MPPT. If the load requirement is less than the maximum power, then it works in the FPPT mode. In the FPPT mode, the load power is extracted directly by limiting the output power by using an error duty generator [7]. In other types of the method [8], the voltage reference is generated based on the required power to generate the required power from the PV panel. The method described in [9] is found to be better when compared to [10] since it uses the adaptive voltage steps to reach the faster dynamic response. The FPPT technique discussed above is used to control the boost converter linked to the PV panel. The authors in [11] proposed a multimode FPPT algorithm that optimizes power point selection based on grid demands and available PV generation, enabling better energy distribution in microgrid configurations. Similarly, the authors in [12] introduced a low-voltage ride-through (LVRT)–capable FPPT–based PV system, ensuring stability during grid disturbances. The authors in [13] expanded on this by incorporating single and two-stage inverter-based control strategies for grid-connected PV power plants (PVPPs), improving reliability during grid faults.
Since PV is intermittent in nature, recent studies have integrated FPPT with battery energy management strategies to optimize energy storage utilization, enhance grid support, and improve system resilience under varying conditions [14]. The authors in [8] analyzed constant power generation (CPG) techniques that integrate FPPT with battery storage to regulate grid interactions and ensure stable voltage profiles. The authors in [15] extended this concept by implementing decentralized power management approaches in islanded microgrids, optimizing battery utilization while minimizing power losses. However, this system requires the battery to be always online, which degrades the lifetime of the battery. Recent research has also focused on advanced battery management strategies to complement FPPT. The authors in [9, 16] investigated model predictive control (MPC)–based battery management frameworks, which enhance energy dispatch efficiency in microgrids. Liu et al. [17] explored droop control methodologies for microgrid voltage regulation, integrating FPPT with battery storage to improve system adaptability to load variations. In this, the battery does not remain connected to the system all the time and is forced to operate only during the transient state of the system. In addition, the authors in [18, 19] developed cross-layer energy scheduling mechanisms, further refining the coordination between PV generation, storage, and demand-side management. However, this system requires certain communication devices with the load as well as PV.
While FPPT enhances PV power control, its implementation faces several challenges. One limitation is the increased computational complexity compared to MPPT, as FPPT requires real-time power adjustments based on grid conditions [11]. Moreover, FPPT’s effectiveness under partial shading conditions (PSCs) remains a concern, as conventional algorithms may lead to suboptimal power extraction. The authors in [20] proposed a PSC–resilient FPPT method, integrating scanning-aided control techniques to enhance tracking efficiency. Battery energy management, while improving power reliability, also presents challenges related to aging effects, charge/discharge efficiency, and cost. Studies by [21] and Shan et al. [22] highlighted the trade-offs between battery lifetime and frequent cycling required in FPPT–integrated systems. Furthermore, optimal scheduling of energy storage remains a complex problem, requiring advanced predictive algorithms to balance grid support and storage longevity [23].
The techniques mentioned above have tried to solve the excess PV power penetration issue by adopting certain power-limiting control techniques. In these techniques, there is the addition of new components such as power limiters to limit the power. Other systems have used techniques of voltage reference calculation to limit the PV power to a fixed level. Since the PV is intermittent in nature, the battery source is used as a backup. The battery system is utilized to supply the excess load demand when PV cannot meet the load requirements, and also it is used to regulate the DC-link voltage. However, the battery usage is exploited to maintain the DC-link voltage. Even if the PV can supply the load, the battery is connected to the system to regulate other parameters such as DC-link voltage. This indeed reduces the lifetime of the battery.
- 1.
To develop a control strategy for a standalone DC grid based on FPPT, which adjusts the PV power as per the load requirements.
- 2.
To reduce the usage of the BESS, make BESS as the secondary voltage regulator, and maintain the SoC of the battery at a defined threshold value.
- 3.
To utilize the k-means clustering algorithm for clustering solar irradiance profiles for the validation of the developed FPPT–based control scheme.
- 4.
To validate the control scheme for the standalone DC microgrid for different scenarios and determine the reduction in battery utilization.
The remainder of the paper is organized as follows. Section 2 describes the DC microgrid architecture, PV system, and battery storage controller. The k-means clustering of solar irradiance profiles is presented in Section 3. Section 4 describes the results and discussion for the FPPT–based control scheme followed by the conclusion in Section 5.
2. DC Microgrid Architecture and ITS Control
A microgrid is comprised of decentralized energy sources and loads. Distributed generations can include PV sources, wind generators, BESSs, and microgrids. These can be connected to the main power grid or operate independently in an islanded state. Due to the growing adoption of solar PVs, battery technology, and DC loads, DC microgrids operating in islanded mode are gaining popularity [24]. Figure 1 illustrates the architecture of a DC microgrid, which includes a PV string, a PV side DC–DC boost converter, a BESS with its DC–DC buck–boost converter, controllers, filters, and a DC load. It is important to maintain a steady voltage across the DC load in order to meet the load requirement and minimize the use of BESS to prolong its lifespan.
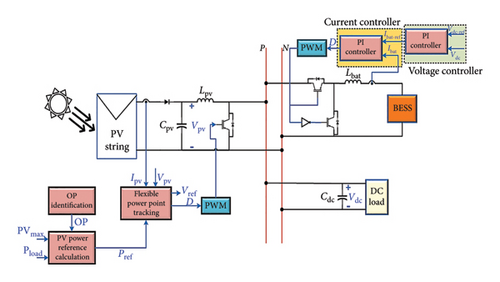
PV systems are continuously advancing and growing in both grid-connected and standalone applications. During grid connection, PVPPs often optimize power extraction by employing MPPT algorithms. PVPP typically needs to match the specific demands of the local power grid, which may occasionally be lower than the maximum power capacity. The multimode FPPT algorithm can accomplish this. In a stand-alone microgrid system, the PV system can run in either MPPT or FPPT mode, depending on the load needed and the backup supply, which in this case is the BESS. In this control algorithm, the PV system will function as the primary regulator, while the BESS will function as the secondary regulator. In addition, the BESS serves as a backup for the DC microgrid, ensuring that a higher SoC is maintained in the battery. The proposed technique is demonstrated in Figure 1.
- i.
The maximum power extraction technique involves extracting the maximum power from a PV panel using the standard perturb and observe (P&O) algorithm.
- ii.
The constant power extraction method involves extracting a consistent amount of electricity from the PV panel. The power needed for continual power extraction will vary based on the load power, battery SoC, and the rate at which the battery is being charged or discharged. The calculated reference power can occasionally cause the system to operate in MPPT mode as well.
The initial stage in this control approach is determining the OP, which will determine the operational condition of the PV system and BESS. The objective is to designate the OP in such a way that the PV system functions as the main regulator, while the BESS serves as a backup to fulfill the load demand and ensure the stability of the DC-link voltage.
2.1. Hybrid Control Strategy for OP Identification
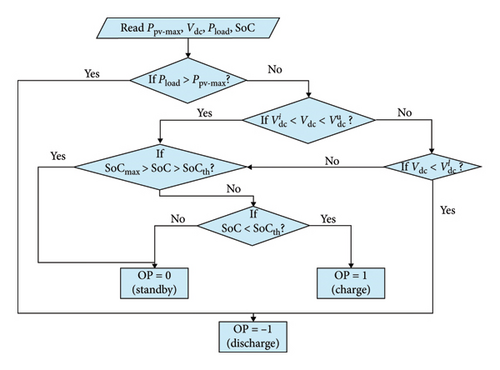
In the given context, n represents the sample number, Ta denotes the time step, Qbat represents the battery capacity, and η signifies the charge/discharge efficiency. The SoC will vary in direct proportion to both the amplitude and direction of the current flowing into the battery (). Choosing the optimal value of SoCth is essential for prolonging the battery’s lifespan. A higher value of SoCth will result in more frequent charging or discharging of the battery, which will increase the ambient temperatures and further degrade its lifespan. A lower value of SoCth may result in a shortage of power during cloudy days, leading to potential disruptions in satisfying the demand. However, it will contribute to a longer battery life.
The battery remains in standby mode (neither charging nor discharging) if the voltage is within the predefined limits and the SoC of the battery is more than the threshold value. In this case, OP is set to 0 and BESS is disconnected from the system.
- •
Pload > PPV−max: battery is required to discharge, OP = −1.
- •
Pload < PPV−max and : battery is required to discharge, OP = −1.
- •
Pload < PPV−max, , and SoCmax > SoC > SoCth: battery is required to be at the standby mode, OP = 0.
- •
Pload < PPV−max, and SoC < SoCth: battery is required to charge, OP = 1.
- i.
SoC is within the limit
- ii.
DC-link voltage is within the specified limit (VDC−l and VDC−u)
- iii.
PV power is sufficient for the load demand
Once the OP status is identified, the next step is to generate duty cycles for the DC–DC PV system controller and battery controller.
2.2. Multimode FPPT
-
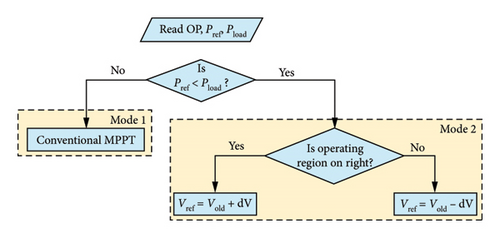
Mode 1 (Pref > PPV−max):
-
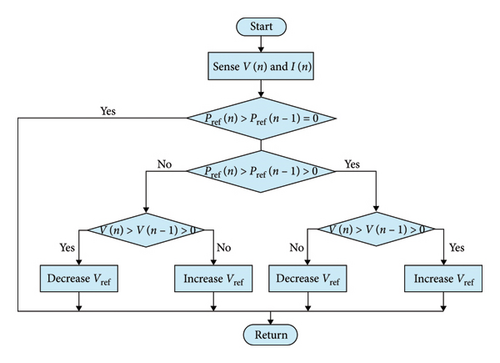
During this mode of operation, the FPPT algorithm compels the system to operate in MPPT mode. The MPPT is implemented using the P&O algorithm [25], as illustrated in Figure 4. It functions by determining the direction of voltage change and the phase change in voltage in the PV system in relation to the change in PV power. In each stage, a constant voltage step dV is added to the old reference voltage to shift the OP to the maximum power point. dV will be zero at the optimum power point, and the MPPT algorithm will ensure that the system reaches that point. The PV converter’s duty is directly proportional to the voltage change, as illustrated in the following equation:
() -
Mode 2 (Pref < PPV−max):
-
During this mode, the MPPT operation ends and the most recent reference voltage is utilized. The user has the option to select the operating region, either on the left or right side. If the user selects the left region, the new reference is generated using Vref = Vold − dV derived from the PI controller, as illustrated in Figure 5. The error between the reference power and PV power is used as the input for the PI controller. If the error is significantly large, then the change in voltage (dV) likewise becomes significantly huge, allowing us to quickly approach the OP. If the reference power approaches its maximum value, it will decrease in order to achieve efficient operation. As a result, the amplitude of oscillations around the OP is significantly decreased.

2.3. Calculation of PV Power Reference
ΔP is a variable parameter to regulate the DC-link voltage and is the output of the PI controller which compares the DC-link voltage and reference voltage at the current sample when the battery is in the standby mode.
2.4. BESS
BESS is required to meet the variable load demand in a standalone DC microgrid to mitigate the intermittency associated with the PV due to variations in solar irradiance. A DC–DC bidirectional buck–boost converter is used to control the charge/discharge cycles of the battery. During charging (OP = 1), the buck mode is activated, and during discharging (OP = −1), the boost mode is activated. A voltage controller and current controller are used to control the charging/discharging activity of BESS. The detailed description of these controllers is elaborated in the next sections.
2.4.1. Voltage Controller
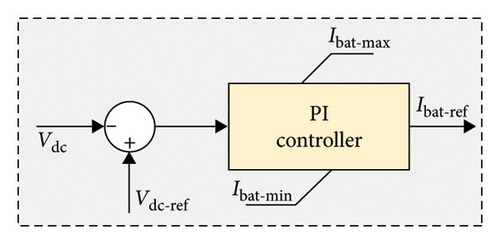
The voltage controller shown in Figure 6 is used to generate the reference required by the current controller. The DC-link voltage is maintained by generating the reference current for the battery limited by the minimum and maximum value of the battery current. The DC-link voltage controller is slower than the current controller and faster than the FPPT controller. This makes the DC-link voltage adjustment according to the desired value. The voltage controller not only responds to changes in voltage but also responds to the rate of change of the voltage. It also takes care of sudden changes. These things are made possible during the design stage of the PI controller.
2.4.2. Current Controller
The current controller shown in Figure 7 takes the input current reference from the voltage controller and compares it with the actual current of the battery. The generated error is fed into the PI controller, which generates the duty signal, which is further fed to the PWM for the generation of switching pulses for the bidirection controller.
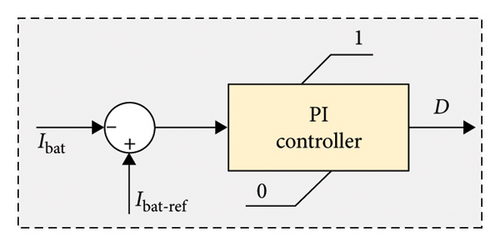
The charging pulse or discharging pulse of the battery controller is decided in the voltage control loop itself. For instance, if the error is positive, it means that the actual voltage is greater than the desired voltage. So, the generated error signal is positive compared to the battery’s actual current, and pulses are given. On the contrary, if the voltage controller generates a negative error, it means that the DC-link voltage requirement is not met, and the battery should discharge. The signal generated by the voltage controller will be positive so that it gets compared with the actual battery current, and a relevant switching signal is generated.
3. Solar Irradiance Profiles’ Clustering
-
K-means clustering [26]: It is the simplest unsupervised learning technique to cluster the unlabeled data into certain groups. It is also known as Lloyds algorithm grouping the data in Euclidean space (within the cluster, the sum of squares is minimized). It is a search algorithm for the problem of N data points in space. In this algorithm, given by Algorithm 1, k centers are chosen such that the sum of the squared Euclidean distance between each data point and its nearest center is minimized. The algorithm initially assumes k centers and assigns the nearest data points to their respective centers based on the Euclidean distance and each center point is calculated again as the mean of all data points. The initial dataset with multiple attributes is required to be clustered into vector c of cluster assignment for each sample and k mean vectors μ. Then, the input and output quantities of the given algorithm will be
()
There are various ways to find an optimum number of cluster k. In this study, k is chosen based on the number of seasons occurring. One can also find the optimal number of clusters by identifying the knee point of the objective function for various number of clusters. The time and space complexity of k-means clustering is O(NkId) and O((N + k)d), respectively, where N is the number of data points, k is the number of clusters, I is the number of iterations, and d is the number of attributes.
-
Algorithm 1: Steps to cluster the solar irradiance profile using k-means.
- 1.
Determine the number of clusters as per seasonal variation
- 2.
Randomly select cluster centers
- 3.
Determine data points that are closer to the cluster center of all the cluster centers and assign data points to that cluster
- 4.
Recalculate cluster centers using the following equation:
-
-
where cj is the number of data points in the jth cluster.
- 5.
Recalculate the distance between each data point and newly obtained cluster centers and assign data points to new clusters
- 6.
Go to Step 4, if there are no changes in the centroid of the new cluster centers obtained, then STOP, otherwise go to Step 5
4. Results and Discussion
The performance of the adopted method for minimizing battery energy utilization in a stand-alone DC microgrid system is investigated through simulations carried out in MATLAB 2014a on a system with an i7 processor, 3 GHz frequency, and 8 GB of RAM. The complete simulation parameters for the DC microgrid and PV and battery converters are given in Tables 1 and 2, respectively. The PV power is controlled using a FPPT algorithm. The BESS is used as a backup source, which is used to supply power when the PV panel is unable to meet load demands. The two-layer control strategy is used to control the battery. A hybrid OP identification strategy is used to reduce the usage of batteries.
| Parameter | Value |
|---|---|
| Battery capacity, Qbat | 12.5 Ah |
| Battery voltage rating, Vbat | 96 V |
| DC-link reference voltage, VDC−ref | 180 V |
| DC-link voltage upper limit, | 190 V |
| DC-link voltage lower limit, | 170 V |
| PV voltage at MPP, | 65 V |
| PV maximum output power, PPV−max | 950 W |
| Peak load demand, | 1300 W |
| Average load demand, | 700 W |
| SoC upper limit, SoCmax | 95% |
| SoC lower limit, SoCmin | 25% |
| SoC threshold limit, SoCth | 85% |
| Parameter | Value |
|---|---|
| PV converter input voltage, Vin | 100–120 V |
| PV converter output voltage, Vout | 175–180 V |
| Allowable current ripple | 5% |
| Allowable voltage ripple | 1% |
| PV side inductor, LPV | 200 mH |
| PV side capacitor, CPV | 900 μF |
| Battery side inductor, Lbat | 2 mH |
| DC-link capacitor, CDC | 1 mF |
4.1. Case Studies for Varying Conditions
Dynamic simulations are carried out to demonstrate the effectiveness of the developed microgrid for various scenarios as listed in Table 3. These test cases verify the response of the system under various loading conditions and initial battery SoC. The results in this section are based on the assumption that the initial cell temperature is 25∘C. The initial temperature of the solar panel is 25∘C. The irradiance is fixed at 1000 W/m2.
| Parameter | Case 1 | Case 2 | Case 3 | Case 4 | Case 5 | Case 6 | Case 7 |
|---|---|---|---|---|---|---|---|
| Pload (W) | 600 | 1300 | 600 | 1300 | 600 | 1300 | 600 |
| PPV−max (W) | 950 | 950 | 950 | 950 | 950 (0-1 s) | 950 (0-1 s) | 950 |
| 0 (1–1.4 s) | 575 (1-2 s) | ||||||
| 575 (1.4–2 s) | |||||||
| VDC−ref (V) | 180 | 180 | 180 | 180 | 180 | 180 | 180 |
| Operating region | Left | Left | Left | Left | Left | Left | Left |
| Initial SoC | 95% | 95% | 84% | 84% | 95% | 94% | 84.99% |
Case 1. Pload < PPV−max and SoC > SoCth
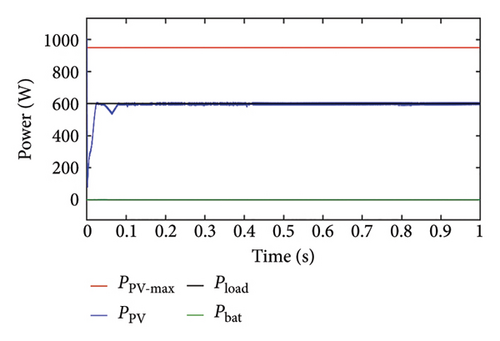
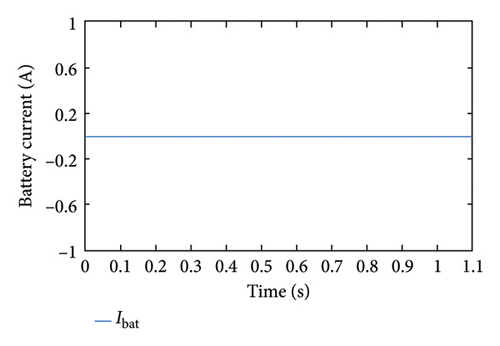
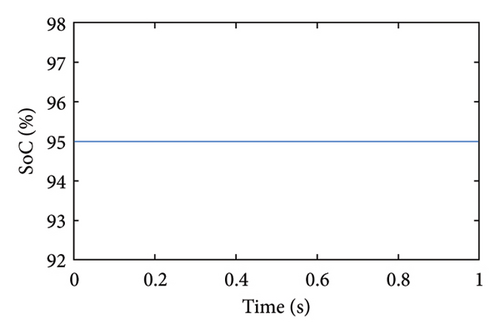
Load power is assumed to be less than the PV maximum power and SoC is assumed to be within the limit. Since the load power is less, the PV panel is anticipated to work in FPPT mode and generate power equivalent to the load requirement, which can be confirmed in Figure 8(a). As seen in Figure 8(b), we can observe that the PV voltage is less than the MPP voltage, which directly concludes that the PV panel is operating in the left region. Since the battery is in the isolated condition, the battery current is zero and SoC remains constant throughout the operating time of the system as seen in Figures 8(c) and 8(d), respectively.

Case 2. Pload > PPV−max and SoC > SoCth
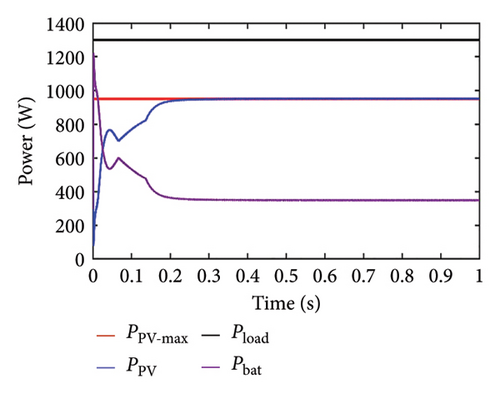
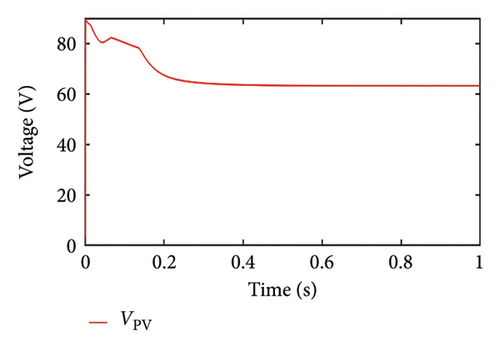
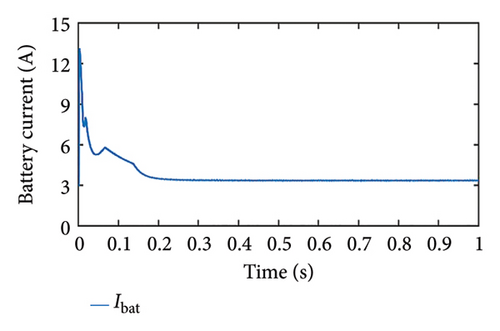
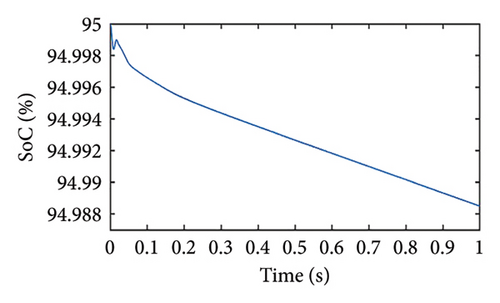
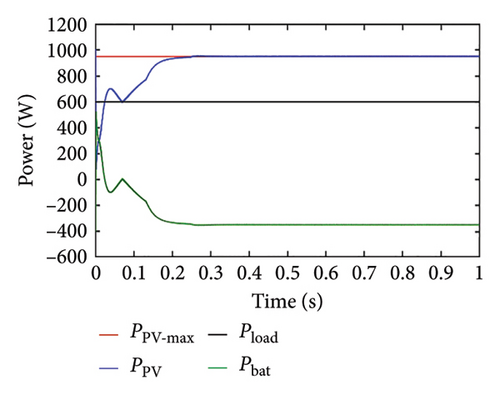
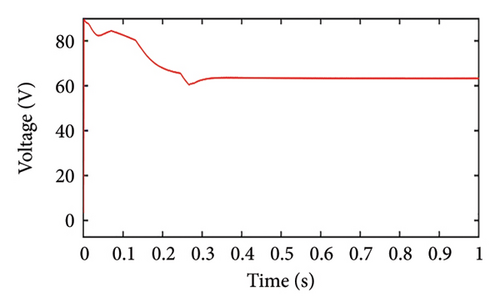
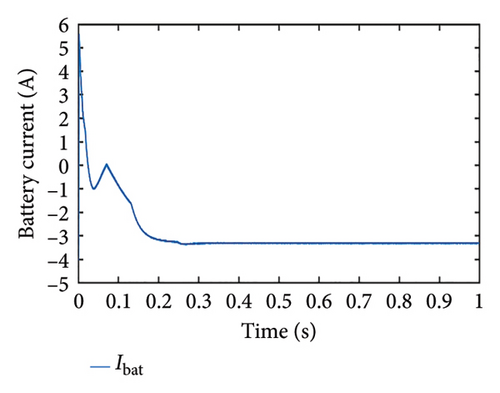
In this case, the load power is assumed to be greater than the PV maximum power, and SoC is assumed to be within the limit. Since the load power is more, the PV panel is anticipated to work in MPPT mode, which can be confirmed in Figure 9(a). The power output at the MPP point is 950 W and power from the PV system initially starts increasing and follows the MPP point at around 0.2 s. After this time, the power from the PV system remains constant. Similar observations are made for discharging power from a battery (OP = −1). Initially, the battery discharges at a higher rate and gradually it decreases and becomes constant at 350 W. As seen in Figure 9(b), we can observe that the PV voltage is equivalent to the MPP voltage, which further confirms that the PV panel is operating at the MPP point. Since the battery is supplying power, the SoC is reduced gradually, and the battery current remains according to the load requirement throughout the operating time of the system as seen in Figures 9(c) and 9(d), respectively.
Case 3. Pload < PPV−max and SoC < SoCth
In this case, the load power is assumed to be less than the PV maximum power, and the initial SoC initial is set at 94%. Since the battery needs to be charged to reach the SoC threshold limit, the PV panel operates in MPPT mode as shown in Figure 10(a). The power drawn by the battery is negative indicating that the battery is charging. As seen in Figure 10(b), it is observed that the PV voltage is near to the MPP voltage. Since the battery is getting charged, the SoC increases, and the battery current settles down to approximately 3 A as shown in Figures 10(c) and 10(d), respectively.
Case 4. Pload > PPV−max and SoC < SoCth
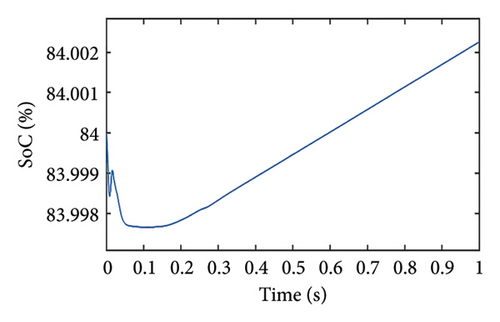
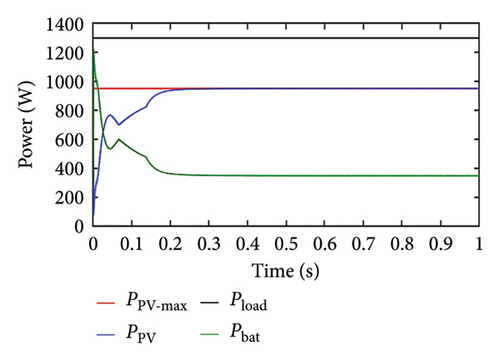
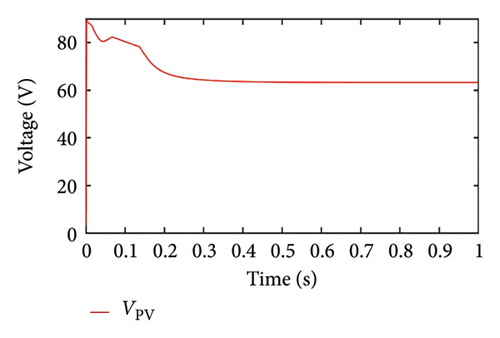
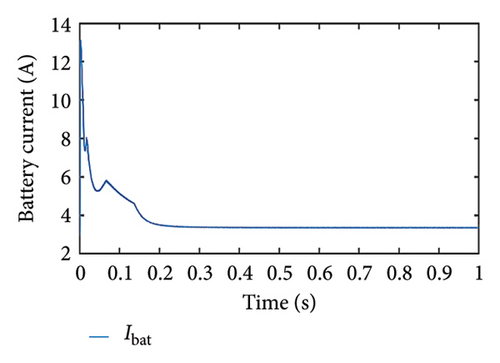
In this case, the load power is assumed to be more than the PV maximum power, and the initial SoC is set to 84%. As load power is more, the PV panel is anticipated to work in MPP mode, which can be confirmed from the PV panel operating in MPPT mode (Figure 11(a)). We can observe in Figure 11(b) that the PV voltage is equivalent to the MPP voltage. Even though SoC < SoCth, the priority is to meet the load demand rather than charging the battery. Therefore, the battery supplies the power, which can be confirmed by observing the battery current and SoC in Figures 11(c) and 11(d), respectively.
Case 5. Sudden variation in solar irradiance
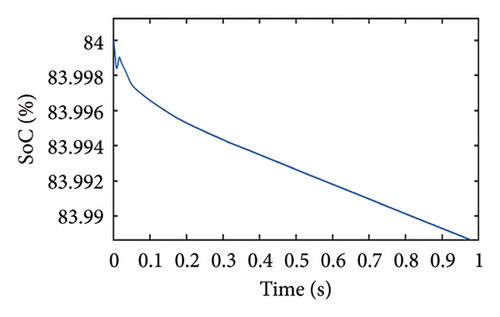
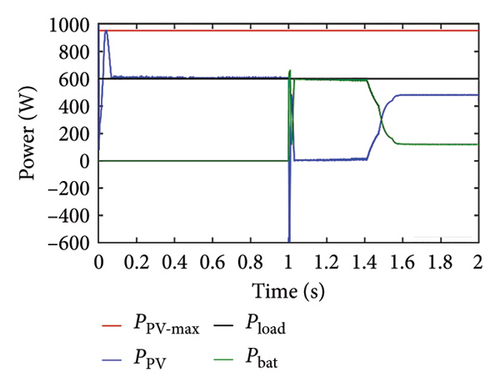
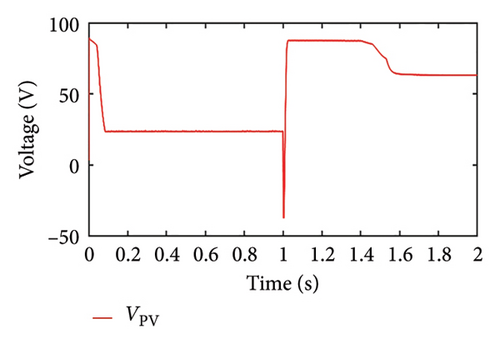
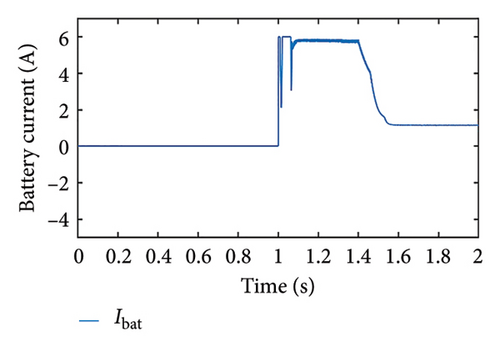
In this case, the load power is assumed to be less than the PV maximum power up to a certain time, and later, the PV power becomes less than the load power; SoC is maintained within the limit throughout the operating time. From Figure 12(a), it is seen that the PV panel generates power to meet the load requirements, and the battery power is zero. At time t = 1 s, the PV power becomes zero, so the battery compensates for the load requirement and OP is set to 1. At time t = 1.5 s, the PV along with the battery is able to meet the load requirement. The PV voltage adjusts according to the load requirement up to 1 s instant as shown in Figure 12(b), and later it varies such that the PV power reaches its maximum at that irradiance level. The battery current is zero till 1 s (the battery is isolated) and increases thereafter implying that the battery is discharging. After 1.5 s when the PV is able to meet the load demand up to some level, the discharging current of the battery reduces. We can deduce from Figure 12(d) that SoC starts decreasing at 1 s instant at a higher rate and the rate of discharge decreases after 1.5 s.

Case 6. Pload > PPV−max and sudden irradiance variation
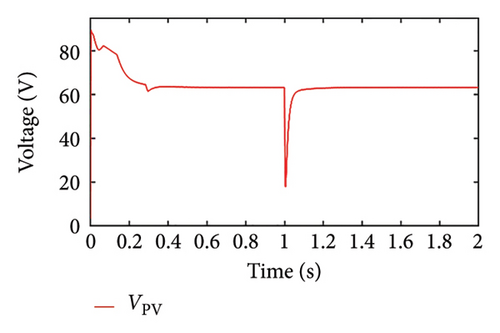
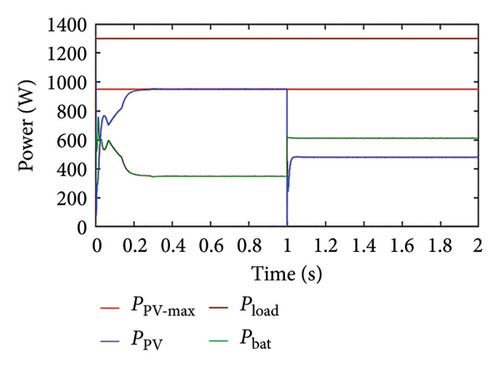
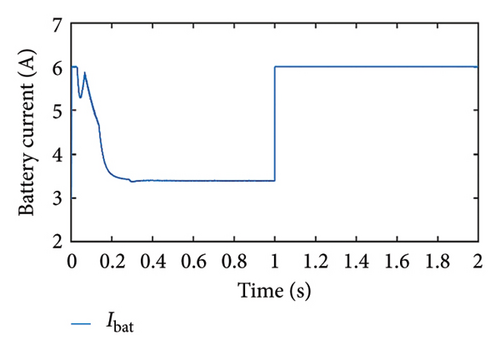
The load power is assumed to be greater than the PV maximum power, and SoC is maintained within limit throughout the operating time. As seen in Figure 13(a), the PV panel is working in MPP mode since Pload > PVmax. It is observed that the battery is also discharging (OP = −1) to meet the load requirement. At 1 s time instant, the PV power is reduced to half of its maximum; therefore, the battery compensates for the load requirement by increasing its discharge rate. The PV voltage adjusts to force the PV system to work in MPP mode. From Figure 13(c), it can be seen that the battery discharge current is initially less as the power requirement from the battery is low and then increases after 1 s as the power supplied by the PV becomes half. SoC is reducing gradually since the battery is functioning throughout the operating time as shown in Figure 13(d).

Case 7. SoC < SoCth
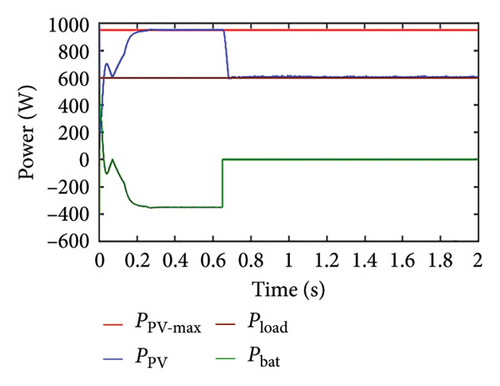
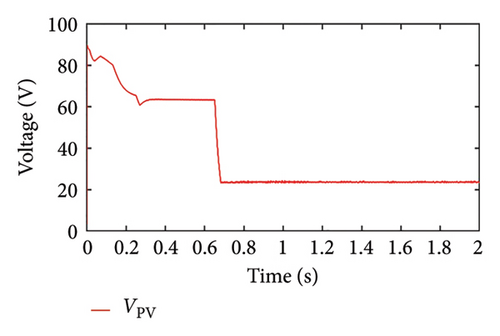
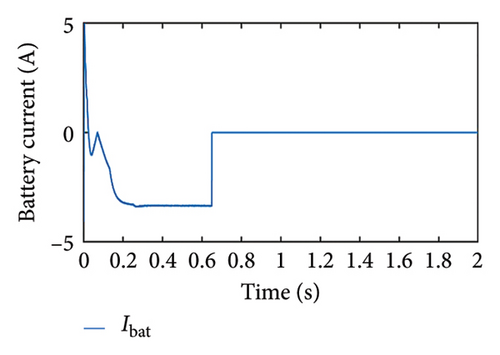
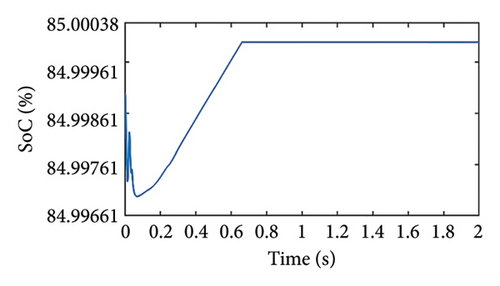
In this case, the performance of the adapted strategy is evaluated when the load power is less than the maximum power of the PV panel and the initial SoC of the battery is less than the threshold level. The PV panel tends to operate in MPPT mode so that the load requirement is met and the battery gets charged, which we can see in Figure 14(a). After some time, the PV power is limited to load power by varying the PV voltage, as seen in Figure 14(b). Since the battery is in charging condition (OP = 1), the battery current is negative signifying that the battery is charging and SoC increases at a constant rate to a certain time, and once the threshold limit is reached, they become constant as shown in Figures 14(c) and 14(d), respectively.
4.2. Testing the Robustness of the Controller
A hybrid controller for a standalone DC microgrid is tested for varying solar irradiance and 24 h loading conditions to demonstrate the robustness of the system. Yearly irradiation profiles [27] are clustered into groups of 6 using a k-means clustering algorithm. This is performed to reduce time complexity. The centroid of these six clusters is further utilized for validation of the developed algorithm as shown in Figure 15.
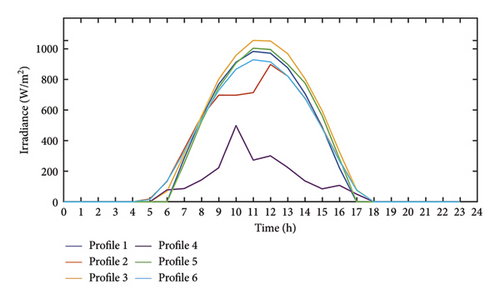
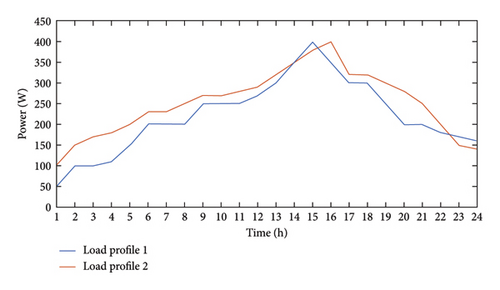
Profiles 2 and 4 resemble the condition for partial shading, while other profiles vary gradually with varying maximum irradiance. The clustering of solar irradiance profiles also demonstrates that for any planning area, four to six irradiance profiles will be sufficient to characterize the complete behavior of yearly irradiance profiles. Thus, these clustered profiles can be utilized for further analysis. Two load profiles used in the simulation are shown in Figure 16.
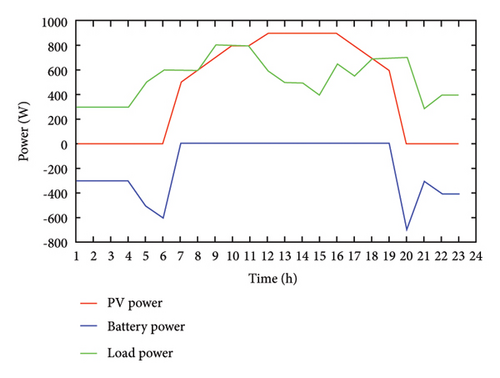
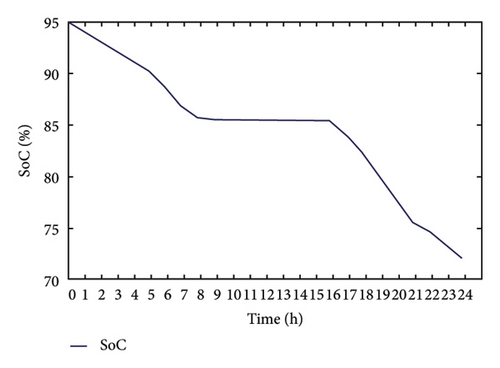
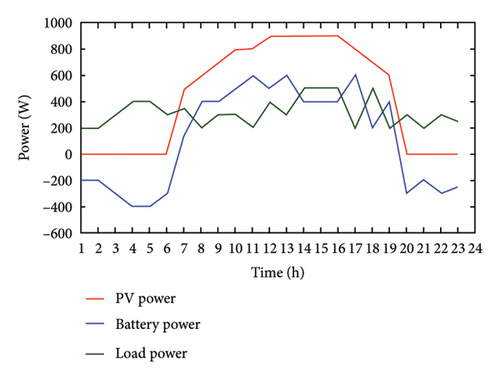
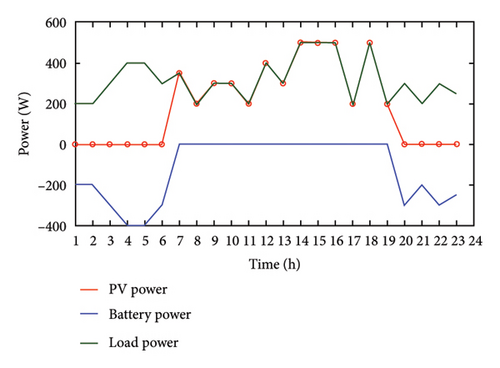
One sample case is shown to represent the performance of the developed microgrid for 24 h. In this case, Solar irradiance profile 1 from Figure 15 is considered along with the Load profile 1. The variations of SoC, battery power, and load power for 24 h duration are studied.
From Figure 17(a), it is observed that PV power is zero till 6:00 a.m., and hence battery is anticipated to supply the load, which can be confirmed from the figure. Once the PV is able to supply the load, the battery discharge rate reduces slowly. By the time PV is completely able to supply the load, the battery gets isolated as the threshold limit of the battery is set at 85%. Again when PV power becomes zero during the evening, the battery starts discharging to the meet the load requirement, which can be confirmed by observing the SoC in Figure 17(b).
The analysis is also carried out for the time span of 3 years to demonstrate variation in the solar irradiance profile, power dissipated by the battery, PV output power, and SoC with the help of the box plots as shown Figure 18. In these box plots, the central line represents the median, while the bottom and top edges of the box correspond to the 25th and 75th percentiles, respectively. The whiskers extend to the most extreme data points that are not classified as outliers, while outliers are displayed separately using the “+” marker symbol with red color. Outliers are identified using the interquartile range (IQR) rule. The outliers are those which lie outside the range of {Q1 − 1.5 × IQR and Q3 + 1.5 × IQR}, where: Q1 (first quartile) is the 25th percentile of the data, Q3 (Third quartile) is the 75th percentile of the data, and IQR is Q3 − Q1.
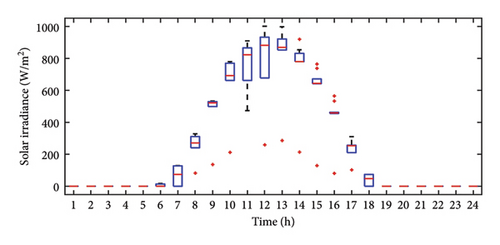
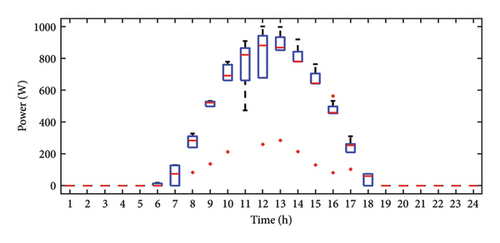
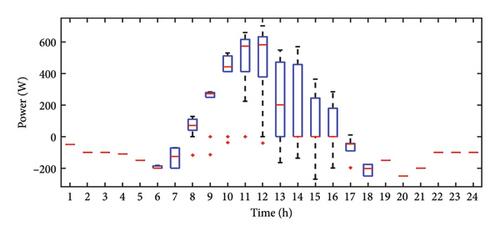
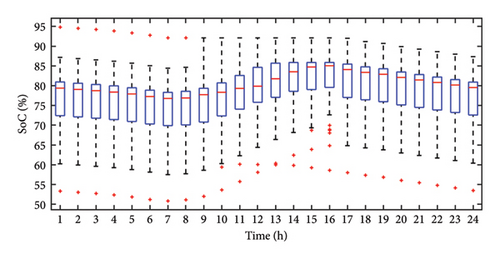
The increased number of outliers in irradiance indicates significant weather variability. As observed in Figure 18(a), irradiance remains at zero until 6:00 a.m. on most days, with minimal variation and no outliers during this period. The presence of outliers in irradiance plots suggests fluctuations caused by environmental factors such as rain. Consequently, until 6:00 a.m., the battery supplies power to the load, as confirmed by Figure 18(c). A positive battery power value indicates charging, which is further validated by Figure 18(d). During peak PV generation at 12:00 p.m., the power generated by the PV panel exceeds the load demand, and the surplus energy is used for battery charging. This is evident from Figure 18(c), where battery power varies between zero and 600 W, depending on whether the battery’s SoC falls below the threshold level. A battery power value of zero suggests that the PV system is operating in FPPT mode, and the battery remains in an isolated state due to its SoC exceeding the threshold. After peak irradiance levels, typically around 4:00 p.m., irradiance gradually declines with reduced variability. As a result, fluctuations in battery power also diminish, since no excess PV power is available for charging. The median SoC value peaks around 4:00 p.m., which is significantly higher than the early morning SoC at 8:00 a.m., as shown in Figure 15, confirming battery charging during peak irradiance hours. A similar trend is observed in PV power output, which follows solar irradiance, indicating operation in MPPT mode. However, instances such as 3:00 p.m. and 4:00 p.m. exhibit larger power output variations compared to irradiance, suggesting PV operation in FPPT mode, as seen in Figure 18(b). Comparing irradiance and PV power box plots further supports the use of the FPPT algorithm for power extraction. For example, at 4:00 p.m., irradiance variability is negligible, but PV power output exhibits significant fluctuations, as indicated by the wider boxplot. The fact that the median PV power at 4:00 p.m. is closer to the first quartile suggests that maximum power is extracted most of the time. In addition, the lower number of outliers in PV power and SoC distributions suggests that the energy system employs a smoothing effect, likely due to energy storage mechanisms that balance power fluctuations. Furthermore, by analyzing the outliers, it is observed that sudden variations in irradiance are present due to weather changes such as cloud cover or rain, appearing after 6:00 a.m. but absent before this time, while outliers in PV power reflect rapid power fluctuations, often aligning with irradiance changes. Variations around 3:00 p.m. and 4:00 p.m. suggest operation in FPPT mode. Fewer outliers in battery power output indicate that the battery smooths fluctuations, with occasional deviations due to load changes or charge/discharge cycles, and lesser outliers in battery SoC suggest stable energy storage, with variations linked to PV power fluctuations.
4.3. Comparison With Conventional Control Strategy
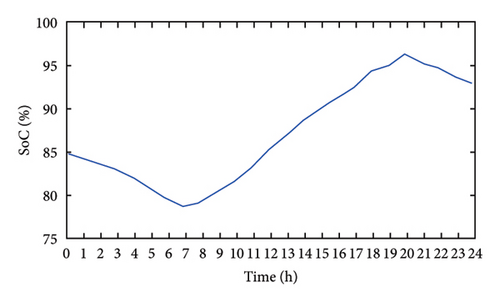
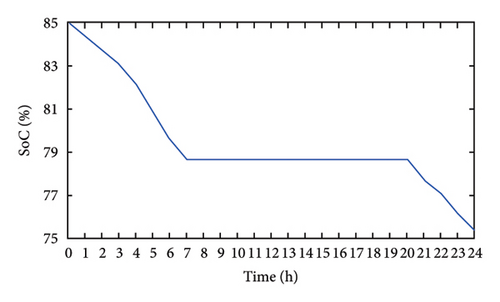
A comparison between the conventional control strategy based on MPPT and the developed control methodology is also carried out to demonstrate the effectiveness of the control algorithm in terms of increased battery life. In Figure 19(a), it is observed that irradiance is zero up to 6:00 a.m., so it is anticipated that the battery should supply the load power, which can be confirmed from the figure. SoC reduces gradually to meet the load requirement indicating that the battery is discharging. Once PV is able to supply the load, the SoC increases and reaches 95% in the conventional strategy, which can be seen in Figure 19(c). However, if the same PV and load profile are applied to the adopted methodology, we can observe that the battery discharges up to a certain time, and once the PV is able to meet the load, the battery is anticipated to get isolated (if the SoC is above the threshold), which can be confirmed from Figure 19(d). Since the SoC is constant in this method as compared to the conventional method, the temperature variations due to charge/discharge are eliminated. Whereas in the case of the conventional method, as seen in Figure 19(c), the SoC increases even though the battery SoC is above the threshold level; this causes overcharging issues and reduces the lifetime of the battery. Furthermore, the operating status becomes zero (isolated) for 1260 h in the adopted strategy as compared to 882 h in the conventional strategy in the span of 3 years. This concludes that for around 378 h, the battery is either charging/discharging state in the conventional control technique as compared to the adopted strategy where it is isolated. This charging/discharging cycle would cause power dissipation in the battery resulting in a decrement in the lifetime of the battery.
5. Conclusions
In this study, a control methodology is developed for a standalone DC microgrid with PV and BESS. The main objective is to meet the load demand while maintaining DC-link voltage within the permissible limit, minimizing the utilization of battery storage and maintaining the battery SoC above defined the threshold limit. For the same, the PV system acts as the primary voltage regulator and the battery as the secondary. Time domain simulations are carried out for various case studies indicating different scenarios to validate the efficacy of the developed control algorithm. The results show that the developed control strategy is able to maintain the DC-link voltage within the permissible limit and the SoC of the battery remains above the threshold limit. The battery gets isolated when not in use, thus increasing its life. Furthermore, the validation was carried out for the span of 3 years. For the same, clustered yearly solar irradiance profiles using the k-means algorithm and different load profiles were considered. These clustered irradiance profiles represent all the conditions such as partial shading and rain and sunny days. The results obtained here indicated that SoC is maintained within the required level throughout the operating time. The battery gets isolated when SoC is within the threshold level. Furthermore, the maintenance of SoC within limits concluded that the usage of BESS had been reduced. Due to this reduction in usage, the heat dissipation also got reduced, which in turn contributed to the increment of the lifetime of the battery. This was confirmed by comparing the developed control strategy with a conventional MPPT–based algorithm. It was found that the battery remains isolated for more than 378 h in the case of the FPPT–based algorithm as compared to the conventional algorithm indicating a lesser number of charge/discharge cycles, thus increasing battery life.
In future, the dynamic adaptability of the algorithm can be improved by adaptive control mechanisms, predictive learning (e.g., machine learning and MPC), and advanced filtering techniques to minimize transient effects. FPPT algorithms used in this work can also be advanced by considering the grid connectivity and making it grid fault-tolerant and other uncertainties associated with grid connectivity with integration of renewable sources such as wind energy and fuel cells.
Nomenclature
Abbreviations
-
- PV
-
- Photovoltaic
-
- BESS
-
- Battery energy storage system
-
- HRES
-
- Hybrid renewable energy storage systems
-
- MPPT
-
- Maximum power point tracking
-
- FPPT
-
- Flexible power point tracking
-
- SoC
-
- State of charge
-
- PVPPs
-
- Photovoltaic power plants
-
- OP
-
- Operating point
-
- P&O
-
- Perturb and observe
-
- PI
-
- Proportional controller
List of Symbols
-
-
- Permissible lower limit of DC-link voltage
-
-
- Permissible upper limit of DC-link voltage
-
- VDC
-
- DC-link voltage
-
- Pload
-
- Load power
-
- PPV−max
-
- Maximum PV power output
-
- SoCth
-
- Threshold SoC
-
- Crate
-
- Charging rate
-
-
- Maximum charging rate
-
- Ibat
-
- Battery current
-
- Qbat
-
- Battery capacity
-
- Pref
-
- PV reference power
-
- Vref
-
- Reference voltage
-
- Ibat−max
-
- Maximum battery current
-
- Ibat−min
-
- Minimum battery current
-
- Ibat−ref
-
- Reference battery current
-
- x(1), x(2), …, x(m)
-
- Data points
-
-
- Search space
-
- μ
-
- Mean of clusters
-
- N
-
- Number of data points
-
- k
-
- Number of clusters
-
- I
-
- Number of iterations
-
- d
-
- Number of attributes
-
-
- PV voltage at MPP
-
- Vin
-
- Converter input voltage
-
- Vout
-
- Converter output voltage
-
- LPV
-
- PV side inductor
-
- CPV
-
- PV side capacitor
-
- Lbat
-
- Battery side inductor
-
- CDC
-
- DC-link capacitor
Conflicts of Interest
The authors declare no conflicts of interest.
Funding
No funding was received for this research.
Open Research
Data Availability Statement
The data used in this study are available upon request.


