Multi-Microgrid Optimization With Electric Vehicle Mobile Energy Storage Considering Travel Characteristics
Abstract
To address the economic challenges posed by the integration of a large number of electric vehicles (EVs) into microgrids, while leveraging their mobile energy storage (MES) capabilities and accounting for the impact of EV users’ travel patterns on charging and discharging behaviors, a microgrid scheduling model is proposed that incorporates the MES characteristics of EVs under user travel habits. Firstly, based on the spatial and temporal characteristics of the EV travel chain, the upper and lower bounds of the state of charge (SOC) that EVs must maintain at specific moments during their driving process are determined. Secondly, a mathematical model of a microgrid operation incorporating EV mobile storage batteries, wind power, photovoltaic systems, stationary batteries, and micro-gas turbines is developed. This model considers the costs of electricity purchase and sale, wind and solar curtailment, and natural gas consumption, with the objective of minimizing the total operating cost. To validate the effectiveness of the proposed approach, the optimal scheduling model is implemented and solved using YALMIP and GUROBI. Simulation results demonstrate that the proposed model significantly reduces the total operating cost of the microgrid compared to traditional methods. It also improves the profitability of EV users to a certain extent, promoting new energy consumption when new energy resources are abundant.
1. Introduction
Under the “dual carbon” goal, fully leveraging the mobile energy storage (MES) capabilities of electric vehicles (EVs) is crucial for enhancing the flexibility of microgrids [1–3]. As large-scale MES devices, EVs possess significant potential for flexible scheduling. When effectively controlled in alignment with specific objectives and integrated into microgrid scheduling, they can substantially improve the economic performance of microgrids. Consequently, there is an urgent need for in-depth research on optimal scheduling methods for microgrids that incorporate EVs.
Currently, scholars have conducted various studies on the participation of EV MES in microgrid scheduling. The authors of [4] studied the impact of using EVs as MES on the energy cost and greenhouse gas emissions of commercial buildings, revealing the potential economic and environmental impacts of EVs. In [5], the authors analyzed the demand-side response potential of EV as MES according to the charging characteristics and proposed a dispatch operation model. In [6], the authors took into account the spatiotemporal energy transfer characteristics of MES and constructed a multiscenario, multiobjective dispatch model, which improves the consumption capacity of PV power generation and improves the voltage limitation problem. In [7], based on the different departure and arrival times of EVs, a clustering algorithm is proposed to set the boundaries of the parking time periods of clustered EVs, which takes full advantage of the EV’s MES characteristics and improves the performance of the multi-microgrid system. Based on the microgrid system, the authors in [8] integrated and analyzed different types of distributed generation with the utility grid to reduce its operating costs to a large extent. Mobile storage can provide various auxiliary services and the authors proposed a day-ahead energy management system for mobile storage that minimizes the cost of importing power from the grid in [9]. However, the load calculations for EV charging in the above studies are relatively simplistic or focus solely on the temporal distribution, failing to incorporate EV users’ travel habits into the forecasting process. This limitation reduces the accuracy of the load predictions.
Regarding the impact of EV orderly charging and discharging strategies on microgrids, in [10], in order to evaluate the effectiveness of vehicle-to-grid (V2G) scheduling results, this study systematically evaluates EV charging behaviors through a comprehensive assessment framework spanning five critical dimensions: renewable energy accommodation ratio, schedulable capacity, dispatch response efficiency, load stability, and economic benefits of dispatch operations. Based on the analysis of EV users′ travel patterns, distinct load forecasting models were developed for two operational scenarios: uncoordinated charging versus coordinated charging–discharging strategies. Furthermore, building upon prior research in [11], we propose an optimized microgrid energy dispatch model that strategically integrates EV charging–discharging protocols. This innovative framework achieves dual optimization objectives by simultaneously minimizing operational costs and environmental remediation expenditures, thereby addressing both economic efficiency and ecological sustainability imperatives. In [12], the authors made full use of distributed energy in microgrids, considered the satisfaction of EV users, and proposed a collaborative optimal scheduling method based on the participation of EVs in multiple microgrids and distribution grids. In [13], the authors formulated two charging and discharging strategies and established a load model respectively according to the characteristics of EVs and then included new energy sources in the economic scheduling model of microgrids by using the priority method for hierarchical subarea scheduling. And in [14], in order to be able to achieve the simultaneous suppression of load fluctuation and reduction of the operating cost of EVs, the authors have developed a multiobjective optimization model for V2G in distributed systems, and through validation, the results can balance the load fluctuation and the operating cost of EVs in distributed systems. The authors developed a multiobjective scheduling model containing multiple flexibility resources from distributed generation, battery storage, EV clusters, and VSC converters, controlled by an EV charging and discharging model, with the aim of minimizing the system operating costs and maximizing the flexibility adequacy in [15]. The state of charge (SOC) constraints during charging and discharging of EVs in the above literature are not accurate enough and little consideration is given to EV user requirements.
In response to the limitations of previous studies, this paper comprehensively considers the travel habits of EV users by integrating the EV travel chain to impose constraints on the charging and discharging domains of EVs. Additionally, the subjective preferences of EV users are incorporated to ensure that their desired SOC levels are met during participation in the scheduling process. The study divides the distribution network into three distinct regions, each with unique base load characteristics and EV charging and discharging power requirements. Corresponding constraints are established for these regions. A microgrid scheduling model is proposed with the objective of minimizing the total operating cost while leveraging the MES characteristics of EVs, tailored to align with the travel habits of EV users.
2. MES Capacity Domain of EV Based on Travel Chains
2.1. User Travel Chains
- 1.
The users’ initial and final travel locations are both in the H zone.
- 2.
The impact of other factors (e.g., route considerations between different functional areas) on EV charging is disregarded.
- 3.
The entire travel process is confined to the time range of 00:00–24:00.
Based on these assumptions, the spatial and temporal structure of the travel chain is depicted in Figure 1.

According to Figure 1, the whole traveling chain is divided into two parts: the external time chain and the internal space chain. In the internal space chain, d represents the driving mileage between the two destinations. In the external time chain, t represents the moment, which indicates the starting and ending moments of each section of the journey, respectively.
2.2. Time-Invariant Probability Distribution
2.2.1. The First Driving Start and Duration Moment
2.2.2. Duration of Stationing
2.3. Probability Distribution of Miles Traveled
In the above equation, Δti denotes the ith time window of traveling time; μi is the average value of mileage traveled under this time window; and σi is the standard deviation of mileage traveled under this time window.
Given the limited duration of single trips, it is assumed that the driving distance for a single trip does not exceed 130 km, and the corresponding driving time is primarily concentrated within 100 min. Considering the significant variation in the number of samples across different time periods, this paper discretizes the three types of driving times to enhance the accuracy of the fitted data. The statistical results of the fitting process are presented in Table 1.
| (min) | Class I traveling time | Class II traveling time | Class III traveling time | |||
|---|---|---|---|---|---|---|
| μi (km) | σi (km) | μi (km) | σi (km) | μi (km) | σi (km) | |
| (0,10) | 2.20 | 1.02 | 2.49 | 1.91 | 2.77 | 1.94 |
| [10,19] | 7.28 | 3.73 | 6.47 | 3.79 | 6.76 | 3.77 |
| [20,29] | 13.32 | 6.14 | 11.75 | 6.15 | 11.95 | 6.25 |
| [30,39] | 18.71 | 8.10 | 16.79 | 8.99 | 16.97 | 8.31 |
| [40,49] | 24.65 | 10.69 | 21.80 | 10.94 | 23.00 | 10.81 |
| [50,59] | 32.14 | 14.51 | 28.64 | 14.67 | 25.01 | 12.05 |
| [60,79] | 36.87 | 16.95 | 33.48 | 17.31 | 32.57 | 17.40 |
| [80,99] | 48.41 | 24.72 | 47.26 | 23.60 | 45.82 | 23.42 |
| [100,150] | 68.31 | 27.11 | 71.51 | 28.62 | 72.72 | 26.81 |
2.4. Space Transfer Probability
There are three main categories of travel trajectory chains involved, and the percentage of daily activity trips made by private vehicles was counted as shown in Table 2.
| Travel chain | Percentage (%) |
|---|---|
| H-W-H | 52.1 |
| H-O-H | 23.1 |
| H-W-O-H | 24.1 |
2.5. MES Capacity Domain Constraints of EVs
In the above equation, denotes the charging state of the nth EV at time t and SOCmax and SOCmin denote the upper and lower bounds of the range in which the SOC of the EV is located, respectively.
In the above equation, represents the SOC value that the EV needs to satisfy a moment before traveling to the next region, and represents the value selected by the EV owner before departure; represents the distance that the nth EV traveled to the next destination, and E100 represents the 100 km power consumption of the EV; Qn represents the rated capacity of the nth EV; and represents the SOC of the nth EV when it left the current region. Equation (12) shows the minimum value of SOC that an EV should satisfy before the occurrence of the ith leg of the journey, and equation (13) takes into account the battery life of the EV to avoid irreversible damage to the battery caused by excessive charging and discharging of the battery.
2.6. MES Capacity Domain Determination
- 1.
Determine the total number of EVs as N and number them 1, 2, 3, …n. Assume that the SOC at the departure moment of all EVs is 0.9, and start calculating from the first EV.
- 2.
Determine the situation of the traveling chain of the EVs.
- 3.
Extract the travel start time of the EVs, determine the duration of the first segment of the trip, and based on the trip duration, identify the first segment of the journey. Then, calculate the power consumption of the EV during the first leg of the journey.
- 4.
Extract the stopping time of the EV, calculate the time when it leaves the current location, and determine the next travel distance based on the travel chain.
- 5.
Calculate the SOC to be met by the EV, and continue to perform Step 4 until the end of the journey.
The specific steps are shown in Figure 2.

3. Economic Dispatch Models for Microgrids
3.1. Structural Models
3.1.1. Photovoltaic (PV) Power Generation
In the above equation, PPV(t) denotes the PV output force at time t; PSTC is the maximum output power under the STCs; GSTC denotes the light intensity under the STCs; and G(t) and T(t) denote the light intensity and surface temperature at the test time, respectively.
3.1.2. Wind Power
3.1.3. Storage Battery
3.1.4. EVs
The range conditions governing the charging state of the EV have been provided in Section 2.
3.2. Economic Dispatch Model
3.2.1. Objective Function
3.2.2. Condition
3.2.2.1. Microgrid Power Balance Constraints
3.2.2.2. Micro-Gas Turbine Constraints
3.2.2.3. Energy Storage Battery Constraints
In the above equation, , are the upper and lower limits of the charging and discharging power of the energy storage battery and , are the upper and lower limits of the SOC of the energy storage battery.
3.2.2.4. EV Constraints [18]
The range of SOC constraints for EVs has been outlined in Chapter 1. Additionally, the following constraints are also considered.
4. Calculus Analysis
4.1. Microgrid Data and Parameters
4.1.1. Wind Energy Output Curve
Using a 15 min time step, a 24 h period is selected as a cycle, divided into 96 segments. The following parameters are used: Prt = 200 kW, vrt = 3 m/s, vout = 25 m/s, c = 4.8, and k = 3.5. According to the formula in Section 2, the Monte Carlo method is used to predict the wind power output, and the results are shown in Figure 3.


4.1.2. PV Output Curve
Using the same method to predict the PV output, the first step is to obtain the variation in ambient temperature in the region over one cycle. Based on this, the final PV output curve is shown in Figure 4.

4.1.3. Load Curves
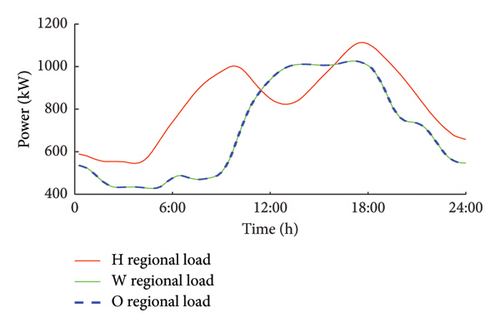
The daily load curves vary across different areas. In residential areas, where there are a higher number of users during the night, the load tends to be higher. In contrast, the load decreases in the other two areas due to off-duty periods and breaks. A set of data curves illustrating these variations is presented in Figure 5.
4.1.4. Price and Operating Parameters
Price and operating parameters are shown in Tables 3 and 4, respectively, where the unit of the price parameters is in Chinese Yuan (CHN).
| Time | Period | Electricity purchasing price (CHN) | Electricity selling price (CHN) | Abandoned WT and PV power prices (CHN) | Natural gas purchasing price (CHN) |
|---|---|---|---|---|---|
|
Peak | 1.18 | 1 | 0.5 | 2.9 |
|
Plain | 0.68 | 0.55 | 0.2 | 2.9 |
| 1:00–7:00 | Valley | 0.35 | 0.28 | 0.1 | 2.9 |
| Parameter | Value |
|---|---|
| SOCmax/SOCmin | 0.9/0.2 |
| /// | 0.9/0.9 |
| / (kW) | 5/5 |
| N | 100 |
| γ1/γ2/γ3 | 0.075/0.4/0.417 |
| / (kW) | 45 |
| θBA | 0.0018 |
| LHV (kW/m3) | 10.1 |
| Q (kWh) | 30 |
| E100 (kWh) | 15 |
| E (kWh) | 250 |
| / (kW) | 65/0 |
| r (kW/h) | 20 |
| τ/ρ | 65/0.1 |
| θMT | 0.0648 |
| / | 0.95/0.2 |
From the table, it can be seen that 11:00–15:00 and 19:00–21:00 belong to the load peak hours, 1:00–7:00 belongs to the load valley hours, and the rest of the time belongs to the load flat hours.
4.2. Analysis of Simulation Results
4.2.1. Results of the Proposed Model
Figure 6 illustrates the variation in SOC for a single EV across the three travel chains, along with the corresponding charging and discharging data.
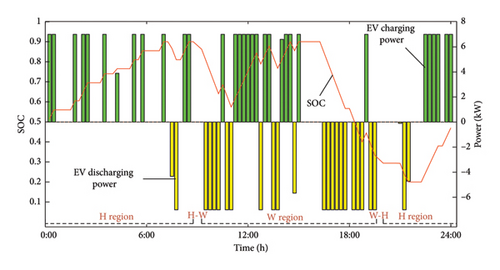
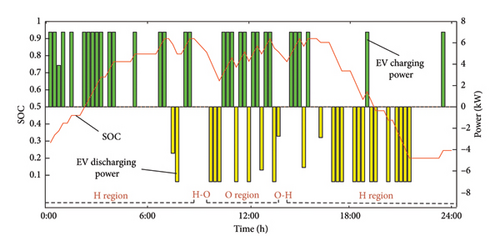
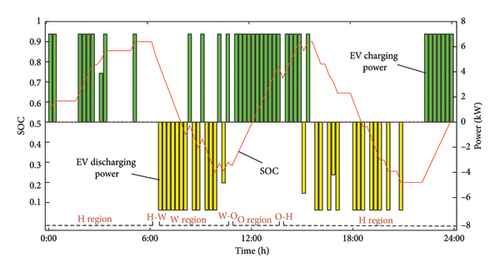
Figure 6 selects three categories based on the travel chain status from 100 EVs participating in the dispatch, showing their respective charging and discharging states as well as SOC trends. It can be observed that the three types of EVs charge and discharge during roughly the same time periods. A notable feature is that the EVs predominantly charge during the nighttime (the load trough period) and discharge during the two load peaks to help alleviate the pressure on the power grid.
Figure 7 presents the charging and discharging patterns of 100 EVs over the course of a day in different regions: W, H, and O.
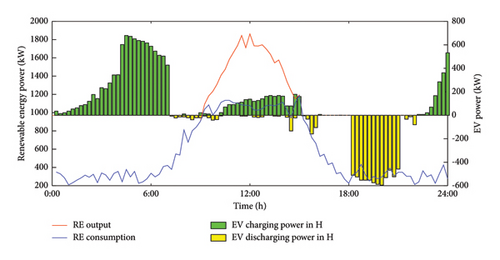
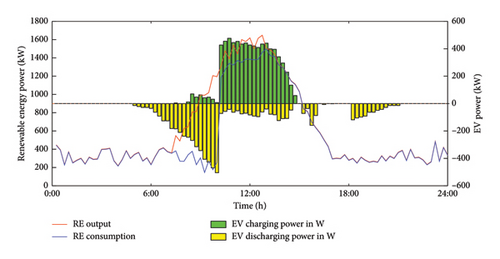
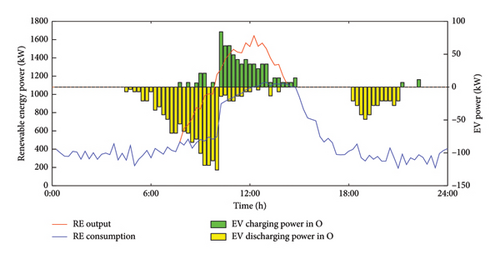
Based on the travel chain state of each EV, their charging and discharging power in each region is accumulated to produce Figure 7. Due to variations in the locations and times of travel stops, the EVs initially remain in the H region from early morning until departure, where the electricity price is low, and charge to meet their driving requirements. After departure, depending on the type of travel chain, the EVs either stay in the W region or the O region. In these regions, the charging and discharging behavior is adjusted according to the electricity price, ensuring that the EVs can satisfy the requirements for subsequent trips while optimizing their charging and discharging behavior. And we found that between 10:00 and 14:00, the new energy output value reaches the peak of the day, and at the same time, the EV charging power also increases, which can achieve the new energy consumption to a greater extent.
4.2.2. Comparative Results and Analysis
To verify the economic performance of the method proposed in this paper, economic data under two alternative scenarios are provided for comparison.
Scenario 1: It is assumed that EV users must charge when they arrive in the H region until they meet their travel requirements. Additionally, only 30% of the users who arrive at non-H regions opt to charge.
Scenario 2: In this scenario, EV users make charging decisions based solely on their own interests, choosing charging times that minimize their own costs, while ensuring they meet the necessary travel requirements.
Scenario 3: This scenario involves the EVs participating in V2G charging and discharging scheduling as proposed in this paper.
The total operating cost of the microgrid, the charging cost of EVs, and the consumption of new energy under the three scenarios are shown in Table 5.
| Term | Total operating costs of microgrids (CHN) | Charging costs for EV users (CHN) | New energy consumption (kWh) |
|---|---|---|---|
| Scenario 1 | 62,549 | 1682.9 | 36,495 |
| Scenario 2 | 62,415.7 | 664.4761 | 36,316 |
| Scenario 3 | 41,029 | −486.78 | 46,170 |
Based on the above calculations, it can be seen that in Scenario 1 and Scenario 3 (neither EV participates in V2G scheduling), the amount of RE consumption is lower than the point in Scenario 3. At the same time, Scenario 2 carries out orderly charging, which effectively reduces the cost of charging and discharging for the EV user. And there is a negative cost in Scenario 3, which shows that the gain achieved in the process of EV participation in the V2G scheduling process can help to promote the participation of the EV in the scheduling plan. On the total cost of grid operation, the method proposed in this paper makes full use of the MES characteristics of EVs, and the cost is reduced by 34.4% compared with the other two scenarios.
5. Conclusion
- 1.
Based on data on EV users’ travel patterns, the locations and durations of EV stopping times throughout the day are calculated. By considering user preferences and the battery’s upper and lower limits, the regional SOC ranges that EVs must satisfy at different times of the day are determined.
- 2.
Under a time-of-use tariff framework, leveraging the MES characteristics of EVs, a V2G scheduling model is developed with the goal of minimizing microgrid operating costs. The simulation example demonstrates that the charging and discharging behaviors of EVs across different travel chains are similar: EVs discharge during periods of high tariffs and loads to alleviate grid pressure and charge during periods of low tariffs and loads to reduce operating costs.
- 3.
The comparison of different scenarios demonstrates that the proposed scheduling model effectively promotes RE consumption. The consumption rate is increased by more than 26.5% compared to the other scenarios. Additionally, through the value attributes of MES, users can realize tangible benefits even when their EVs are expected to charge and consume energy, thereby enhancing user willingness to participate in V2G scheduling.
Conflicts of Interest
The authors declare no conflicts of interest.
Funding
This research was supported by the Science and Technology Project of State Grid Jibei Integrated Energy Service Co., Ltd., Grant/Award Number: SGJBZN00AJJS2400078.
Acknowledgments
This research was supported by the Science and Technology Project of State Grid Jibei Integrated Energy Service Co., Ltd. (SGJBZN00AJJS2400078).
Open Research
Data Availability Statement
The data that support the findings of this study are available from the corresponding author, upon reasonable request.


