Multiobjective Optimization of Photovoltaic–Thermal Collectors Using Nanofluids: Integrating Taguchi Method and Genetic Algorithm
Abstract
Photovoltaic (PV) systems suffer from significant efficiency losses due to temperature rise during operation, while existing cooling solutions often require excessive pumping power (PP) that reduces the net system output. Traditional optimization approaches have typically focused on either thermal efficiency or PP independently, creating a critical gap in achieving optimal overall system performance. This study presents an innovative optimization framework that uniquely combines the Taguchi method with a multigenetic algorithm to simultaneously maximize thermal efficiency and minimize PP in PV–thermal (PVT) collectors using nanofluids—a combination not previously explored in the literature. In this research, a standard flat plate collector, including copper circular cooling tubes, is attached to the backside of the PV panel. The present study focuses on developing a three-dimensional (3-D) solar PVT collector using copper oxide (CuO) nanofluid. Influential parameters such as fluid flow rate, inlet temperature, nanofluid volume fraction, number of tubes, and tube diameter were investigated. The effects of the parameters on thermal efficiency and PP were studied with an experimental design using the Taguchi method. Optimal results based on a multigenetic algorithm show that the optimal model leads to an increase in cooling efficiency of about 80% and an 86% reduction in PP compared to the initial state. Moreover, the most significant effect on cooling efficiency is related to volumetric flow rate and tube diameter. Compared to the initial state, the result of single objective optimization indicated that the pressure drop reduces and the efficiency increases by about 98% and about 140%, respectively.
1. Introduction
Recent research has explored improved photovoltaic (PV) systems for converting solar energy. Nevertheless, when the temperature of solar cells rises, there is a noticeable decline in the electrical efficiency of PV modules [1]. Recent research has explored different cooling techniques to mitigate cell temperature and enhance efficiency. In this context, a PV/thermal (PV/T) system is suggested to decrease the thermal stress of the PV panel by removing heat and making it useful at high PV module temperatures. Recent active and passive methods are jet impingement, airflow cooling, immersion cooling using liquids, thermoelectric-based cooling, microchannel cooling, phase change materials (PCMs) based cooling, water/liquid cooling, and heat pipe cooling [2].
Additionally, some researchers have combined these methods to enhance heat transfer and system performance. A new PV–thermal (PVT) system design featuring ribs, petal arrays, and coiled twisted tapes with SiC-enhanced nanofluids and PCMs [3–5]. They recorded the highest thermal efficiency and total exergy efficiency. Ahmed et al. [5] conducted a study focusing on the 4E analysis—energy, exergy, entropy, and economics. The system achieved energy and exergy efficiencies of 97.34% and 11.86%, respectively. The most cost-effective configuration was identified as using 1% nano-PCM (NPCM) and 0.6% nanofluid.
Air-cooled systems were used in conventional PV cooling systems, showing superior unit cost and reliability [6]. The study conducted by Bambrook and Sproul [7] focused on investigating the impact of airflow rate on the overall energy production of a PVT air system. The findings revealed that an augmentation in the airflow rate resulted in a notable enhancement in the system’s electrical and thermal efficiency. Ömer and Zala [8] conducted a thermodynamic analysis on a PVT system with air cooling. The authors elucidated that augmenting the airflow rate increased electrical and thermal efficiency. The evaluation conducted by Özakın and Kaya [9] examined the effects of using fins composed of various materials and configurations on the electrical, thermal, and exergy efficiency of PVT systems. The trials have demonstrated that the parameters with the most significant influence were fin material, air velocity, and panel temperature. Using air as a cooling medium for PVT systems yields a system characterized by enhanced safety, simplicity, and reduced cost [10]. Nevertheless, air’s specific heat and thermal conductivity are comparatively lower than liquids such as water.
Water, with its high specific heat value, can absorb about four times as much heat as air; for this reason, many researchers used water as a coolant in a PVT system to increase both thermal and electrical efficiencies [11, 12].
Despite the tremendous thermal capacity of water and other fluids, their thermal conductivity is relatively modest. Consequently, a restricted level of thermal energy transfer occurs between the solar cell and the fluid medium. Numerous scholars have proposed using nanoparticles by their incorporation into the base fluid, resulting in a suspension characterized by enhanced thermal conductivity. Many groups studied various factors of nanofluids, including the types of nanoparticles employed and the characteristics of the base fluid [13]. Margoum et al. [14], using a finite difference numerical model, investigated the effect of various nanofluid types, volume fractions, and mass flow rates on the performance of a PVT hybrid collector. Two different analyses have been performed in the first group. Silver, copper, and iron nanoparticles are dispersed in water. At the same time, in the second group, ethylene glycol (EG) and thermal oil (THO) are used as base fluids, where nanoparticles of silver are dispersed. Finally, their results showed that the best results can be reached by using the silver/water with a 2.0% volume fraction and mass flow rate of 3.0 × 10⁻³ kg/s.
The impacts of incorporating nanofluid into the performance of the PVT system were assessed using Khanjari, Pourfayaz, and Kasaeian [15]. The researchers employed Ag–water and alumina–water as nanofluids. The researchers analyzed and examined the effects of different levels of nanoparticle volumetric concentration and intake fluid velocity on both efficiency and heat transfer enhancement. The researchers concluded that increasing the volume percentage of nanoparticles leads to improved efficiency and heat transfer coefficient. The study conducted by Sardarabadi and Passandideh-Fard [16] involved the experimental and numerical investigation of metal nanoparticles, specifically aluminum oxide (Al2O3), TiO2, and ZnO, distributed in deionized water. These nanoparticles were utilized as a coolant for PVT systems. The study’s findings indicate that the TiO2/water and ZnO/water nanofluids exhibit superior electrical efficiency compared to the Al2O3/water nanofluid. The thermal performance of a solar collector was numerically simulated using Bonab and Javani [17], whereby, the impact of three nanofluids, namely, copper oxide (CuO), Al2O3, and carbon nanotubes, was investigated. The findings of their study indicate that carbon nanotubes have superior heat transmission characteristics compared to other types of nanoparticles.
Ibrahim et al. [18] evaluated the thermal and electrical performance of PVT and presented the temperature distribution with water and nanofluid. The results showed that cooling PVT panels with water and nanofluid decreased the PV module temperature by about 22.83%. Dehaj and Mohiabadi [19] experimentally examined the performance of heat pipe solar collectors utilizing MgO nanofluids. The researchers concluded that the system’s efficiency is more remarkable when using MgO nanofluid than pure water. In the study by Tong et al. [20], several nanofluids, such as water and nanoparticles of Al2O3, CuO, MWCNT, and Fe3O4, were employed for experimentation on a flat plate solar collector. The performance exhibited an upward trend with the rise in nanofluid concentration across all nanofluids. Aneli et al. [21] analyzed the effect of using water and Al2O3 nanofluid on the performance of the PVT system. Additionally, researchers suggested that future studies should evaluate and optimize all the operative parameters (e.g., the mass flow rate and the specific volume of the thermal storage) for a further improvement of the performance of the PVT system.
Several researchers employed statistical methods to analyze the interaction of key parameters in the cooling of PVT systems. Additionally, some researchers enhanced the efficiency of the panels by optimizing these critical parameters. Rejeb et al. [22] investigated using water and ZnO nanofluid in a solar PVT system, employing statistical analysis. A correlation was established to establish a relationship between the efficiency of the solar collector and the operating parameters. The investigation encompassed several factors, namely, the thermal transfer coefficient, mass flow rate, concentration of nanoparticles, and tube numbers.
Numerous researchers have focused on optimizing the performance of various functions within the PVT system, utilizing both single-objective and multiobjective optimization methodologies. The exergy efficiency of a flat-plate solar collector containing Al2O3–water nanofluid was optimized by Shojaeizadeh, Veysi, and Kamandi [23]. The researchers investigated the effects of several fluid parameters, including mass flow rate, nanoparticle volume percentage, intake temperature, solar radiation, and ambient temperature, on the collector’s exergy efficiency. Results indicate that suspending Al2O3 nanoparticles in the base fluid enhances the collector’s exergy efficiency by about 1%. The performance of PVT was enhanced by utilizing a genetic algorithm using Khani, Baneshi, and Eslami [24]. The optimization problem involved determining the choice factors, which included the number of tubes, tube spacing and diameter, and fluid mass flow rate. Their study revealed that the optimized system’s annual electrical efficiency is 25% higher than that of a standard PV module lacking cooling. Moghaddam and Karami [25] investigated the effect of artificial roughness in the collector flow channel of a PVT system. Using a genetic algorithm, the researchers optimized the thermohydraulic performance by varying roughness characteristics, working fluid type, and Reynolds number. Results showed that artificial roughness enhances performance in turbulent flow, but deteriorates it in laminar flow. The best performance was achieved with a roughness angle of 30°, a relative height of 0.04, and a relative pitch of 16.
Additionally, using nanofluids like Ag–MgO and CNT improved overall system efficiency. Hsu et al. [26] present a novel approach to optimizing a PVT system combined with a solar thermal collector. The researchers integrated response surface methodology (RSM), a multiobjective bat algorithm, and the VIKOR decision-making method to enhance system performance. The optimization focused on maximizing energy efficiency and electric efficiency. Results demonstrated significant improvements in thermal and electrical efficiency and overall system performance. The combined approach proved effective in achieving a balanced and optimized PVT system.
Ben Seddik et al. [27] optimized a PVT system in various Moroccan climatic zones using a hybrid approach of the Taguchi method and genetic algorithm. The researchers developed and validated a mathematical model to predict the thermal and electrical performance of the PVT system. The Taguchi method identified the most influential parameters and the genetic algorithm optimized these parameters for different climate zones. Results showed that the optimized PVT system produced higher energy output and reduced CO2 emissions than the unoptimized system. The annual energy gain varied from 15.5% to 19%, depending on the climate. Madas, Narayanan, and Gudimetla [28] optimized the PVT system performance using CuO nanofluid. They employed RSM for both single- and multiobjective optimization. The objectives were to maximize thermal and electrical efficiency while minimizing pressure drop. Results indicated that CuO nanofluid significantly enhances system performance. The optimized conditions achieved a balanced improvement in overall efficiency and operational stability.
Several researchers have employed the Taguchi method or RSM to optimize parameters that enhance the efficiency of solar panels [22]. While some have focused on single-objective optimization [23], others have explored multiobjective optimization. The majority of studies have concentrated on optimizing thermal and electrical efficiency [24–30], with a few also examining exergy efficiency [23]. Additionally, a limited number of researchers have investigated the optimization of pumping power (PP) [25].
According to Table 1, most researchers prioritize efficiency as the objective function. However, the importance of pump power cannot be ignored, as achieving the highest efficiency with the lowest pump power is crucial. Fewer researchers have focused on pump power as the objective function. Some researchers have set parameters outside the designer’s control, while a limited number have focused on validating practical and flexible parameters. This approach allows them to achieve the desired target performance by tuning these parameters. As shown in the table, only a few researchers have integrated optimization with statistical methods.
| Authors | Solution method | Optimization method | Targets |
|---|---|---|---|
| Hajabdollahi and Hajabdollahi [31] | Theoretical | MOPSO | Total annual cost (TAC), collector efficiency |
| Shojaeizadeh, Veysi, and Kamandi [23] | Theoretical | Means of interior point method | Exergy efficiency |
| Ghasempour, Salehi, and Fakouriyan [32] | Theoretical | MOPSO, NSGAII | Exergy efficiency, energy efficiency |
| Aggour et al. [29] | Theoretical | Meta-heuristic algorithms | Electrical and thermal efficiencies |
| Moghaddam and Karami [25] | CFD | NSGAII + RSM | Electrical performance, thermal performance, thermohydraulic performance |
| Hsu et al. [26] | Theoretical | MOPSO | Electrical and thermal power |
| Madas, Narayanan, and Gudimetla [28] | Experimental | RSM | Electrical efficiency, thermal efficiency, overall energy efficiency, overall exergy efficiency, and power consumption |
| Satpute et al. [30] | Experimental | Taguchi optimization | Electrical and thermal efficiencies |
| Seddik et al. [27] | Theoretical | Taguchi method and genetic algorithm | Electrical and thermal efficiencies |
| Khani, Baneshi, and Eslami [24] | CFD | Biobjective optimization | Electrical and thermal efficiencies |
| Ahmed et al. [33] | Experimental | Thermohydraulic performance factor (THPF) optimization | Friction Factor and Nusselt number |
In this research, nanofluid is used as a coolant. From three perspectives of the work’s innovation, it can be stated that first, the objective functions that researchers have less frequently focused on were the efficiency and power of the pump simultaneously. Second, the geometric and flow parameters such as fluid flow rate, inlet temperature, nanofluid volume fraction, number of tubes, and tube diameters were selected in a practical manner that allows for designer modification. Third, researchers have explored the coupling of the Taguchi method and the genetic algorithm less. The primary objective of this study is to optimize the thermal and electrical performance of a PVT collector using CuO nanofluid as a coolant, employing a novel combination of the Taguchi method and Nondominated sorting genetic algorithm (NSGA-II) genetic algorithm to achieve maximum efficiency with minimal PP.
The effective parameters were modeled and experimental designs were created using the Taguchi method. Subsequently, numerical analysis was conducted on the presented instances and the target parameters were retrieved. Subsequently, the analysis of variance (ANOVA) is employed to identify the most significant components. The signal-to-noise ratio (SNR) is also utilized to evaluate the maximum thermal performance and minimal PP. Applying the artificial neuro-inference system (ANFIS) technique will ultimately establish a graphical representation that depicts the relationship between crucial variables and resulting outcomes and concludes with optimization steps. Figure 1 provides a comprehensive depiction of the procedural framework of this study, which is divided into eight distinct components.

2. System Description
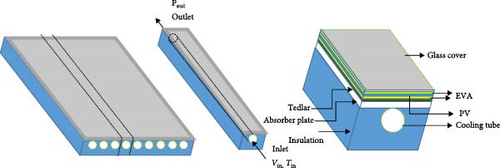
The PVT collector comprises a solar module positioned on the upper surface to harness electrical energy, while a lower absorber plate equipped with cooling tubes facilitates thermal energy extraction.
The PV panel with dimensions of 1956 mm × 992 mm, which has a 380 W power output and a 12 × 6 cell configuration, is safeguarded from moisture, dust, and mechanical harm while also offering electrical insulation and stability by a glass cover, two layers of ethylene-vinyl acetate (EVA), and a layer of Tedlar. The aluminum absorber plate is positioned below the Tedlar layer and a standard flat plate collector, including copper circular cooling tubes, is affixed to its posterior side by welding. The lower section of the collector is well insulated using rock wool, while the entirety of the PVT collector is encompassed inside an aluminum frame. The thermal energy of the PV module is extracted by circulating nanofluid with varying concentrations and temperatures via the cooling tubes. Figure 2 shows the geometric configuration of the numerical model. The thermophysical properties of the different layers in a PVT collector are outlined in Table 2.
| Material | Thickness (mm) | Thermal conductivity (W/m2 K) | Density (kg/m3) | Specific heat capacity (J/kg K) | Transmissivity | Absorptivity | Emissivity |
|---|---|---|---|---|---|---|---|
| Glass | 3.2 | 1 | 3000 | 500 | 0.93 | 0.04 | 0.93 |
| EVA (top) | 0.5 | 0.4 | 960 | 2100 | 0.92 | 0.08 | — |
| PV | 2 | 148 | 2330 | 680 | 0.002 | 0.88 | 0.12 |
| EVA (bottom) | 0.5 | 0.4 | 960 | 2100 | 0.92 | 0.08 | — |
| Tedlar | 0.33 | 0.4 | 1200 | 1250 | — | — | — |
| Absorber plate | 4 | 204 | 2700 | 900 | — | — | — |
| Cooling tube | 1 | 390 | 8900 | 390 | — | — | — |
| Water | — | 0.63 | 998 | 4183 | — | — | — |
| Insulation | 50 | 0.05 | 180 | 1500 | — | — | — |
| Cuo | — | 20 | 6500 | 533 | — | — | — |
3. Methods of Model
3.1. Numerical Method and Validation
The steady-state temperature field inside the PVT module layers and velocity and temperature distribution in cooling tubes are simulated based on the CFD methodology. Only one cooling tube and corresponding layers are simulated to reduce computational cost. So, the computational domain consists of a glass cover, two EVA layers with PV cells between them, a Tedlar layer, an absorber plate and corresponding tube, and finally, a rock wool insulation layer, respectively.
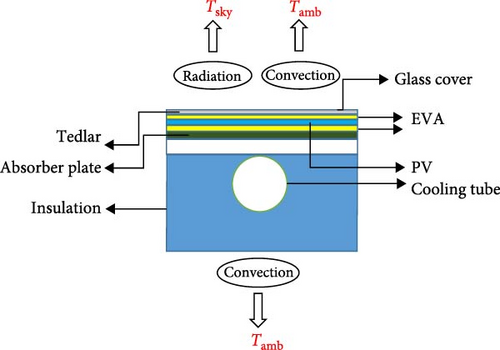
Conduction is the primary route of heat transport within PVT layers (Equation (4)). The energy equation adequately encompasses the underlying physics of the situation. Convection and radiation are the mechanisms by which heat is dispersed on the top (glass cover) and bottom boundary surfaces (insulation layer or aluminum layer). The heat transmission in these areas is contingent upon factors such as wind velocity, ambient temperature, and sky temperature.
The calculation of the wind convection coefficient is performed utilizing the correlation put forward by McAdams [35]. Furthermore, because of the limited extent of temperature fluctuations, it is believed that the thermophysical characteristics remain constant and unaffected by changes in temperature. The summary of the boundary condition is illustrated in Figure 3.
Within the realm of single-phase fluid flow, the equations regulating mass, momentum, and energy (specifically, Equations 5–7) are interconnected, necessitating the simultaneous solution of these nonlinear equations to represent the underlying physics of the situation accurately. In this study, the nanofluid flow is considered incompressible and laminar. The cooling tube has a velocity inlet and a pressure outlet boundary condition at its respective inlet and outlet points (Table 3).
| Inlet | Outlet | Solid–fluid interface |
|---|---|---|
| P = P0(static pressure) | ux = 0uy = 0uz = 0 | |
| T = Tin | — | |
The calculation of the internal heat source term () in the energy equations of the glass cover, top EVA, and the solar cell is determined by solving Equations (12)–(14) [38]. The transmissivity of the solar cell is zero. Consequently, the underlying layers do not exhibit any thermal generation.
The efficiency of solar cells and the internal heat source term within the PV layer are contingent upon the temperature of the PV layer. Hence, an iterative approach is employed in this study. The initial hypothesis posits that the efficiency of solar cells is 20%. Consequently, the governing equations are utilized to ascertain the temperature of the PV layer. Adjustments were made to the efficiency of the solar cell and the internal heat source component in Equation (9), following the temperature of the newly introduced PV layer. Subsequently, the calculations were iteratively repeated until the process achieved convergence. The convergence threshold is a temperature difference of less than 10−3.
To facilitate the numerical simulations, the following assumptions are established:
The fluid flow is expected to exhibit laminar characteristics, be developed entirely, possess homogeneous properties, and maintain incompressibility. The dimensions of the PV panel remain unchanged. Negligible contact resistance is a significant factor when evaluating the interactions between different layers inside systems. Nanofluids are purported to have characteristics of homogeneity and isotropy. The PV cells are often thought to generate solar radiation homogeneously.
Experimental data on various cases of solar radiation and fluid flow rates have been used to report the output temperature of the collector. Sakellarioua and Axaopoulos [39] utilized a 235-W solar panel with a cross-sectional area of 1.65 m2. Detailed specifications of the Sakellarioua and Axaopoulos [39] study are provided in the accompanying Table 4 [39].
| Parameter | Value |
|---|---|
| PVT total area (m2) | 1.65 |
| PVT absorber plate area (m2) | 1.58 |
| Packing factor (–) | 0.9 |
| Electrical data | |
| Cell type | p-Si |
| PVT peak power (We) | 235 |
| Nominal electrical efficiency (%) | 14.3 |
| Temperature Power coefficient (K−1) | −0.0046 |
| Thermal data | |
| Number of raisers | 8 |
| Peach between raisers (m) | 0.12 |
| External raisers diameter D (m) | 0.008 |
| Internal raisers diameter Di (m) | 0.006 |
| Absorber aluminum sheet thickness δ (m) | 0.0005 |
| Backside thermal insulation thickness (glass–wool; m) | 0.03 |
| Backside thermal insulation conductivity λ (glass–wool; W/mK) | 0.04 |
The numerical simulation in this study has been validated with results made by Sakellarioua and Axaopoulos [39]. The radiation, wind speed, and ambient temperature are known at different times. As Figure 4 shows, it is observed that there is a good concordance between the experimental graphic and the simulated one, with a max relative error of 4%.
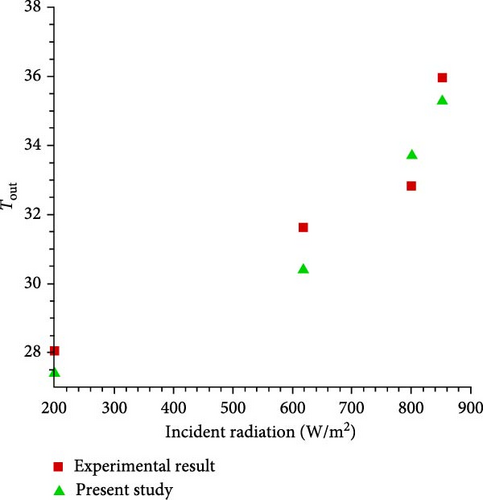
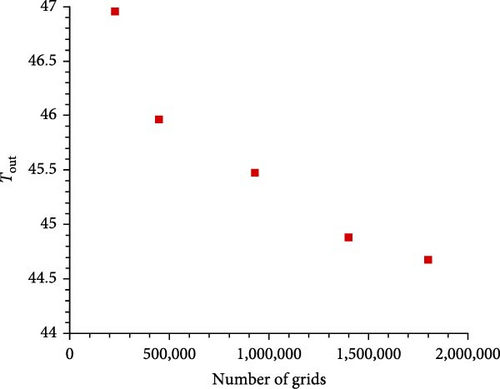
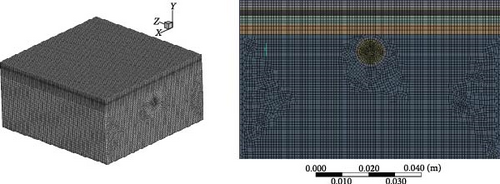
Figure 5 shows the variation of the outlet temperature with respect to the number of computational grid cells. The outlet temperature results for five different grid sizes—225,000, 450,000, 930,000, 1,400,000, and 1,800,000—are presented in the figure. As observed, the temperature difference between the 1,400,000-grid and 1,800,000-grid cases is less than 0.5°C. Given this minimal variation and to optimize computational efficiency, the grid with 1,400,000 cells was selected for the numerical analysis, ensuring a balance between accuracy and computational cost. The computational domain must be discretized using a meshing technique to conduct a CFD simulation. A mapped three-dimensional (3-D) mesh is created. Figure 6 shows a 3-D view of the CFD simulation mesh. The meshing process for the entire domain generated 1,480,000 elements.
3.2. Taguchi Method
The Taguchi method is well recognized and reliable in its application for the characterization, design, and optimization of performance [40–45]. The Taguchi experimental design approach has several advantages: its straightforward concept, user-friendly nature, and capacity to minimize variation. These benefits enable researchers to conduct experiments with fewer trial-and-error iterations [46, 47].
The Taguchi technique posits that SNR alterations yield ideal conditions. With this methodology, the experimental parameters are partitioned into control and noise variables. While noise variables impact the design process’s response, they cannot be utilized to determine the optimal settings due to their lack of controllability. Instead, control factors are utilized within the design process to achieve optimal sensitivity.
The approach being offered encompasses a sequential process comprising seven distinct steps. The stages involved in this process include the following activities: delineating the precise functions that are to be optimized, identifying the control variables and their respective levels, choosing the SNR, establishing the critical parameters that contribute to optimal conditions and finally, executing a validation procedure for the proposed trials. The present study employed five factors as control variables. The configuration of all parameters is set to include five levels, leading to a total of 3125 preferred experiments. The comprehensive information on the components and their associated levels is presented in Table 5. The Taguchi technique’s value proposition entails utilizing an orthogonal table of 25 trials, commonly called L25. Table 6 presents the ultimate experimental design derived from implementing the Taguchi approach. Each row in the table corresponds to the number of tests conducted using the Taguchi technique.
| Factors | Levels | ||||
|---|---|---|---|---|---|
| 1 | 2 | 3 | 4 | 5 | |
| A | |||||
| Tube number | 2 | 4 | 8 | 10 | 12 |
| B | |||||
| Diameter (mm) | 10 | 12 | 15 | 19 | 22 |
| C | |||||
| Flow (Lph) | 5 | 10 | 40 | 80 | 120 |
| D | |||||
| Nanomaterial (%) | 0 | 1 | 3 | 5 | 7 |
| E | |||||
| Temperature (°C) | 20 | 22 | 25 | 30 | 35 |
| No. | Tube number | Diameter (mm) | Flow (Lph) | Nanomaterial (%) | Temperature (c) | Effective thermal | SNR | Delta P | SNR |
|---|---|---|---|---|---|---|---|---|---|
| 1 | 2 | 10 | 5 | 0 | 20 | 6.38 | 16.1 | 5.05 | −14.06 |
| 2 | 2 | 12 | 10 | 1 | 22 | 7.64 | 17.66 | 4.72 | −13.47 |
| 3 | 2 | 15 | 40 | 3 | 25 | 10.84 | 20.70 | 7.57 | −17.58 |
| 4 | 2 | 19 | 80 | 5 | 30 | 13 | 22.27 | 5.86 | −15.35 |
| 5 | 2 | 22 | 120 | 7 | 35 | 15.18 | 23.62 | 4.87 | −13.75 |
| 6 | 4 | 10 | 10 | 3 | 30 | 12.01 | 21.59 | 4.48 | −13.02 |
| 7 | 4 | 12 | 40 | 5 | 35 | 16.59 | 24.4 | 8.38 | −18.46 |
| 8 | 4 | 15 | 80 | 7 | 20 | 26.46 | 28.45 | 6.68 | −16.49 |
| 9 | 4 | 19 | 120 | 0 | 22 | 26.46 | 28.45 | 5.2 | −14.32 |
| 10 | 4 | 22 | 5 | 1 | 25 | 12.44 | 21.89 | 0.1 | 20 |
| 11 | 8 | 10 | 40 | 7 | 22 | 36.68 | 31.28 | 8.1 | −18.16 |
| 12 | 8 | 12 | 80 | 0 | 25 | 28.88 | 29.21 | 10.1 | −20.08 |
| 13 | 8 | 15 | 120 | 1 | 30 | 31.83 | 30.05 | 6.05 | −15.63 |
| 14 | 8 | 19 | 5 | 3 | 35 | 13.48 | 22.59 | 0.086 | 21.31 |
| 15 | 8 | 22 | 10 | 5 | 20 | 27.12 | 28.66 | 0.09 | 20.91 |
| 16 | 10 | 10 | 80 | 1 | 35 | 32.27 | 30.17 | 13.7 | −22.73 |
| 17 | 10 | 12 | 120 | 3 | 20 | 41.79 | 32.42 | 10.7 | −20.58 |
| 18 | 10 | 15 | 5 | 5 | 22 | 17.29 | 24.75 | 0.167 | 15.54 |
| 19 | 10 | 19 | 10 | 7 | 25 | 20.19 | 26.10 | 0.123 | 18.20 |
| 20 | 10 | 22 | 40 | 0 | 30 | 29.48 | 29.39 | 0.35 | 9.11 |
| 21 | 12 | 10 | 120 | 5 | 25 | 43.87 | 32.84 | 17.37 | −24.79 |
| 22 | 12 | 12 | 5 | 7 | 30 | 16.39 | 24.29 | 0.322 | 9.84 |
| 23 | 12 | 15 | 10 | 0 | 35 | 12.64 | 22.039 | 0.334 | 9.52 |
| 24 | 12 | 19 | 40 | 1 | 20 | 38.12 | 31.62 | 0.5 | 6.02 |
| 25 | 12 | 22 | 80 | 3 | 22 | 45.5 | 33.16 | 0.522 | 5.64 |
In this section, we pinpoint the primary factors through ANOVA and establish the optimal levels for fine-tuning each output by utilizing the SNR [48]. The Taguchi approach utilizes the SNR as a crucial element of the loss function (LOF), which assesses the mistake in achieving the desired objective. The SNR serves as a measure to determine the influence of individual noise components on the overall performance of a system. For example, factors exhibiting a greater SNR would provide a more resilient product to noise. Depending on the experimental objectives, researchers may opt for distinct criteria, such as “smaller is better” (SB), “nominal is better” (NB), or “larger is better” (LB) when evaluating the SNRs.
To determine the SNR value for the ith factor at the kth level, where i and j indices denote the ith factor and jth experiment, respectively, it is necessary to compute the average of the SNR values for the corresponding rows at the kth level (k = 1:5). Higher values of SNR suggest that the parameters are operating at their ideal levels. The SNR values of the controller variables about efficiency are presented in Table 7 and Figure 6.
| Level | A | B | C | D | E |
|---|---|---|---|---|---|
| 1 | 20.08 | 26.4 | 21.93 | 25.04 | 27.45 |
| 2 | 24.96 | 25.6 | 23.21 | 26.28 | 27.07 |
| 3 | 28.36 | 25.2 | 27.48 | 26.09 | 26.15 |
| 4 | 28.57 | 26.21 | 28.66 | 26.59 | 25.52 |
| 5 | 28.79 | 27.35 | 29.48 | 26.75 | 24.57 |
| Delta | 8.72 | 2.15 | 7.55 | 1.71 | 2.89 |
| Rank | 1 | 4 | 2 | 5 | 3 |
Table 8 and Figure 7 show SNR values of the controller factors regarding the pressure drop.
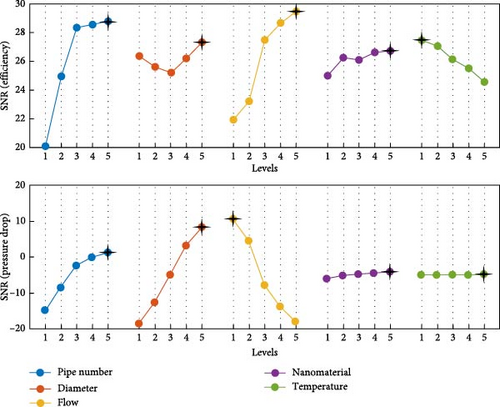
| Level | A | B | C | D | E |
|---|---|---|---|---|---|
| 1 | −14.847 | −18.5583 | 10.5266 | −5.9657 | −4.8427 |
| 2 | −8.4612 | −12.555 | 4.4275 | −5.1656 | −4.9553 |
| 3 | −2.3332 | −4.9284 | −7.8155 | −4.8477 | −4.8525 |
| 4 | −0.0912 | 3.1709 | −13.8055 | −4.4316 | −5.0114 |
| 5 | 1.2478 | 8.386 | −17.8179 | −4.0742 | −4.823 |
| Delta | 16.0949 | 26.9443 | 28.3444 | 1.8915 | 0.1885 |
| Rank | 3 | 2 | 1 | 4 | 5 |
The optimum values regarding the criterion used in our paper are shown in Table 9.
| Factors | Levels | ||||
|---|---|---|---|---|---|
| 1 | 2 | 3 | 4 | 5 | |
| A | |||||
| Tube number | 2 | 4 | 8 | 10 | 12×▪ |
| B | |||||
| Diameter (mm) | 10 | 12 | 15 | 19 | 22×▪ |
| C | |||||
| Flow (Lph) | 5▪ | 10 | 40 | 80 | 120× |
| D | |||||
| Nano_material (%) | 0▪ | 1 | 3 | 5 | 7× |
| E | |||||
| Temperature (°C) | 20× | 22 | 25 | 30 | 35▪ |
- Note: The symbol “×” refers to maximizing efficiency and the symbol “▪” is related to minimizing pressure drop.
3.3. NSGA-II
The NSGA-II process begins with the initialization of a population of solutions generated randomly within the predefined bounds of the decision variables. Each solution represents a potential set of parameters to be optimized. The solutions are then evaluated using the objective functions, which in this study include the thermal efficiency and PP. The fitness values for each solution are calculated based on these objectives, providing a measure of their performance.
The next step involves nondominated sorting, where solutions are categorized into different fronts based on Pareto dominance. Solutions on the first front are nondominated and represent the best trade-offs between the objectives, while subsequent fronts contain solutions dominated by those on the preceding fronts. To ensure diversity among solutions, the crowding distance is calculated for each solution within a front. Solutions with higher crowding distances are prioritized, as they contribute to a more spread-out and diverse Pareto front. Selection for the next generation is performed using binary tournament selection, which considers both the front rank and crowding distance of solutions, ensuring a balance between quality and diversity.
Genetic operators, including simulated binary crossover (SBX) and polynomial mutation, are then applied to create offspring. These operators introduce variability and help explore the search space effectively. The parent and offspring populations are combined and nondominated sorting and crowding distance calculations are repeated. The top solutions are selected to form the new population for the next generation. This iterative process continues for a predefined number of generations or until a convergence criterion is met, resulting in a final population of Pareto-optimal solutions that represent the best trade-offs between the objectives.
Table 10 presents the optimization parameters chosen during the initiation of the algorithm.
| Population size | Selection technique | Crossover probability | Mutation probability | Criteria stopping conditions |
|---|---|---|---|---|
| 80 | Roulette-wheel selection | 0.8 | 0.8 | 106 |
4. Result
4.1. ANOVA
ANOVA is a statistical technique used to evaluate the hypothesis that multiple sets of data are derived from populations with equal means. Two methodologies for evaluating population variance are devised to operationalize this concept. The estimations presented in this study are based on various underlying assumptions. ANOVA method categorizes samples within each population, resulting in the computation of an F-statistic. This statistic is calculated based on the observed differences in variance among the samples within each group. When the means of the groups are selected from populations with similar mean values, it is anticipated that the variance of the group means will be reduced compared to the variance of the individual samples. As a result, a greater ratio indicates that the samples were collected from populations with varying mean values. The ANOVA involves a sequence of computations and uses F-distribution values to obtain p-values. The variance analysis for efficiency and pressure drop is presented in Tables 11 and 12.
| Source | DF | Seq | Adj SS | Adj MS | F | p |
|---|---|---|---|---|---|---|
| A | ||||||
| Tube number | 1.0000 | 1344.53 | 1344.53 | 1344.53 | 50.04 | <0.001 |
| B | ||||||
| Diameter (mm) | 1.0000 | 0.38 | 0.38 | 0.38 | 0.010 | 0.910 |
| C | ||||||
| Flow (Lph) | 1.0000 | 1172.02 | 1172.02 | 1172.02 | 43.62 | <0.001 |
| D | ||||||
| Nanomaterial (%) | 1.0000 | 3.16 | 3.16 | 3.16 | 0.12 | 0.735 |
| E | ||||||
| Temperature (°C) | 1.0000 | 335.72 | 335.72 | 335.72 | 12.49 | 0.0020 |
| Error | 19.0000 | 510.53 | 510.53 | 26.87 | — | — |
| Total | 24.0000 | 3366.33 | — | — | — | — |
| Source | DF | Seq | Adj SS | Adj MS | F | p |
|---|---|---|---|---|---|---|
| A | ||||||
| Tube number | 1.0000 | 5.7230 | 5.723 | 5.723 | 1.08 | 0.312 |
| B | ||||||
| Diameter (mm) | 1.0000 | 224.645 | 224.645 | 224.645 | 42.37 | <0.001 |
| C | ||||||
| Flow (Lph) | 1.0000 | 212.61 | 212.61 | 212.61 | 40.1 | <0.001 |
| D | ||||||
| Nanomaterial (%) | 1.0000 | 0.265 | 0.265 | 0.265 | 0.05 | 0.826 |
| E | ||||||
| Temperature (°C) | 1.0000 | 0.424 | 0.424 | 0.424 | 0.08 | 0.780 |
| Error | 19.0000 | 100.729 | 100.729 | 5.302 | — | — |
| Total | 24.0000 | 544.396 | — | — | — | — |
We can achieve the generalized linear model regarding ANOVA, shown in Tables 13 and 14, for efficiency and pressure drop, respectively.
| Term | Coef | SE Coef | T | p |
|---|---|---|---|---|
| Constant | 17.8983 | 6.8431 | 2.616 | 0.017 |
| Tube number | 1.9770 | 0.2795 | 7.074 | <0.001 |
| Diameter (mm) | 0.0280 | 0.2351 | 0.119 | 0.907 |
| Flow (Lph) | 0.1569 | 0.0238 | 6.604 | <0.001 |
| Nanomaterial (%) | 0.1388 | 0.4048 | 0.343 | 0.735 |
| Temperature (°C) | −0.6708 | 0.1898 | −3.535 | 0.002 |
| Term | Coef | SE coef | T | p |
|---|---|---|---|---|
| Constant | 12.2252 | 3.0397 | 4.022 | 0.001 |
| Tube number | −0.1290 | 0.1241 | −1.039 | 0.312 |
| Diameter (mm) | −0.6799 | 0.1044 | −6.500 | <0.001 |
| Flow (Lph) | 0.0668 | 0.0106 | 6.333 | <0.001 |
| Nanomaterial (%) | 0.0402 | 0.1798 | 0.223 | 0.826 |
| Temperature (°C) | 0.0238 | 0.0843 | 0.283 | 0.780 |
Moreover, we can use the response surface method to generate a high-quality model. Tables 15 and 16 show the coefficients of the quadratic models for efficiency and pressure drop, respectively.
| Term | Coef | SE coef | T | p |
|---|---|---|---|---|
| Constant | 52.0476 | 9.90691 | 5.254 | <0.001 |
| A: Tube number | 3.6479 | 1.00179 | 3.641 | 0.003 |
| B: Diameter (mm) | −5.8059 | 1.18431 | −4.902 | <0.001 |
| C: Flow (Lph) | 0.3704 | 0.04886 | 7.582 | <0.001 |
| D: Nanomaterial (%) | 1.5785 | 0.73254 | 2.155 | 0.049 |
| E: Temperature (°C) | −0.6202 | 0.10050 | −6.171 | <0.001 |
| A×A | −0.1834 | 0.05269 | −3.481 | 0.004 |
| B×B | 0.1698 | 0.03551 | 4.781 | <0.001 |
| C×C | −0.0017 | 0.00041 | −4.101 | 0.001 |
| D×D | −0.1922 | 0.10323 | −1.862 | 0.084 |
| A×B | 0.0553 | 0.04325 | 1.279 | 0.222 |
| Term | Coef | SE Coef | T | p |
|---|---|---|---|---|
| Constant | 19.3206 | 6.03830 | 3.200 | 0.005 |
| B: Diameter | −2.0799 | 0.78083 | −2.664 | 0.015 |
| C: Flow | 0.2080 | 0.04241 | 4.906 | <0.001 |
| B × B | 0.0526 | 0.02410 | 2.180 | 0.042 |
| C × C | −0.0005 | 0.00026 | −1.764 | 0.094 |
| B × C | −0.0055 | 0.00178 | −3.111 | 0.006 |
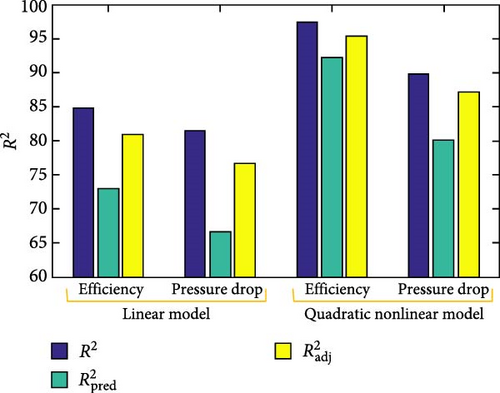
Figure 8 compares the performance metrics (R2, ) between linear and quadratic nonlinear models for two parameters: Efficiency and pressure drop. The quadratic nonlinear model shows superior performance across all metrics, with notably higher R2 values (~97% for efficiency and 90% for pressure drop) compared to the linear model (around 85% and 81%, respectively). This suggests that the nonlinear model provides a better fit and predictive capability for both efficiency and pressure drop parameters in the studied system.
The contour of the predicted mode is shown in Figures 9 and 10. Figure 9 shows that high efficiency is reached in the high flow rate and high or low diameter, while Figure 10 shows the minimum pressure drop achieved in the low flow rate with a small diameter. Regarding the importance of training these two outputs, we employed the genetic algorithm to investigate the five factors thoroughly and select the best one to optimize the efficiency and pressure drop simultaneously.
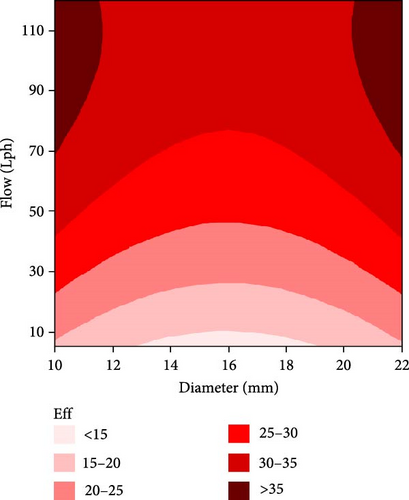
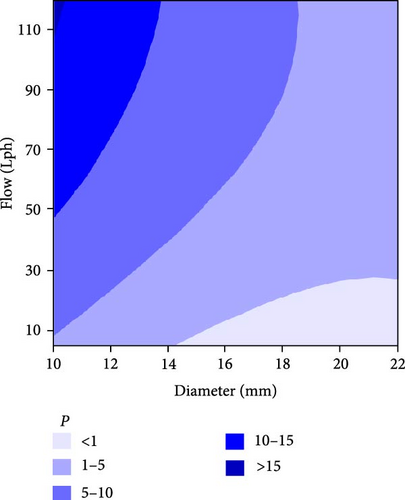
Figure 9 reveals the relationship between flow rate (10–110 L/h) and diameter (10–22 mm) and their impact on thermal efficiency, which ranges from <15% to >35%. The analysis identifies two optimal operating regions where efficiency exceeds 35%: one at high flow rates (90–110 L/h) with small diameters (10–12 mm) and another with larger diameters (20–22 mm). For optimal system performance, the flow rate should be maintained above 70 L/h, with tube diameters between 14 and 20 mm. The most stable high-efficiency region occurs at flow rates of 80–100 L/h and diameters of 16–18 mm. Conversely, low efficiency (<15%) is observed at low flow rates (10–30 L/h) regardless of diameter, suggesting that low flow rates should be avoided for efficient operation. These findings provide crucial guidance for system design and operation parameters to maximize efficiency.
Figure 10 illustrates the relationship between flow rate (10–110 L/h) and diameter (10–22 mm) and their impact on pressure drop (P), which ranges from <1 to >15. The analysis reveals that the highest pressure drop (>15) occurs at high flow rates (>90 L/h) combined with small diameters (10–14 mm), while the lowest pressure drop (<1) is observed at low flow rates (10–30 L/h) with larger diameters (>16 mm).
For optimal system operation with minimal pressure drop, larger tube diameters (>16 mm) and moderate to low flow rates (<50 L/h) should be maintained. The pressure gradient shows a nonlinear relationship, with more dramatic increases at higher flow rates and smaller diameters. Comparing Figures 9 and 10, it is evident that an optimal design must balance efficiency and pressure drop. A high-efficiency region (large diameter and high flow rate) should be checked against excessive pressure drops to avoid excessive energy consumption for pumping. An ideal operating condition would maximize efficiency, while keeping pressure drop within acceptable limits.
4.2. Optimization
The results of the Taguchi just for efficiency, Taguchi just for pressure drop and multiobjective optimization for both efficiency and pressure drop are shown in Table 17.
| Factors | For efficiency: Taguchi | For pressure drop: Taguchi | Coupled: Taguchi, multi-GA |
|---|---|---|---|
| A | |||
| Tube number | 12 | 12 | 12 |
| B | |||
| Diameter (mm) | 22 | 22 | 22 |
| C | |||
| Flow (Lph) | 120 | 5 | 16 |
| D | |||
| Nanofluid volume fraction (%) | 7 | 0 | 6 |
| E | |||
| Temperature (°C) | 20 | 25 | 21 |
| Efficiency | |||
| Model | 47.66 | 26 | 29.6 |
| Numerical | 59 | 16 | 36.3 |
| DeltaP | |||
| Model | 2.26 | 0 | 0.16 |
| Numerical | 1.72 | 0.028 | 0.12 |
Figure 11 shows a Pareto front for two objectives (efficiency and PP), instantly indicating model and CFD values.
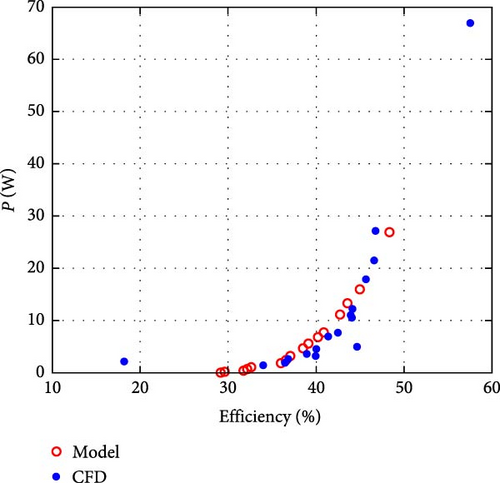
Figure 12 illustrates the temperature fluctuations of various layers of the PVT panel under both initial and optimal conditions. As shown, the flow of cooling water reduces the temperature of the other layers. Furthermore, the top layer (i.e., the glass cover) exhibits a temperature gradient, with the temperature increasing along the axial direction (z-axis). This behavior is attributed to the cooling water’s increasing temperature as it flows through the panel, which consequently reduces its cooling potential.
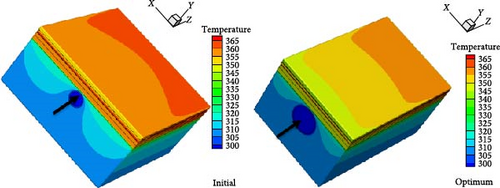
To study the effect of cooling water on the PV layer and its performance, temperature contours for the initial and optimal conditions are depicted in Figure 13. The findings indicate that implementing geometry optimization techniques—such as increasing the number of tubes (to 12), enlarging the tube diameter (to 22 mm), and substituting pure water with nanofluid—reduces the temperature of the PV layer. This decrease in the PV layer’s temperature under optimal conditions enhances the electrical conversion efficiency of the PV cell. A comparison between the initial and optimal states reveals a significant reduction in the panel surface temperature, with a decrease of approximately 10°C achieved in the optimized configuration.

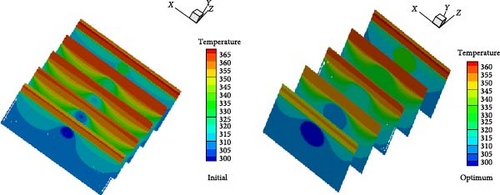
The temperature contours for some selected sections along the PVT panels are shown in Figure 14 and results are compared for both initial and optimized designs. Also, the temperature variation along the midplane for initial and optimized designs is shown in Figure 15. These figures show that the cooling fluid with a temperature of 300 K absorbs the panel’s heat, increasing its temperature continuously. Also, a significant decrease in the PV layer temperature is observed in the initial lengths of the panel. But, as the cooling fluid moves along the tube and absorbs more heat, the PV layer temperature increases. In addition, as shown in Figure 15, the maximum temperature along the midplane of the panel for the optimized design is 355 K and, therefore, indicates a 5 K reduction concerning the initial setup.

Our optimization study reveals significant economic benefits in the system’s implementation. The design achieves an 86% reduction in PP requirements, leading to substantial operational cost savings throughout the system’s lifetime. Additionally, the 80% improvement in thermal efficiency ensures a stronger return on investment through enhanced energy capture. While the optimized system requires higher initial costs due to its 12-tube configuration compared to conventional designs with fewer tubes, these costs are effectively offset by improved performance and reduced operating expenses over time.
The scalability of our optimized design presents a versatile solution for various applications. Using 22 mm diameter tubes and 12 parallel tubes, the system maintains compatibility with standard manufacturing processes and readily available materials. This standardization ensures that the findings can be effectively scaled for both smaller residential applications and larger commercial installations while maintaining the optimized geometric ratios that contribute to its enhanced performance.
Integration capabilities with existing systems demonstrate the design’s practical adaptability. The optimized design can be seamlessly retrofitted to existing PVT installations by replacing the cooling system while preserving the PV panel configuration. The system utilizes standard copper tubing and conventional pump systems, eliminating the need for specialized equipment. Furthermore, the operating temperature of 21°C aligns perfectly with typical building thermal management systems, ensuring compatibility with existing infrastructure.
Several implementation challenges require careful consideration during deployment. The higher initial material costs for the 12-tube configuration necessitate thorough evaluation against the lifetime performance benefits. Installation and maintenance personnel require additional training for proper nanofluid handling and replacement procedures. The integration with building management systems may demand additional control systems for optimal performance. Despite these challenges, the optimized design’s significant performance improvements justify its implementation, though successful deployment requires careful consideration of economic, operational, and maintenance factors. Future research should focus on detailed cost-benefit analyses and long-term performance studies under real operating conditions.
Table 18 presents a comparative analysis of thermal efficiency across recent studies involving different optimization techniques and system types. The thermal efficiency values range from 34% to 63%, with different optimization methods, such as multiobjective and single-objective approaches. The present work with simple absorber geometry demonstrates a thermal efficiency of 36.3% for the multiobjective optimization and 59% for the single-objective optimization, indicating a significant optimization in efficiency when using CuO nanofluid as a coolant.
| Author | Type of system | Type of optimization/analysis | Value of thermal efficiency (%) |
|---|---|---|---|
| Ghasempour, Salehi, and Fakouriyan [32] | Thermosyphon heat pipe, water | Multiobjective | 34.0 |
| Aggour et al. [29] | Hybrid photovoltaic/thermal water collector | Single objective | 52.08 |
| Madas, Narayanan, and Gudimetla [28] | PV (T) system with copper oxide nanofluid as a coolant | Multiobjective | 34.66 |
| Satpute et al. [30] | Spiral rectangular absorber | Analysis | 48–63 |
| Present work (2025) | PV (T) system with copper oxide nanofluid as a coolant | Multiobjective | 36.3 |
| Present work (2025) | PV (T) system with copper oxide nanofluid as a coolant | Single objective | 59 |
Environmental conditions, laboratory settings, and radiation intensity significantly impact efficiency. For instance, in the referenced study [30], experiments were conducted under varying radiation intensities. The maximum thermal efficiency was achieved at a radiation intensity of 1000 W/m2 and a mass flow rate of 0.06 kg/s. However, in the present work, the maximum flow rate was half of this value.
In the present study, the numerical analysis was performed across a range of parameters, including mass flow rates from 0.04 to 0.06 kg/s, the number of collector tubes varying between 2 and 12, tube diameters ranging from 10 to 22 mm, nanoparticle volume fractions from 0% to 7%, inlet temperatures between 20 and 35°C, and an incident radiation intensity of 800 W/m2.
5. Conclusion
This study analyzes a 3-D solar PVT collector with a tube heat exchanger. Geometric and hydrodynamic parameters such as diameter, number of tubes, inlet temperature, nanofluid volume fraction, and flow rate were optimized to achieve maximum efficiency and minimum PP. That is why we first obtained the mathematical expressions for each of the two outputs using quadratic statistical models. Then, using the NSGA-II, we established a simultaneous balance to identify the optimal point of the process. The following results were obtained.
- •
Flow rate was identified as a critical factor for both efficiency and PP. Although the nanofluid volume fraction was less significant compared to other factors, it played a crucial role in enhancing thermal efficiency.
- •
The multioptimized model resulted in an average PV surface temperature reduction of about 10°C compared to the initial state. Results from the multi-genetic algorithm optimization indicate that the optimal model achieves an approximately 80% improvement in cooling efficiency and an 86% reduction in PP compared to the initial state.
- •
The mono optimization of efficiency shows that compared to the initial state, the thermal efficiency increment and PP reduction of the panel are approximately 140% and 98%, respectively.
- •
The analysis results also showed that the flow rate maximizing the efficiency and minimizing the PP is a challenging issue because the change in each one also changes the optimal state of the outputs.
- •
Temperature reduction improved efficiency but had minimal impact on pressure drop, as per ANOVA results.
- •
It is suggested that the new design be tested outdoors to assess its performance under actual weather conditions.
- •
Investigating the integration of water-cooled PV/T systems with energy storage technologies, such as PCMs, to optimize thermal and electrical efficiencies.
- •
Employing machine learning techniques to predict and optimize PV/T system performance.
- •
Conducting a comprehensive energy, exergy, economic, and environmental analysis of the new design, which is based on integrating cooling air and water.
Disclosure
This manuscript has not been submitted to, nor is it under review at, another journal or other publishing venue. The authors have no affiliation with any organization with a direct or indirect financial interest in the subject matter discussed in the manuscript.
Conflicts of Interest
The authors declare no conflicts of interest.
Author Contributions
Seyed Morteza Javadpour designed and directed the project. Mostafa Dehghani and Masoud Goharimanesh performed the analysis and wrote the draft paper. Seyed Morteza Javadpour and Mohammad Mahdi Naserian performed the analytic calculations and performed the numerical simulations. All authors have participated in drafting the article or revising it critically for important intellectual content and approval of the final version. All authors have consented to the submission of the manuscript to the journal.
Funding
The authors declare that no funds, grants, or other support were received during the preparation of this manuscript.
Open Research
Data Availability Statement
The data that support the findings of this study are available from the corresponding author upon reasonable request.


