Enhanced Energy Sharing and Management Between Cross-Harbour Zero-Emission Buildings Based on a Combination of Electric Ferries and Deck-on Electric Vehicles With Grid Integrations
Abstract
The current challenge in zero-emission buildings lies in aligning renewable energy sources with energy consumption, which needs to be addressed. Excessive mismatch can affect the performance of zero-emission buildings and the stability of the electricity grid. Energy sharing emerges as a viable solution to optimise energy distribution effectively. In this study, based on a cross-harbour zero-energy system consisting of dual broad-scale harbour buildings, one electric vehicle ferry and 10 electric vehicles, we study the enhancement of the original energy sharing of the system and the impact on the system performance by exploring the vehicle-to-building interactions of the electric ferry and electric vehicles. Three scenarios were examined to compare energy performance: electric vehicles operating with and without vehicle-to-building functionality alongside all submarine cables and the inclusion of vehicle-to-building functions with the removal of an intermediate submarine cable. The energy-matching performance of the system is enhanced in scenarios where vehicle-to-building functionality has been incorporated. The enhancement results in a maximum percentage increase in NPVrel of 0.22% and a maximum value of 3.77 × 10⁶ HKD. When electric ferries and cars became pivotal for energy sharing, the percentage of techno-economic enhancement increased. Communication time and available capacity of vehicles were two parameters limiting the enhancement of energy sharing. Results demonstrate the effectiveness of this study in realising the feasibility of cross-harbour zero-emission ferry terminals through hybrid ocean energy systems. Meanwhile, energy sharing is realised through submarine cables to make full use of renewable energy generation. Incorporating electric ferries and electric cars with vehicle-to-building functions can enhance energy sharing. Therefore, this study’s contribution based on the scientific gap is summarised.
1. Introduction
1.1. Background
Carbon neutrality has been a topical environmental issue globally and at many international summits in recent years. Many countries and regions have introduced relevant policies to achieve carbon neutrality and positively contribute to the global environment, and Hong Kong is no exception. In 2021, Hong Kong unveiled its Climate Action Plan 2050, outlining ambitious targets for achieving carbon neutrality by 2050 [1]. Buildings and transport account for a considerable portion of energy consumption, 30% and 27%, respectively. Consequently, initiatives such as zero-emission buildings and electric vehicles have emerged as pivotal strategies in the pursuit of carbon neutrality [2, 3]. However, the integration of renewable energy sources poses challenges due to their inherent fluctuations, leading to an imbalance between energy demand and generation within individual zero-emission structures. The proliferation of zero-emission buildings poses challenges as their collective energy consumption patterns can strain the electricity grid. Energy sharing offers a solution to mitigate mismatch issues and enhance energy efficiency across clusters of zero-emission buildings or communities. Electric vehicles, serving as movable energy storage units, present an opportunity to facilitate energy sharing through vehicle-to-building capabilities, potentially reducing infrastructure costs. Yet, the implications of integrating electric transport with vehicle-to-building functionality on energy-sharing dynamics and the economic viability of zero-energy developments warrant further investigation.
1.2. Literature Reviews
Many academic researchers have concentrated on developing creative technologies and strategies for zero-energy buildings. Wuyun et al. [4] investigated the interplay between power generation and heat transfer in integrated photovoltaic technology implemented on building façades. Their study centred on assessing how the heat generated by PV modules influences both the heat transfer characteristics of the building envelope and its energy-saving capabilities while concurrently considering the electricity production aspect. They also proposed an installation methodology aimed at optimising energy conservation to achieve maximal efficiency. Dokoupilová, Formánek, and Horák [5] offer a case analysis centred on the transformation of a conventional residential structure into a nearly zero-emission building. Their research delves into factors such as non-renewable primary energy consumption, average heat transfer rate, heating energy demands, the efficiency of the building envelope, emissions and overall energy provision. They explore various energy-saving strategies encompassing improvements to the building’s envelope and service systems. Kang et al. [6] introduced a data-informed technique designed to enhance passive design elements towards attaining zero-carbon building goals. Their method involves simulating the impact of adjusting these parameters on incremental costs, emissions and the time required, all while ensuring occupant comfort. The study focused on an office building situated in a cold region of China. By utilising this data-driven approach, the effectiveness of optimising building performance through strategic design modifications has been emphasised. Sathish et al. [7] devised an enhanced parabolic trough collector setup incorporating metallic fins and phase change material. This innovation holds significant promise in advancing the realisation of net zero energy and emission buildings by maximising the utilisation of solar energy for heating applications while concurrently reducing energy wastage and environmental repercussions. Various configurations involving different fin quantities and angles were evaluated to identify the most efficient absorber types for effectively heating buildings. Myint and Shafique [8] have combined building information modelling with eco-resilient principles to establish a framework geared towards the development and construction of environmentally sustainable structures. This integrated approach offers a pragmatic method for assessing the embodied carbon emissions stemming from building construction activities. The study introduces a methodology specifically designed to evaluate the carbon footprints associated with various phases of the construction process, encompassing activities such as raw material production and material transportation. Nikitin et al. [9] introduced a dynamic solar and wind energy system for a residential near-zero energy building. Through simulations, they analysed the economics, exergy, environmental and energy performance of the system in various weather conditions. Gokula and Cao [10] investigated different control strategies for the zero-emission railway train and the station building system, focusing on energy resilience enhancement. Suarez-Ramon et al. [11] applied energy consumption equations and energy generation forecasts to establish a fundamental framework aiding in determining the ideal capacity of grid-connected photovoltaic systems. This methodology serves to facilitate the transformation of both highly efficient and traditional buildings into zero-energy structures. Alqaed et al. [12] introduced an innovative approach involving phase change materials integrated within solar walls. By expanding the surface area through compartments filled with phase change materials, this integration enhances thermal efficiency and overall energy performance. Kim and Lim [13] conducted a study examining the economic viability of net-zero- emission buildings that leverage solar power within the non-residential sector of the United States. Their research focused on accurately monitoring the evolving dynamics of PV panels to enhance the understanding of the techno-economic variables involved. This investigation utilised a statistical method known as the five-parameter logistic function to carefully predict these crucial factors. Wang et al. [14] utilised an algorithm with random forest regression to simulate the generation of different renewable sources emphasising the economic and ecological factors for the generation optimisation within a smart building microgrid. Multi-objective optimisation based on artificial intelligence techniques was introduced to reach zero-emission smart buildings with carbon peak management. Aste et al. [15] considered building integrated or applied photovoltaic systems to have promising potential to present sustainable energy for constructions obtaining zero-emission targets while still being confronted with feasibility limitations of installation surface. They evaluated the potential of the mentioned system to fulfil the energy requirements of households, focusing on Europe. Jang and Skye [16] simulated the variable speed ground-source integrated heat pumps as the efficient HVAC system in a zero-energy family house to reduce demand and examine the performance. Their results indicate that the variable speed ground source heat pumps can reduce 18% of energy consumption. Acar and Kaska [17] investigated ground source heat pump systems connected to different types of solar panels and compared the overall efficiency of different combinations. Results indicate that energy use intensity can be decreased by 33% with the developed system.
The trend towards energy-sharing strategies among various buildings within communities is on the rise, aiming to optimise the distribution of renewable energy resources. Recent research endeavours seek innovative methods to efficiently distribute energy across buildings, with a focus on maximising the advantages of renewable energy sources. Gao et al. [18] introduced a model of energy sharing incorporating reward and punishment mechanisms alongside energy storage systems to achieve zero-carbon communities. According to their findings, the model was effective in achieving its intended goals. Zhang et al. [19] proposed a low-carbon optimal management strategy with the multi-energy-sharing trading mechanism to establish maximum benefit and profit distribution models. Through comparative analyses across different scenarios, the viability of this strategy was underscored. Gao et al. [20] devised an optimisation model for energy sharing in a group of zero-energy buildings, including a decentralised energy system framework that accounts for multi-energy-sharing dynamics. They have also developed an energy-sharing optimisation model and introduced a flexible index based on cost, energy and emission. Gjorgievski et al. [21] examined the impact of regulatory frameworks and fiscal policies on two energy-sharing setups within renewable energy communities. Their findings led to policy recommendations aimed at refining energy-sharing regulations. Xia et al. [22] quantified the performance of peer-to-peer energy-sharing markets, integrating carbon emission trading through a generalised Nash game and interaction algorithm. Huang et al. [23] comprehensively analysed the effect of community factors on energy-sharing performance and proposed two indicators to quantify performance. Their study indicated that the key influencing factors include the capacity of renewable energy systems and energy storage. Muslim and Hachem-Vermette [24] proposed a methodology to capture waste energy from buildings, designing an energy-sharing strategy to distribute these savings throughout communities. Applying an energy-sharing method and on-site solar energy can reduce 74% of the energy requirement compared to the minimum requirement. Azaroual et al. [25] introduced a grid-connected renewable energy system, including battery storage with peer-to-peer and peer-to-grid energy management and trading strategy for energy sharing, and investigated the optimal solution. Di Somma et al. [26] introduced a stochastic linear programming model designed to optimise energy sharing within renewable energy communities. This model aims to maximise revenues linked to energy-sharing incentives. By employing a combination of optimised strategies involving air conditioning and batteries, the research seeks to enhance the overall performance of renewable energy communities by maximising shared energy. Zhao et al. [27] proposed an extensive energy trading framework for energy communities comprising shared energy storage, prosumers and retail energy providers. Prosumers actively engage in the energy market to enhance social welfare through peer-to-peer energy sharing among themselves or by trading energy with shared storage facilities and the primary grid. Fuchs et al. [28] studied swarm electrification for solar home systems in rural areas and analysed the benefits of the interconnection and energy-sharing setpoints for decentralised battery control. Osawa [29] investigated the power-sharing network, including batteries and vehicle-to-home systems that comprise power connections between vehicles and households. In such a scenario, annual energy costs and emissions can be reduced by 30% and 40%. Huo et al. [30] introduced an efficient method for integrated energy systems that accounts for electricity-carbon quota sharing and seasonal carbon trading. Their findings suggest that this approach can enhance resource allocation, cut costs and decrease emissions. Kasri et al. [31] proposed a novel energy management integrated with rules control and deep learning to establish a self-energy-sharing structure for prosumers. Compared to traditional microgrid energy trading, the developed method can reduce energy consumption.
In addition to exploring zero-emission buildings, researchers have delved into the feasibility of zero-emission transportation fuelled by electricity, notably electric cars, recognising the significant energy demand attributed to the transport sector. Adedeji’s [32] study focused on the design of electric cars along with the use of a neural network to predict electric vehicles’ energy consumption. Based on the case study, the precision was higher compared to the inverse function model. Dik et al. [33] proposed a method to enhance grid stability by assessing various electric vehicles and heat pumps for providing building heating. According to their findings, this approach can substantially decrease the carbon impact of residential structures. Qi et al. [34] proposed a hybrid methodology integrating firefly and cuckoo algorithms to solve coordination control challenges in grid-connected electric vehicles powered by wind and solar energy. Singh and Kumar [35] conducted a comprehensive analysis involving optimal energy management and assessing the economic feasibility of integrating battery energy storage with hybrid renewable energy systems for electric vehicles, incorporating a demand response programme. Ullah et al. [36] developed a monitoring and control strategy leveraging IoT technology for power substations, enabling intelligent grids to integrate renewable energy sources and electric vehicles for efficient decision-making in power distribution networks. Through a constructed prototype, they verified that their model could achieve real-time monitoring and control, leading to effective energy and load management decisions for the power distribution network. Guo et al. [37] developed a system comprising zero-energy electric boats and a hotel building. They studied a variety of combinations in an ocean renewable energy system to analyse performance from an economic and energy-matching perspective. Aurangzeb et al. [38] devised a methodology employing a drop-artificial neural network model to mitigate power fluctuations and enhance power quality within vehicle-to-grid systems, showcasing advancements in managing energy dynamics within transportation infrastructures. Das et al. [39] designed hybrid renewable energy systems that incorporate a hydrogen source to satisfy the demand for residential buildings and electric vehicles in remote areas. They use various cases to enhance energy efficiency and reduce energy costs. Oyedeji et al. [40] proposed some computational models trained by five different machine learning algorithms to forecast the energy consumption of electric vehicles in a specific city a day ahead. The overall results indicate more than 75% of model accuracy. Frkovic et al. [41, 42] investigated shore-to-ship technologies, enabling docked ships to leverage renewable energy sources within isolated energy systems. This synergy aims to decarbonise ships and promote broader electrification while berthed. Their findings suggest that systems with higher renewable energy integration can mitigate energy surplus, lower operational costs and reduce emissions. In a separate study, Korican, Frkovic, and Vladimir [43] investigated the decarbonisation and electrification of fishing vessels. They highlighted the interplay between photovoltaic systems in isolated island energy setups and fully electric fishing vessels, focusing on the economic and environmental implications of 100% reliance on renewable energy sources. Frkovic et al. [44] further advanced research by implementing a standalone onshore charging station powered by offshore renewable resources like photovoltaic and wind energy. This innovative approach aimed to enhance the sustainability of battery-powered electric ferries while reducing energy storage requirements. Through the evaluation of multiple scenarios and the utilisation of a detailed spatiotemporal dataset spanning 8784 h, their work demonstrated that this onshore charging station model more effectively matched the electric ferry’s energy demands. Mimica et al. [45] proposed an analytical method for ocean transportation, incorporating models for electric ships equipped with essential engines, energy storage solutions and routing strategies. Their approach integrated charging variables to interface with the distribution grid, illustrating the potential positive impacts of such integration on maritime operations and environmental sustainability. Ahmadzadeh et al. [46] examined the emission of battery electric vehicles by considering charging technologies, lightweight and battery technology. They summarised that battery technologies with higher energy density commit to reduce weight, the use of rare materials significantly increases emissions and lightweight leads to the same problem. Fandi, Novak, and Chysky [47] simulated the model of electric postal cars, including the operation of a permanent magnet synchronous electric motor to calculate the energy consumption from the battery. Battery life was also improved by an alert system. Roy et al. [48] discussed the potential impacts of electric ferries on the regional shoreside distribution network, providing suggestions for installing charging stations for electric ferries in distribution networks. Cha et al. [49] proposed a power-optimising management approach to size a fuel cell and battery electric ferry with a hybrid energy source, aiming to reduce operation costs and increase fuel cell efficiency. The optimisation framework and integrated design were examined by using simulation.
1.3. Research Gaps
Based on the literature review in the above paragraphs, the three main scientific gaps can be summarised below.
First, most of the present studies on zero-emission buildings mainly focused on onshore standard-scale common buildings. They mainly studied the advanced design and specific control for HVAC or other building service systems to reduce the overall building energy consumption and investigated the feasibility of using on-site renewable energy systems such as wind turbines or PV panels to achieve a zero-emission building as well as some quantification method or indicators for performance evaluation. The recent advancements include the integration of building-integrated PV, conventional building transformation, passive design enhancement, embodied carbon emissions assessment, energy control for resilience, consumption and generation forecast methodology, phase change materials and economic viability for zero-emission building [4–17]. Currently, research on using offshore and nearshore ocean energy to support public harbour zero-emission buildings still needs to be completed.
Second, current research on energy-sharing focuses on several typical or zero-emission buildings and some small common or zero-emission communities. The study focuses on advanced energy-sharing schemes or strategies, analysing the parameters, frameworks and policy design of energy sharing and how to use technologies such as big data and artificial intelligence to enhance energy sharing. Recent progress in the field encompasses a range of advancements in energy sharing, including reward and punishment mechanisms and energy storage in communities, optimisation model, framework and policy investigation, factors that affect energy sharing, waste energy capture and energy-sharing strategy [18–31]. However, research on control strategies to share energy between two harbour zero-emission buildings in two different regions with the help of submarine cable and electric transportation still needs to be improved.
Third, although researchers have begun to focus on the performance, energy management and enhancement methods of electric zero-emission transportation and the associated controls. However, their direction lies mainly in how to electrify vehicles such as cars and ferries and link them to the energy system in the role of energy storage devices in addition to the role of energy demanders. Recent advancements in electric vehicles comprise energy consumption prediction, coordination control for EVs, energy management for demand response and test feasibility, feasibility investigation for zero-emission systems, using V2G to reduce power fluctuations and integration of electric ships and boats to improve performance [32–49]. Few studies have considered the utilisation of the existing electric transportation with the vehicle-to-building function on the energy-sharing enhancement and investigated the impact of this electric transportation on the techno-economic performance of a cross-harbour zero-emission building.
Based on the above 3 paragraph literature review and the scientific gaps summarized based on these literature reviews, a table of comparative information Table 1 was created that summarizes the building or transportation system as the research target or objectives to be achieved, the renewable energy system as the power generation to support the studied building and transportation systems, the energy-sharing solution as the energy management strategies to enhance the performance and feasibility, the criteria for evaluating the results, the key conclusions that drawn from the assessment and discussion and all the scientific gaps for each of the literature.
| Building and/or transportation system | Renewable energy system | Energy-sharing solutions | Evaluate criteria | Key conclusions | Ref | Scientific gaps based on the review |
|---|---|---|---|---|---|---|
| Zero-energy passive house | Solar PV | — | Yearly energy savings, environmental savings and economic savings | PV system improve the performance of family houses, achieving at least 50% of annual economic savings. | [11] | Current research has concentrated on standard onshore buildings, emphasising advanced design and tailored control of building services to lower energy use. While studies have explored the viability of on-site renewable energy systems, further research is necessary to assess the potential of offshore and nearshore ocean energy for powering zero-emission buildings in public harbours. |
| Zero-energy buildings | — | — | Outlet air and wall temperature changes | Solar walls integrated with phase change material can enhance energy efficiency in zero-energy buildings | [12] | |
| Net-zero-emission office buildings | Solar PV | — | Economic payback period | Office building in specific site can reach zero-emission target with payback periods of less than 10 years | [13] | |
| Net-zero-emission buildings | Solar panels and wind turbines | — | Power output, cost and emissions | AI-based efficient energy management model can obtain cost-effective, sustainable energy management and reduced environmental impact | [14] | |
| Energy-efficient buildings | Building-integrated PV | — | PV electricity generation, share of renewables, number of building floors | Buildings with rooftop PV systems when the roof design cannot be altered significantly, may struggle to meet decarbonisation targets, particularly if they are taller than 2–3 storeys. | [15] | |
| Residential net-zero energy buildings | Roof-mounted PV | — | Combined annual heating, cooling, dehumidifier and domestic hot water energy use | Ground-source integrated heat pumps achieve energy savings of 45% and 54% | [16] | |
| Zero-energy buildings | Solar panels | — | On-site energy use intensity, total energy consumption, solar fraction for overall system, coefficient of performance | Solar-assisted ground source heat pump can reduce 33% of energy use intensity and reach the goal of zero-emission | [17] | |
| Residential and commercial buildings | PV and wind turbine | peer-to-peer and peer-to-grid trading | Cost savings, greenhouse gases emissions reduction | Energy management peer-to-peer and peer-to-grid trading save the cost and reduce the emissions for both target buildings | [25] | Current research on energy sharing focuses on several typical or zero-emission buildings and some small common or zero-emission communities, focuses on advanced energy-sharing schemes or strategies, analysing the parameters, frameworks and policy design of energy sharing and how to use technologies such as big data and artificial intelligence to enhance energy sharing. Research on control strategies to share energy between two harbour zero-emission buildings in two different regions with the help of submarine cable and electric transportation still needs to be improved. |
| Residential renewable energy communities | Rooftop PV panels | Energy sharing within community | Shared energy, total revenue for users | Energy sharing allows users to increase their total expected revenue | [26] | |
| Energy community | Solar panels | Peer-to-peer energy sharing with shared energy storage | participation rate and revenue | Peer-to-peer energy sharing reduce the energy cost, shared energy storage increases the participation rate and revenue | [27] | |
| Rural households | Solar panels | Swarm electrification | Unmet demand, energy justice | The selection of setpoints for battery state of charge significantly impacts the fairness and efficiency of energy distribution among households. | [28] | |
| Residential buildings | Solar PV | Stationary storage batteries and vehicle-to-home | Annual energy costs and CO2 emissions | The combination of vehicle-to-home and batteries reduce the annual energy costs and emissions among multiple households | [29] | |
| Solar PV and wind turbines | Seasonal carbon trading mechanism and electricity-carbon quota sharing method | Costs and carbon emissions | The proposed energy scheduling approach optimise the allocation of resources, reduce the cost and emission | [30] | ||
| — | A cellular automata and deep learning energy sharing | Collective self-consumption and system energy consumption | The proposed algorithm realises the energy consumption and increase the collective self-consumption | [31] | ||
| Electric ferries | Solar PV | — | Critical excess electricity production, operating system costs, CO2 emission | The synergy between renewable energy and electric ferries can reduce the mentioned parameters and enhance the system performance | [42] | Present studies focus on the performance, energy management and enhancement methods of electric zero-emission transportation and the associated controls. Their direction lies mainly in how to electrify vehicles and link them to the energy system in the role of energy storage devices in addition to the role of energy demanders. Few studies have considered the utilisation of the existing electric transportation with the vehicle-to-building function on the energy-sharing enhancement and investigated the impact of this electric transportation on the techno-economic performance of a cross-harbour zero-emission building. |
| Electric fishing vessels | Solar PV | — | Total hourly PV electricity production, annual investment costs | Electric fishing vessels charging can reduce excess energy generation, operational costs and emissions | [43] | |
| Battery-powered electric ferry | Offshore PV and wind turbine | — | Ship demand, offshore power supply and costs | The proposed hybrid model can reduce the capacity of energy storage, improve the offshore electricity supply, electricity demand, electricity production surplus and reduce cost | [44] | |
| Electric ships | Solar PV | — | Energy generation, demand and curtailed energy | The integration of ocean transportation and grid can enhance energy usage, reduce curtailed energy and improve the renewable energy penetration | [45] | |
| Battery electric vehicles | — | — | Greenhouse gas emission | Novel battery technologies can enhance driving range and reduce weight, the rare materials and substituting steel for lightweight increase the emission | [46] | |
| Electric postal cars | — | — | Power consumption, battery lifetime | The AI-based simulation and modelling is important in the design of electric motor and battery size for electric vehicles | [47] | |
| Electric ferry | — | — | Fuel cell efficiency, operational cost | The relationship between choosing different battery size and the related cost factors and how they affect the fuel cell efficiency, operational cost is confirmed using dynamic programming techniques. | [49] |
Although some previous studies have been conducted in this area, there are still many differences between this study and some of the previous studies in terms of the focus of the study, the corresponding scientific gaps and novelty targeted and the contributions made based on the proposed scientific gaps. In contrast to previous studies, in the reference case of this study, electric ferries and deck-on EVs, which are considered to undertake transport services, are then incorporated into the whole target system as part of the demand. Their charging process will change the instantaneous energy demand of the system and the total energy consumption in a year. The number of ocean energy systems may change when hybrid ocean energy systems are added to try to reach the goal of a zero-emission system. Consequently, the overall energy matching, economic and carbon emission results will differ from those of previous studies. While previous studies have focused on energy sharing based on submarine cables and the associated development of integrated feed-in tariff policies, this study has a greater focus on additional energy sharing between the two regions by adding electric ferries and EVs with V2B functions. Scenarios and cases with varying parameters and energy management strategies will be based on electric ferries and EVs, attempting to explore the resources that exist within the system itself for energy sharing, which differs from previous research.
1.4. Objectives and Contributions
- 1.
The primary objective of the study is to establish multiple hybrid combinations incorporating ocean-related renewable energy systems such as floating photovoltaic panels (FPV) and tidal stream generator (TSG) systems, trying to support and realise two cross-harbour zero-emission buildings based on actual and reliable data and investigate the impact and performance. This objective contributes to the first scientific gap.
- 2.
Building upon this, the secondary objective centres on implementing an energy-sharing framework within the examined zero-emission cross-harbour system. This framework leverages self-owned submarine power cables to facilitate the transmission of renewable energy generated within the system. The investigation will evaluate the consequences of this energy-sharing mechanism, thus filling the second crucial gap in the current literature.
- 3.
Furthermore, the third objective aims to develop a vehicle-to-building function for electric car-carrying ferries and electric vehicles already integrated into the system. By enabling these electric transportation assets to engage in energy sharing actively, the research seeks to optimise performance by efficiently managing the energy stored in both ferry and vehicle batteries as needed. This objective directly targets the third identified scientific gap, enhancing the overall understanding in this field of study.
This study contributes to and addresses three key scientific gaps within the field, highlighting its distinctiveness from other research in zero-emission systems and electric vehicles. Based on the first scientific gap and the corresponding contribution, this study integrates two ferry terminal buildings located in two different administrative districts, an electric ferry that travels daily between the two terminals and 10 deck-on EVs, making the system zero-emission by applying a hybrid ocean energy system. Unlike typical residential and commercial buildings, the ferry terminal building will be a large-scale public building with varying energy performance based on different operating schedules, and the total annual energy consumption will be substantial. Nearshore and offshore ocean energy systems with different compositions form several different combinations to evaluate the impacts on the energy matching, carbon emissions and economic performance of the whole zero-emission system. These are the two main points that differ from other studies. Based on the second scientific gap and the corresponding contribution, this study first applies self-built submarine cables for energy sharing between two buildings across administrative districts and a combined feed-in tariff policy based on the integration of different policies in the two districts in a zero-emission system comprising a building and an electric vehicle based on the first point. Based on the third scientific gap and the corresponding contribution, this study transforms electric ferries and EVs, which were originally tasked with transport, into additional carriers for cross-harbour energy sharing and investigates their impact on the overall system performance through the development of vehicle-to-build functionality. While some studies have focused on the interaction between electric boats or cars and zero-emission buildings, this study focuses on the energy management strategy of utilising these systems’ resources to enhance energy sharing, demonstrating differences and unique features.
2. Methodology
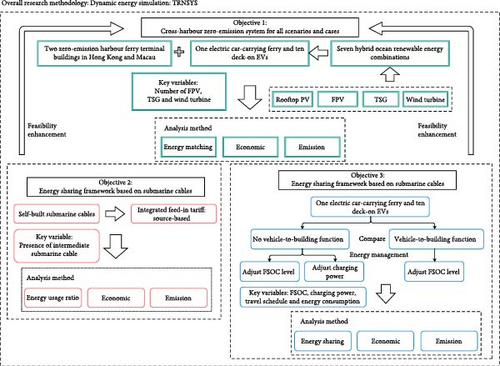
The study utilises dynamic energy simulation as its core methodology, focusing on evaluating energy performance within a proposed zero-emission system across different scenarios using TRNSYS software. The objectives outlined in the study guide the design of specific scenarios, cases, control strategies and analysis methods discussed in subsequent paragraphs.
For the first objective, to achieve cross-harbour zero-emission buildings supported by a hybrid ocean energy system and to test different percentages in the hybrid ocean energy system, the target building on the basis of a real-life building and parameters that comply with the official building design standards, as well as the nearshore and offshore FPV, TSG and wind turbine systems to cover the demand of buildings were modelled in the simulation environment. A total of seven combinations of hybrid renewable energy systems that were considered representative and potentially bring significantly different performance were designed to explore the impacts of different proportions of hybrid ocean energy systems on energy matching, economics and carbon emissions. These renewable energy combinations will be introduced into all scenarios and energy control strategies through parametric simulations and analyses to explore differences in performance.
The second objective is to realise the deployment of the energy-sharing framework enhancing the energy management and coordination within this cross-harbour system, in addition to the self-built submarine cables connecting all nearshore and offshore platforms in the two regions, electric ferries and electric vehicles with the introduction of the vehicle-to-building function are included. Potential feasible and comprehensive feed-in tariff policies are designed to be applied to the economic calculations of all scenarios and cases for the calculation of feed-in tariffs from energy exchanges. All submarine cables where energy sharing is possible are included in the scenarios.
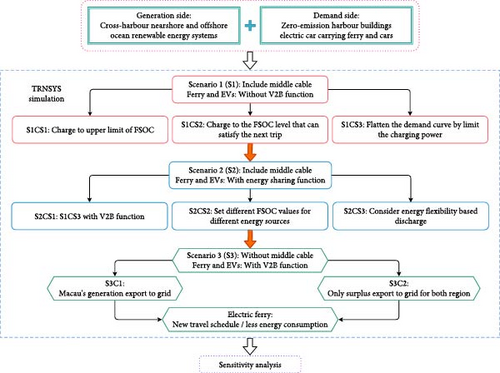
For the third objective, to explore the impact that the introduction of the vehicle-to-building function for electric ferries and electric cars brings to the system performance by taking part in energy sharing, the first scenario is designed without the vehicle-to-building function and electric ferries and electric cars only act as part of the demand. In contrast, the second scenario incorporates the vehicle-to-building function for energy sharing and compares it with the other scenarios. The energy management strategy in both scenarios will be altered based on the target FSOC and charging power during the charging process. In the third scenario, the submarine cables are cancelled, and energy sharing is only undertaken by electric ferries and electric cars. The first and second scenarios are designed to include specific energy management strategies to optimise system performance over time. In the third scenario, cases are designed based on control methods that aim to maximise energy-matching performance or maximise economic performance. Techno-economic analyses are also parametrically applied to all scenarios and cases. A flowchart showing the above methodology is shown in Figure 1.
Following the initial section, subsequent parts of the study are outlined. The methodology of this study is presented in Section 2. Section 3 lays out the weather conditions, system demands, simulation environment and relevant business models. It sets the foundational context for the research. Moving on to Section 4, this section delves into descriptions of key components, primary control principles and intricate control strategies for integrated ferry and electric vehicle systems. In Section 5, the study elaborates on the analytical criteria utilised, including their specific formulas and the constituent elements of these formulas. Section 6 presents the outcomes derived from simulations and the various control methodologies applied. It not only showcases the results but also delves into the implications arising from the different approaches employed. Section 7 contains sensitivity analyses exploring key parameters impacting the results. Following this, Section 8 discusses the potential limitations, challenges and future directions of the study. Finally, Section 9 encapsulates the study’s conclusions drawn from the amalgamation of results and discussions presented throughout the research.
3. Essential System Description
3.1. Environment and Simulation Information
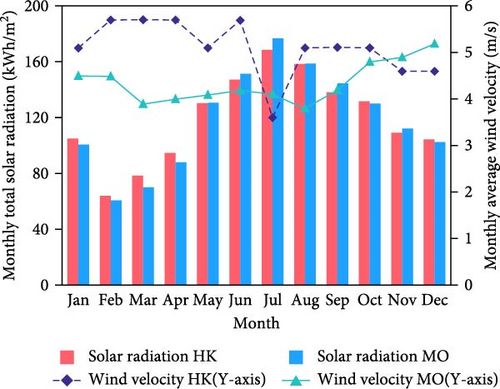
The proposed system is set to be implemented in the nearshore and offshore regions of two coastal cities within the Greater Bay Area (GBA), namely Macau and Hong Kong, both characterised by subtropical climates. Key environmental data, including essential weather parameters for the two locations, have been utilised as input for the project [50, 51]. The profile indicates that Macau and Hong Kong receive yearly total solar radiation of 1425.65 and 1428.74 kWh/m2 on the horizontal surface, respectively. The monthly average wind velocity and solar radiation on the horizontal surface are shown in Figure 2. The data illustrate a resemblance in the monthly average wind speeds between the two cities, exhibiting relative stability across the year with fluctuations typically ranging between 3 and 6 m/s. Notably, Hong Kong tends to record slightly higher wind speeds compared to Macau in most months, while both locations showcase consistent patterns in wind behaviour.
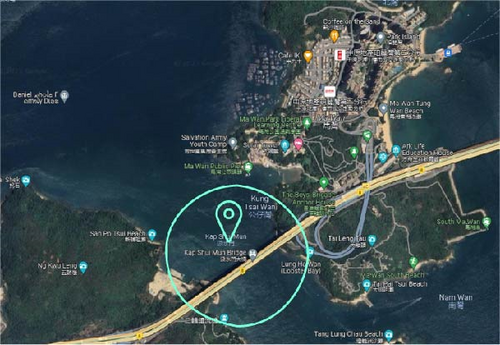
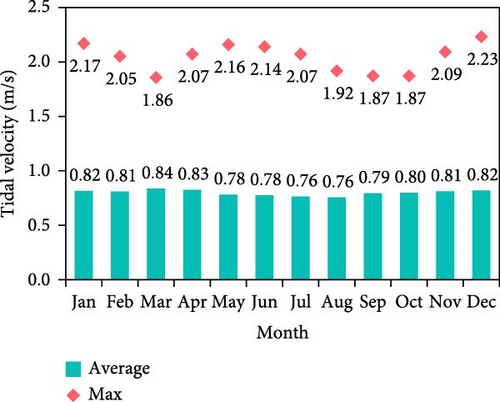
The tidal stream velocity information crucial for the TSG system was sourced from the Hong Kong Hydrographic Office. These data were derived from their internally developed predictive model. According to the official website, this model typically exhibits an average deviation ranging from 0.03 to 0.21 m/s in the maximum current speed. In this study, the tidal stream data collected at 0.25-h intervals from the point in Ma Wan was utilised. The selection of Ma Wan as the data collection point was based on the superior quality of the tidal stream data available at this location compared to other monitoring points. The precise location of this monitoring point is outlined in Figure 3a, and the monthly average and maximum tidal velocity at this monitoring point is demonstrated in Figure 3b.
The research was executed within the TRNSYS 18 simulation platform, renowned for its capacity to replicate diverse energy systems through tailored models or equations. Enhancing realism and efficiency in simulating energy dynamics, the time step within TRNSYS was adjusted to 0.25 h. This modification aimed to strike a balance between precision and computational resources, ensuring a more accurate representation of the modelled energy systems.
3.2. Cross-Harbour Buildings, Ferry and Electric Vehicle Demands
In this study, the energy demand component of the system comprises two primary elements. First, two zero-emission ferry terminal buildings were conceptualised based on previous research [52]. These buildings are hypothetically situated in the locations of existing ferry terminals in two separate regions. The simulation models for these structures were developed using the Macau Taipa terminal building as a reference due to its structural similarity and data availability. The building models consist of two floors, with the first floor covering an area of 66,674 m2 and the second floor spanning 97,554 m2. The occupancy patterns for each zone were derived from historical data pertaining to the two terminal buildings [53, 54]. Parameters for these structures were determined in accordance with the official building regulations of Macau and Hong Kong [55–57] specifying window-to-wall ratios of 0.45 for the north facade, 0.3 for the south and 0.5 for the east and west facades. Notably, the Macau harbour building operates round the clock, while the Hong Kong building functions from 7:30 am to 10 pm. The electricity demand duration curves for these two buildings are visually represented in Figure 4a.

The other part of the energy demand originates from a car-carrying electric ferry that travels daily between the Macau and Hong Kong harbour buildings and 10 electric vehicles that must conduct commercial trips in both cities daily. The model of the car-carrying electric ferry was derived from an experimental project [58]. This ferry, equipped with a 3000-kWh battery, accommodates 10 cars and 120 passengers. Operating at a speed of 17.6 km/h, the ferry consumes 38 kWh per kilometre. The daily journey of the car-carrying electric ferry started from the Macau ferry terminal building at 7:00 am, making stops at offshore platforms in Macau and Hong Kong for 1-h layovers each before reaching the Hong Kong terminal for a 3-h stop. The return trip starts at 4 pm and concludes at the Macau terminal by 9 pm via the offshore platforms in both cities. During this time, it docks for 1 h on both offshore platforms. Based on the above itinerary, this ferry required 1786 kWh of energy one way, necessitating 0.6 FSOC of the battery’s capacity. Additionally, the 10 electric cars have separate commercial trips on the Macau and Hong Kong sides. The data for the electric vehicle model used in this study were obtained from the Tesla Model S, which travels independently at 40 km/h, consuming 0.167 kWh/km, with a battery capacity of 95 kWh [59].
The specific assumptions for all the components in this hybrid system that were established in the TRNSYS simulation environment are summarised in Table 2, including the demand side and power supply system, such as dual cross-harbour buildings, electric car-carry ferry, deck-on EVs and hybrid ocean renewable energy system.
| Components | Assumption type | Specific assumption in simulation | |||||
|---|---|---|---|---|---|---|---|
| Harbour building in Hong Kong | Area | Two floors, first floor 66,674 m2, second floor 97,554 m2. | |||||
| WWR | North 0.45, south 0.3, east and west 0.5 | ||||||
| Operating time | 7:30 am to 10 pm | ||||||
|
AHU cooling | Space cooling | AHU heating | Space heating | DHW heating | Electrical demand | |
| 197.77 | 76.14 | 0 | 0 | 0.65 | 116.81 | ||
|
AHU cooling | Space cooling | AHU heating | Space heating | DHW heating | Electrical demand | |
| 23727.05 | 5293.75 | 0 | 0 | 23.63 | 3625.10 | ||
| Harbour building in Macau | Area | Two floors, first floor 66,674 m2, second floor 97,554 m2. | |||||
| WWR | North 0.45, south 0.3, east and west 0.5 | ||||||
| Operating time | Operating round the clock | ||||||
|
AHU cooling | Space cooling | AHU heating | Space heating | DHW heating | Electrical demand | |
| 71.86 | 205.69 | 0 | 0 | 0.43 | 215.19 | ||
|
AHU cooling | Space cooling | AHU heating | Space heating | DHW heating | Electrical demand | |
| 1732.64 | 6056.38 | 0 | 0 | 10.07 | 4044.71 | ||
| Electric car-carry ferry | Battery | 3000-kWh, can serve as energy storage with V2B function | |||||
| Carrying capacity | 10 cars and 120 passengers | ||||||
| Speed | 17.6 km/h | ||||||
| Energy consumption | 38 kWh/km | ||||||
| Schedule | Started from Macau at 7:00 am, making stops at offshore platforms for 1-h layovers, reach Hong Kong for a 3-h stop. Return at 4 pm and arrive at Macau by 9 pm | ||||||
| Deck-on electric vehicles | Number | 10 | |||||
| Battery | 95 kWh, can serve as energy storage with V2B function | ||||||
| Speed | 40 km/h | ||||||
| Energy consumption | 0.167 kWh/km | ||||||
| Schedule |
|
||||||
| Wind turbines | Capacity | Hong Kong: 1 MWp/unit, Macau: 2.7 MWp/unit | |||||
| Number | Variable | ||||||
| Hub height | Hong Kong: 50 m, Macau: 89 m | ||||||
| Rotor diameter | Hong Kong: 54.2 m, Macau: 122 m | ||||||
| Location | Both nearshore and offshore | ||||||
| Cost | Installation cost: 24,843 HKD/kWp, annual O&M cost: 0.92% | ||||||
| TSG | Capacity | 250 kWp/ unit | |||||
| Number | Variable | ||||||
| Type | Floating structure, vertical-axis TSG | ||||||
| Location | Nearshore in Hong Kong | ||||||
| Cost | Installation cost: 24,843 HKDkWp, annual O&M cost: 0.92% | ||||||
| FPV | Capacity | 260 W/ panel | |||||
| Number | Variable | ||||||
| Standard efficiency | 15.92% | ||||||
| Orientation | 0° | ||||||
| Location | Nearshore in Hong Kong, offshore in Macau | ||||||
| Cost | Installation cost: 19,110 HKD/kWp, annual O&M cost: 5% | ||||||
| Rooftop PV | Capacity | 260 W/ panel | |||||
| Standard efficiency | 15.92% | ||||||
| Orientation | Slope angle of 18°, facing south | ||||||
| Number | 59,000 PV panels installed on a single building roof | ||||||
| Cost | Installation cost: 6887.4 HKD/kWp, annual O&M cost: 1% | ||||||
- Note: WWR refers to window-to-wall ratio.
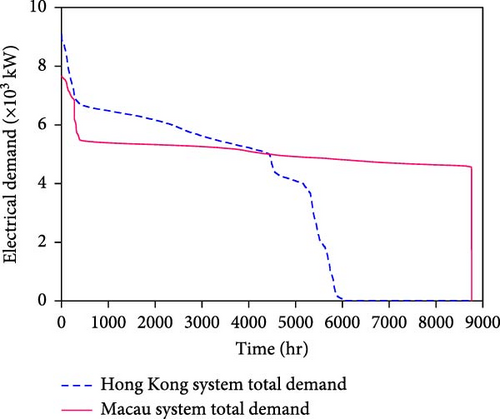
Upon arrival at the Hong Kong ferry terminal, the 10 electric cars depart and embark on a 1-h journey to their destination, followed by an hour-long stop before returning to the terminal. Subsequently, upon the ferry’s arrival at Macau by 9 pm, the electric cars leave the harbour, spending 30 min and another half-hour at the destination. Each electric vehicle consumes 13.36 kWh for a one-way trip in Hong Kong, necessitating an FSOC of 0.14, and 3.34 kWh for a one-way journey in Macau, requiring an FSOC of 0.04. The cycle count of the battery was considered to assess battery degradation in electric transport. A maximum of 2000 cycles was set as the threshold. If the battery achieves 2000 cycles after 10 years, it will be replaced in the tenth year. If it reaches 2000 cycles before the tenth year, the replacement will be done in the year when this cycle count is reached. The duration curve of the total electrical demand with the inclusion of harbour buildings, electric ferries and electric vehicles is displayed in Figure 4b. The illustration demonstrates a consistent electrical demand curve in Macao throughout the year, remaining relatively steady. This stability is attributed to the continuous operation of buildings in Macao 24 h a day, preventing the electrical demand from dropping to zero.
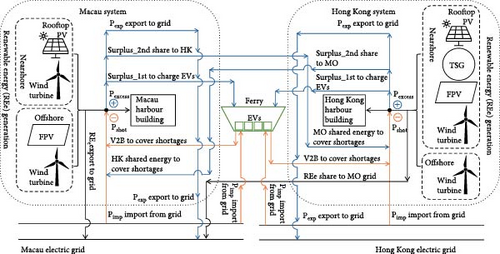
A diagrammatic sketch of the hybrid cross-harbour system, including the dual harbour buildings, ferry and EVs, the supporting renewable energy system and the possible energy flow path, is shown in Figure 5. The energy comparison node is placed before all the energy flows of the two subsystems. After the energy comparison node, blue arrows represent possible surplus energy flows, and orange arrows represent possible shortage energy flows. The renewable energy from the two subsystems in the partial control will be used first to meet the energy consumption of the building. The surplus will first charge the ferry and EVs, after which it will be shared with the other subsystem, and if there is still a surplus, it will be exported to the grid. In the other part of the control, the Macau system may first export renewable energy to the grid, and the Hong Kong system may first share renewable energy with the Macau grid.
3.3. Business Models in Case Charging by Grid Electricity
The study focuses on a system within the GBA, incorporating theoretical buildings located in Macau and Hong Kong. Electricity tariff models and the feed-in tariff policies were described to calculate the overall economic performance. The bulk tariff from China Light and Power Company Syndicate Power Hong Kong, Ltd. [60] was chosen for the system in Hong Kong. Hong Kong’s business model monitors the maximum demand during peak and off-peak periods each month to calculate the demand charge. Macau’s tariff is managed by Companhia de Electricidade de Macau which is divided into three parts. First, they also charge for the maximum monthly demand, but there is no distinction between peak and off-peak. The energy charge is divided into two parts, which are called active energy and reactive energy, and distinguishes between full-load hours and low-load hours [61]. Detailed data concerning electricity tariffs in the respective regions are outlined in Table 3.
| Macau Tariff B3 (1 MOP = 0.124 USD, 1 HKD = 0.128 USD) | |||||
|---|---|---|---|---|---|
| Hours | MOP/kvarh | ||||
| Reactive energy | Low load | 0.116 | |||
| Full load | 0.348 | ||||
| Active energy | — | MOP/kWh | |||
| Low load | 0.767 | ||||
| Full load | 0.874 | ||||
| Demand | MOP/kW | ||||
| 21.484 | |||||
| Feed-in tariff | 2.8 MOP/kWh of energy exporting | ||||
| Hong Kong bulk tariff (1 HKD = 0.128 USD) | |||||
|
100 kVA as the minimum peak demand | ||||
| Peak | First 650 kVA | 68.4 | |||
| Above 650 kVA | 65.4 | ||||
| Off-peak | Each off-peak kVA up to the on-peak billing demand | 0 | |||
| Each off-peak kVA in excess of the on-peak billing demand | 26.8 | ||||
|
Peak | First 200,000 kWh | 75.3 | ||
| Over 200,000 kWh | 73.7 | ||||
| Off-peak | Each kWh | 67.6 | |||
| Feed-in tariff | 2.5 HKD/kWh of energy generation | ||||
To facilitate shared energy initiatives between the two cities with disparate feed-in tariff policies, a coherent feed-in tariff strategy needs to be devised. Leveraging the source-based tariff model from a prior study, energy generated in Hong Kong will align solely with the Hong Kong feed-in tariff. Conversely, energy produced within the Macau system and transmitted beyond its borders will be classified as energy exported to the Macao grid, thereby benefiting from the Macau feed-in tariff [52]. The source-based feed-in tariff business model for energy sharing between two cities is the proposed model for research purposes. In practice, the stakeholders should coordinate and negotiate with utility companies in Hong Kong and Macau and the government authorities to realise the cross-cities of energy sharing. The practical legal feasibility of such energy sharing is out of the scope.
4. Control Methodology and Hybrid Supporting Energy Systems
4.1. Control Methodology for the Integrated EV and Ferry Systems
The system studied in this research includes several basic components: renewable energy generation part, energy demand part, energy transmission part and outside electric grid of two cities. The generation part includes ocean-related renewable energy systems offshore and nearshore, such as FPV, TSG and wind turbine systems, which are described in the next subsection. Various combinations of hybrid ocean energy are listed to investigate performance. The energy demand part includes harbour buildings, an electric car-carrying ferry and 10 electric vehicles with daily transport tasks. The energy transmission part includes self-owned submarine cables connecting the offshore site to the nearshore site and electric ferry and EVs with the V2B function. The stakeholder of all these basic components is the same one who owns all two harbour buildings, nearshore and offshore renewable energy systems, electric ferries and EVs. The general control and energy flow is also shown in the previous Figure 5.
4.1.1. Design of the Overall Scenarios
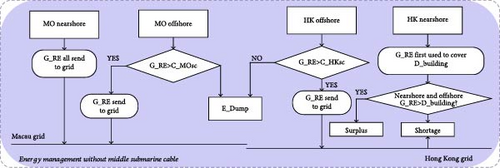
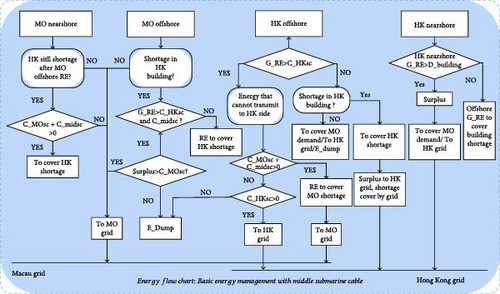
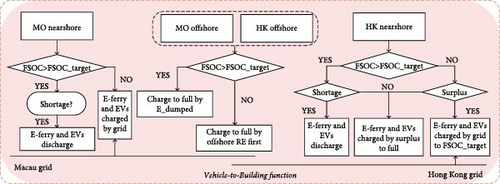
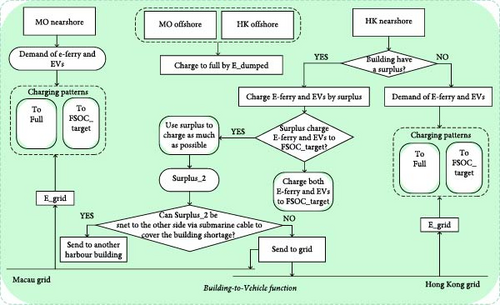
This study has three scenarios, named scenarios 1, 2 and 3. In scenarios 1 and 2, the system has submarine cables connecting sites to transmit energy. In S3, the intermediate submarine cable was removed, leaving only two sections of the submarine cable from the offshore site to the nearshore site. The assumption made is that all submarine cables will endure and operate at full capacity throughout a 20-year lifetime without requiring replacement. Initially, the role of electric ferries and cars within the study’s system is explored, focusing on their transportation function. Scenario 1 delves into their impact on the system solely as energy consumers with basic B2V functionality. Furthermore, various charging management strategies are utilised within different segments of scenario 1 to showcase how these strategies can mitigate the adverse effects of electric transport on electricity demand and the economy. In scenario 2, building upon the findings of scenario 1, electric ferries and electric cars will be equipped with the V2B function. This design aims to involve them in energy-sharing and exchange activities, evaluating how this modification influences the overall performance of the system. Given the significant variations between the battery capacity of electric ferries and electric vehicles and the sizes of systems and submarine cables, the influence of energy sharing through the V2B function on system performance might be nuanced. Thus, in scenario 3, the focus shifts to accentuating the effect of energy sharing for electric transportation by eliminating the intermediate submarine cables and the associated energy sharing facilitated by these cables. The length of the submarine cables on the Macau, middle and Hong Kong sides is 15 km, 8 km and 24 km, respectively. The basic control methodology of scenarios without and with middle submarine cables for buildings is shown in Figure 6, and the flow charts of V2B and B2V functions are shown in Figure 7.
4.1.2. Control Methodology for Scenario 1 and 2
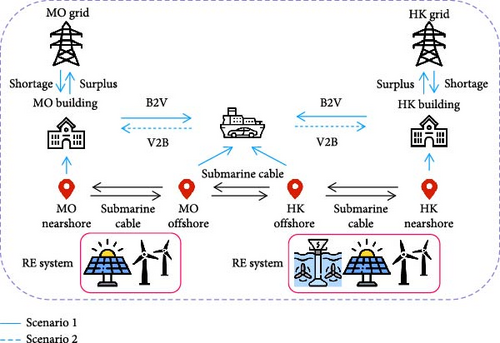
In scenarios 1 and 2, an 8 km submarine cable will connect the offshore systems of Macau and Hong Kong, facilitating the exchange of energy between the two regions. On the Macao side, as described in the general rule of source-based feed-in tariff, all renewable energy generated is initially directed towards addressing any energy shortages in Hong Kong and ensuring tariff benefits. The process begins with an assessment of Hong Kong’s energy needs. If there are no deficits, excess energy from Macau is exported into the local grid. If the renewable energy produced in Macau exceeds the capacity of the submarine cables, the availability of space on the intermediate and Hong Kong cables is then examined. If sufficient capacity exists and surpasses the remaining Macau offshore energy, the surplus is transmitted to the Hong Kong grid. However, if the cables are at full capacity or lack space, some energy may be wasted. If there is no shortage, all renewable energy generated in Macao will be exported to the Macao grid as much as possible.
In instances where there is an energy shortage in Hong Kong, the energy produced offshore in Macau is initially compared for usage. If the energy output exceeds the shortfall, efforts are made to transmit only the necessary amount to cover the deficit. This energy portion is then assessed against the capacities of the intermediate and Hong Kong submarine cables. If there is a deficit in Hong Kong that surpasses the renewable energy generated offshore in Macau, it is crucial to evaluate the capacities of all three submarine cables against the nearshore energy generation in Macau and optimise energy sharing.
In Hong Kong, the generated energy is primarily directed towards fulfilling the energy needs of local buildings. Any surplus energy, after addressing local demands and considering available capacities in the intermediate and Macau submarine cables, is shared to meet Macau’s energy requirements. Subsequently, the energy deficit in Macau’s buildings is completely covered by the grid. Energy transmitted from Hong Kong to Macau considers energy from the Hong Kong offshore system first, with energy from the nearshore site of Hong Kong only transmitted if the former is insufficient. The schematic diagram of these two scenarios is shown in Figure 8.
4.1.3. Control Methodology for Scenario 3
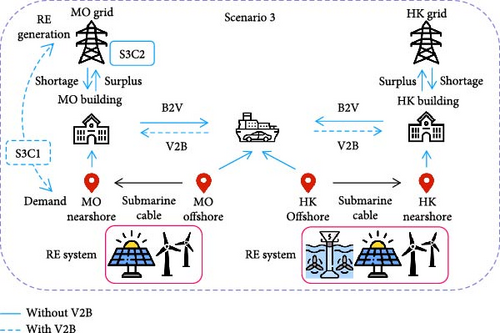
In scenario 3, the intermediary cable is no longer in operation, impeding the sharing of energy between Macau and Hong Kong. Macau’s feed-in tariff calculations, which hinge on exported energy quantities, are managed through two distinct methods. To prevent energy wastage, we assume the submarine cable operates at full capacity throughout. Under the first control, S3C1, in Hong Kong, all renewable energy generated is initially directed to meet building demands. Any surplus is fed into the grid, while any shortfall is addressed by the grid. In Macau, all energy will first be sent to the grid, with grid electricity catering to building and electric vehicle demands. In the second control, S3C2, the energy management approach in Hong Kong mirrors that of the first control. Conversely, in Macau, renewable energy satisfies demand first, with excess energy exported to the Macau grid and any deficits covered by grid electricity. The schematic diagram of scenario 3 is shown in Figure 9.
Within this system, a car-carrying electric ferry and a fleet of 10 electric cars constitute both energy consumers and mobile electrical energy storage units. When solely utilising the B2V function with the V2B function inactive, the electric ferry and cars will solely charge when stationed at harbour buildings or offshore platforms. Upon docking, energy transfer prioritises meeting building demands. Excess energy is then allocated to charging the ferry and EVs. Any surplus post-fulfilment of ferry and EV requirements is exported to the grid. Should energy generation fall short of ferry and EV demands, grid electricity supplements the deficit. When ferries and EVs are charged, their FSOC levels will be charged at least to the level required for the next trip. The specific value depends on the individual controls of each group.
When both the B2V and V2B functions are activated, the ferry and EVs will be allowed to discharge the building to cover the building’s shortage when docked at the harbour building. The ferry and EVs conduct a preliminary assessment of their FSOC levels. If their FSOC exceeds the required level for the upcoming trip and the building faces an energy deficit, the vehicles can discharge stored energy to address the shortage. Conversely, if the FSOC falls below the necessary level for the next trip, the ferry or EVs will solely undergo recharging. The charging measures include adjusting the target FSOC level for charging and setting different FSOC levels for energy sources, reducing the instantaneous energy demand, and distributing the total energy demand evenly over the entire charging period. The performance of these various charging measures is compared to obtain the optimal charging strategy. In V2B discharging, diverse strategies are employed. The first entails complete discharge of the ferry and EVs to rectify building shortages if the FSOC surpasses the required level for the next trip. Simultaneously, an energy flexibility-based strategy leverages discharged energy to mitigate building energy peaks, thereby reducing demand charges within the electricity billing structure.
The original setting of energy consumption per kilometre for the electric car-carrying ferry was high, resulting in an FSOC level of 0.8 required for a one-way journey and an FSOC level of only 0.15 that could be used for energy sharing, limiting the possibilities of energy sharing for techno-economic performance enhancement. Therefore, based on information from other ordinary ferries and electric car-carrying ferries, and only for illustrative purposes, a group of illustrative cases with a minor energy consumption of 25 kWh/km was created for each control strategy in this scenario to demonstrate the impact of such a change on the system performance [62].
4.2. Integrated Ocean Energy System
Renewable energy systems are crucial components of a zero-emission system and require careful consideration when selecting based on the specific location and area. Hybrid systems, such as FPV, wind turbines and TSG, are included in this composition. Additionally, solar PV panels will be installed on the roofs of both buildings, utilising the ample floor space available. The fundamental assumptions about these integrated ocean energy systems are also shown in Table 2.
PV panels stand as the prevailing choice for renewable energy systems today; nevertheless, their installation demands significant land area for a zero-emission building. Given the scarcity and expense of land in the selected cities, extensive deployment of PV systems on land proves impractical. The primary purpose of using the FPV system is to alleviate land usage concerns. Furthermore, FPV systems exhibit enhanced energy conversion efficiency, attributed to the stable and potentially cooler seawater temperatures relative to air temperatures during summer. We use Type 567 to simulate the performance of FPV panels. Each panel was presumed to be mounted at a 0° angle to mitigate the effects of waves and wind on solar radiation absorption [63, 64]. The rooftop PV and FPV systems parameters are obtained from a real-life product, FU 260P from FuturaSun [65], which is 260 W and 15.92% under standard test conditions. The installation and annual O&M costs of both rooftop PV and FPV systems are shown in Table 4 [66, 67]. The calculation assumes a total of 59,000 PV panels installed on a single building roof, and the angle is set to 18°. The designed rooftop PV panels can cover 19% and 27% of the energy demand for the Macau and Hong Kong harbour buildings, respectively.
| Renewable energy system | Installation cost | Annual O&M cost |
|---|---|---|
| (1 HKD = 0.128 USD) | HKD/kW | % |
| Rooftop PV | 6887.4 | 1 |
| FPV | 26,520 | 1.92 |
| Wind turbine | 24,843 | 0.92 |
| TSG | 19,110 | 5 |
Wind turbines are another essential part positioned on both sides to generate energy from the wind. The parameters were collected from real commercial wind turbine products. Suitable turbine products were selected according to the different energy requirements of the buildings in the two areas. The model used for the Hong Kong system is a single 1 MW turbine with a hub height of 50 m and a rotor diameter of 54.2 m [68]. The product used for the Macau system is a single 2.7 MW turbine with an 89 m hub height and a 122 m rotor diameter [69]. The wind turbines are arranged in a straight line, with the fan faces pointed in the same direction. To ensure the maximum amount of wind energy is captured, the distance between each turbine is set to be four times the diameter [70]. The cost information is shown in Table 4.
The TSG system is the third type of renewable energy source in this hybrid system [71]. Tidal energy can provide steady and reliable energy generation based on its highly predictable qualities. We assume that the TSG will be a floating structure rather than a fixed structure, which will be more flexible and easier to install and maintain [72]. As the software did not have a model that could describe the TSG system, they were simulated using logical equations. This equation was derived from a vertical-axis TSG product called the Neptune Proteus and the power curves from Hardisty’s case study [73]. The assumed cost of the TSG system is also shown in Table 4 [67, 74]. To ensure data reliability, the TSG system will operate exclusively in the Ma Wan channel in Hong Kong. A total of 30 TSGs will be strategically positioned at this tidal data collection point.
A zero-emission building, also known as a net-zero energy building, is a structure designed to produce as much energy as it consumes over a specified period, typically a year. These buildings incorporate energy-efficient features, renewable energy systems and advanced technologies to minimise their carbon footprint and environmental impact. By optimising energy use and generation, zero-emission buildings contribute to sustainability and environmental conservation efforts [75]. This is the target that this study hopes to realise through the integration of the introduced ocean energy systems.
5. Analysis Criteria
This research examines the feasibility of using a combination of electric ferries and deck-on electric vehicles to enhance energy sharing on a zero-emission system across the harbour complemented by ocean-based renewable energy solutions. The results are investigated based on the technical, economic and environmental impact and benefits by selecting the corresponding key indicators, which are presented in this section.
In this research, the weighting factors for OEMe and OEFe will have an equal value of 0.5. Similarly to OEMe and OEFe, higher WMI values indicate better energy-matching performance and the WMI value of the perfect matching case will equal 1.
There is no dumped energy when the renergy usage is equal to 1, and the system achieves the optimum energy usage.
6. Simulation Results, Analyses and Discussions
In the initial reference scenario, the ferry and EVs adhere to predetermined routes without the integration of renewable energy systems. Consequently, these vehicles rely solely on grid electricity from harbour buildings for charging rather than utilising offshore renewable sources. Both ferry terminal buildings in Macau and Hong Kong draw power exclusively from the local grid. Simulation results reveal operational tariffs of 5.47 × 10⁷ HKD for Macau and 4.95 × 10⁷ HKD for Hong Kong (1 HKD = 0.128 USD). According to the battery cycle number calculation, ferry and EV batteries should be changed every 10 years.
Scenario 1 builds upon the reference case by introducing ocean renewable energy systems as the primary energy source for the designed system, encompassing two ferry terminals, a car carrier ferry and 10 EVs. Seven distinct renewable energy combinations labelled RE1–RE7, detailed in Table 5, are chosen to assess the effects of varied renewable energy setups. The total annual energy generation of these renewable energy combinations will be greater than or equal to the total annual energy demand of two buildings, one electric ferry and 10 EVs, thus all combinations can reach the goal of a zero-emission system. Notably, RE3 stands out for its inclusion of 30 nearshore TSGs in Hong Kong. In Scenarios 1 and 2, featuring all three sections of submarine cables, the simulation assigns different proportions of submarine cable capacity limits at 20%, 30% and 40%.
| Renewable energy combinations | Hong Kong | Macau | |||||
|---|---|---|---|---|---|---|---|
| Nearshore | Offshore | Nearshore | Offshore | ||||
| WT | TSG | FPV | WT | WT | FPV | WT | |
| RE1 | 0 | 0 | 0 | 9 | 0 | 115,701 | 0 |
| RE2 | 0 | 0 | 0 | 9 | 0 | 0 | 4 |
| RE3 | 6 | 30 | 0 | 0 | 4 | 0 | 0 |
| RE4 | 9 | 0 | 0 | 0 | 4 | 0 | 0 |
| RE5 | 0 | 0 | 63,414 | 0 | 4 | 0 | 0 |
| RE6 | 5 | 0 | 0 | 4 | 2 | 56,121 | 0 |
| RE7 | 5 | 0 | 0 | 4 | 2 | 0 | 2 |
The results of scenario 1 without the energy-sharing V2B function are shown in Subsection 6.1. The individual subsections present case sets that feature distinct charge management strategies. The single scenario encompasses three distinct case groups, each tailored with a stepwise adjusted energy control strategy. This deliberate design approach aims to optimise the performance based on the energy management within the scenario. These strategies involve modifications like adapting the FSOC value for charging and adjusting the charging power. The primary aim is to mitigate the adverse effects that charging electric vehicles can have on instantaneous power consumption and the economic efficiency of the entire system. The results of scenario 2 built upon the first scenario with the energy-sharing V2B function were shown in Subsection 6.2. In each subsection of this scenario, strategies have been devised to progressively improve the system’s performance. These strategies have been specifically designed based on the energy sharing facilitated by the V2B function. The subsequent sections elaborate on these strategies and delve into the outcomes derived from their implementation. In Subsection 6.3, the results of scenario 3 without the middle submarine cable were demonstrated, different energy controls were designed to maximise energy matching or economic performance based on the characteristics of the feed-in tariff policy in the Macau region and the results were explored. The impact was also tested by adjusting two parameters of electric ferries that potentially influence energy-sharing performance, travel schedule, and travel energy consumption. Furthermore, the analysis includes a demonstration of how crucial parameters can affect the results, as shown in Subsection 6.4. Figure 10 indicates the research steps and methodology used in this project.
6.1. Scenario 1: without Energy Sharing Function (No V2B Function)
6.1.1. Impact of Electric Ferry and Cars With B2V Function
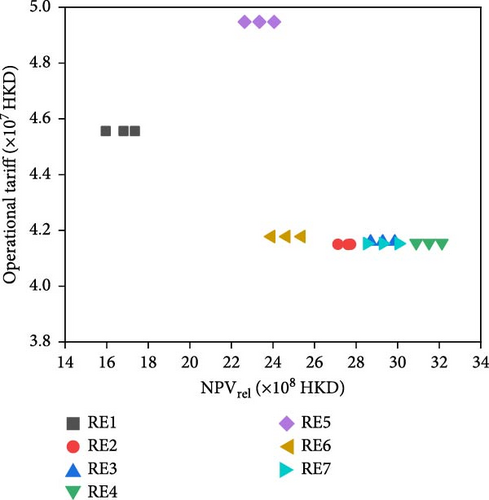
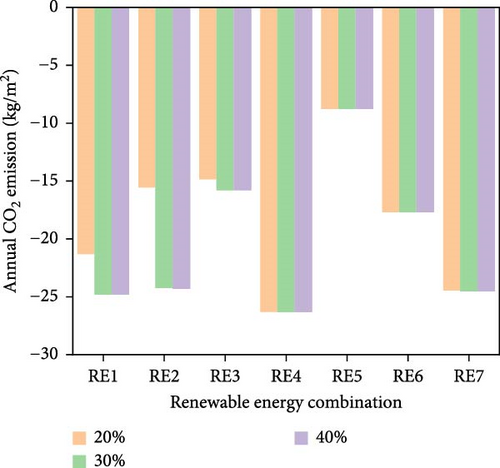
In Scenario 1, the focus lies exclusively on the B2V charging function, with no V2B capability in place. As described in the previous section, carrier ferries and EVs will only be charged in the ferry terminal building, and there is no discharge function. Within this scenario, three distinct charging strategies are devised, with the initial approach detailed in this section. The primary charging method is that during the charging of ferries and EVs at the ferry terminal building, irrespective of the energy source being renewable or grid-based if the FSOC of the batteries falls below the predefined upper limit of 0.95, the charging process initiates and continues until reaching this upper limit. The energy-matching, economic, emission and energy usage performances are shown in Table 6 and Figure 11.

| Renewable energy combinations | WMI | Operational tariff | NPVrel | Energy usage ratio (%) |
CEa |
|---|---|---|---|---|---|
| [× 107 HKD] | [× 108 HKD] | kg/m2.a | |||
| 20% of submarine cable capacity upper limit | |||||
| RE1 | 0.55 | 4.56 | 17.36 | 99 | −21.31 |
| RE2 | 0.59 | 4.15 | 27.61 | 98 | −15.55 |
| RE3 | 0.60 | 4.16 | 29.86 | 100 | −14.86 |
| RE4 | 0.58 | 4.16 | 32.13 | 100 | −26.31 |
| RE5 | 0.49 | 4.95 | 24.06 | 100 | −8.78 |
| RE6 | 0.59 | 4.18 | 25.38 | 100 | −17.68 |
| RE7 | 0.59 | 4.15 | 30.05 | 100 | −24.47 |
| 30% of submarine cable capacity upper limit | |||||
| RE1 | 0.56 | 4.56 | 16.81 | 100 | −24.80 |
| RE2 | 0.59 | 4.15 | 27.74 | 100 | −24.24 |
| RE3 | 0.60 | 4.16 | 29.28 | 100 | −15.79 |
| RE4 | 0.58 | 4.16 | 31.51 | 100 | −26.31 |
| RE5 | 0.49 | 4.95 | 23.35 | 100 | −8.78 |
| RE6 | 0.59 | 4.18 | 24.65 | 100 | −17.68 |
| RE7 | 0.59 | 4.15 | 29.29 | 100 | −24.53 |
| 40% of submarine cable capacity upper limit | |||||
| RE1 | 0.56 | 4.56 | 15.96 | 100 | −24.80 |
| RE2 | 0.59 | 4.15 | 27.13 | 100 | −24.31 |
| RE3 | 0.60 | 4.16 | 28.70 | 100 | −15.79 |
| RE4 | 0.58 | 4.16 | 30.90 | 100 | −26.31 |
| RE5 | 0.49 | 4.95 | 22.64 | 100 | −8.78 |
| RE6 | 0.59 | 4.18 | 23.92 | 10 | −17.68 |
| RE7 | 0.59 | 4.15 | 28.52 | 100 | −24.53 |
- Note: (1 HKD = 0.128 USD).
The analysis indicates that RE1 and RE2 fall below 100% energy usage only when the submarine cable operates at 20% of the capacity limit, which was 99% and 98%, respectively. Conversely, all other combinations maintain a full 100% energy usage. RE3 has the best energy-matching performance, while RE5 has the lowest WMI of 0.49. As the submarine cable capacity escalates from 20% to 40% of the capacity limit, the optimal NPVrel occurs at 30% of the capacity limit only for RE2, amounting to 2.77 × 10⁹ HKD (1 HKD = 0.128 USD). The most favourable economic outcomes for all other combinations emerge at 20% of the capacity limit. Among the combinations, RE4, which is fully powered by the nearshore wind turbine system in both two regions, stands out with the highest NPVrel at 3.21 × 10⁹ HKD. RE1, which is completely supplied by the offshore FPV system in Macau, records the lowest at 1.73 × 10⁹ HKD. Compared to all cases, the economic performance of the pure offshore configuration is worse compared to both the half-offshore and half-nearshore configuration and the pure nearshore configuration. The economic performance of the wind turbine-only case is better than that of the FPV and TSG systems in all combinations. The economic performance of RE4 at 40% of the capacity limit is the lowest compared to the cases of RE4 at 20% and 30% submarine cable capacity, yet it still outperforms all other combinations. Meanwhile, the CEa values are negative in all cases, meaning that the studied system fully achieves the goal of a zero-emission system. RE4 exhibits the lowest CO2 emissions, reflecting superior environmental performance. This configuration comprises solely nearshore components featuring wind turbines in both Macau and Hong Kong. In contrast, RE1 comprises an all-offshore system with wind turbines in Hong Kong and FPV in Macau. The wind turbine system bears lower investment costs compared to the FPV system, with offshore installations incurring higher expenses, which is the reason why these two combinations have the highest and lowest economic performance, respectively.
6.1.2. Impact of Adjusting the Charging FSOC
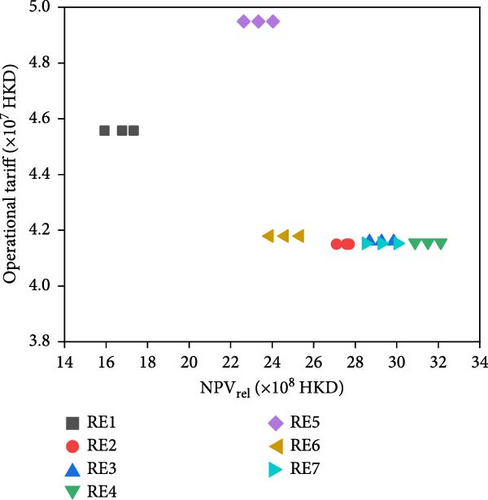
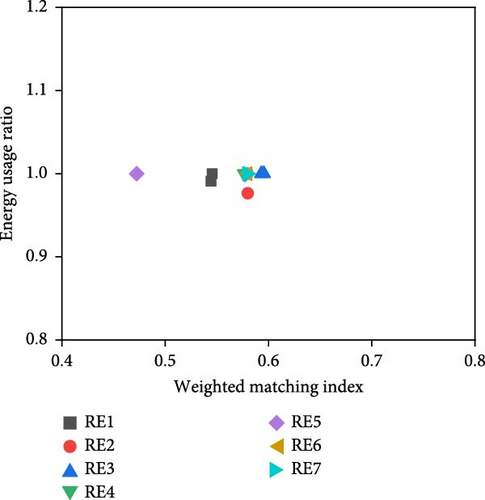
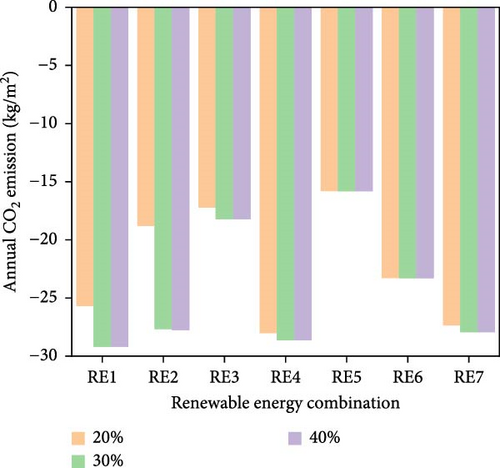
After evaluating the initial charging approach, it became evident that consistently charging batteries to their upper limits might not be the most efficient strategy. Consequently, a second charging method was devised, introducing varied FSOC levels. In the second charging strategy, the focus shifted to setting the FSOC at a level adequate for the upcoming journey. If the current FSOC surpasses the requisite level for the next trip, no charging occurs. However, if charging is necessary, the objective is to reach the FSOC threshold sufficient for the subsequent journey. For the car carrier ferry, the minimum FSOC essential for the next trip was established at 0.6. Considering the battery’s lower limit FSOC of 0.2, the target FSOC for the ferry was determined as 0.8. The 10 EVs have trips in both cities; the minimum FSOC required for the subsequent journey was 0.14 in Hong Kong and 0.04 in Macau, accounting for the battery’s lower limit FSOC. The targeted SOC levels were set at 0.34 for Hong Kong and 0.24 for Macau, respectively. The results are shown in Table 7 and Figure 12.
| Renewable energy combinations | WMI | Operational tariff | NPVrel | Energy usage ratio (%) |
CEa |
|---|---|---|---|---|---|
| [× 107 HKD] | [× 108 HKD] | kg/m2.a | |||
| 20% of submarine cable capacity upper limit | |||||
| RE1 | 0.54 | 4.56 | 17.33 | 99 | −25.69 |
| RE2 | 0.58 | 4.15 | 27.58 | 98 | −18.80 |
| RE3 | 0.60 | 4.16 | 29.85 | 100 | −17.22 |
| RE4 | 0.58 | 4.16 | 32.12 | 100 | −28.04 |
| RE5 | 0.47 | 4.95 | 24.04 | 100 | −15.80 |
| RE6 | 0.58 | 4.18 | 25.33 | 100 | −23.28 |
| RE7 | 0.58 | 4.15 | 30.03 | 100 | −27.36 |
| 30% of submarine cable capacity upper limit | |||||
| RE1 | 0.55 | 4.56 | 16.78 | 100 | −29.20 |
| RE2 | 0.58 | 4.15 | 27.71 | 100 | −27.67 |
| RE3 | 0.59 | 4.16 | 29.27 | 100 | −18.21 |
| RE4 | 0.58 | 4.16 | 31.50 | 100 | −28.64 |
| RE5 | 0.47 | 4.95 | 23.34 | 100 | −15.80 |
| RE6 | 0.58 | 4.18 | 24.60 | 100 | −23.28 |
| RE7 | 0.58 | 4.15 | 29.27 | 100 | −27.93 |
| 40% of submarine cable capacity upper limit | |||||
| RE1 | 0.55 | 4.56 | 15.93 | 100 | −29.20 |
| RE2 | 0.58 | 4.15 | 27.10 | 100 | −27.75 |
| RE3 | 0.59 | 4.16 | 28.69 | 100 | −18.21 |
| RE4 | 0.58 | 4.16 | 30.89 | 100 | −28.64 |
| RE5 | 0.47 | 4.95 | 22.63 | 100 | −15.80 |
| RE6 | 0.58 | 4.18 | 23.87 | 100 | −23.28 |
| RE7 | 0.58 | 4.15 | 28.51 | 100 | −27.93 |
- Note: (1 HKD = 0.128 USD).
The outcomes revealed that the energy usage patterns mirrored those seen in the initial charging approach. Specifically, only RE1 and RE2 exhibited energy usage below 100% when the cable capacity was at 20% of the cable capacity limit, registering at 99% and 98%, respectively. Energy matching performance slightly deteriorates compared to the first strategy, reduced by 0.01. Compared to the first charging strategy, limiting the target FSOC to the value that can satisfy the next trip during the charging process did not significantly affect the annual operational tariff and NPVrel. Across all cases, the yearly operational tariff and the NPVrel values closely resembled those of the first strategy, with variances below 0.1%. When evaluating all cases, the purely offshore configuration demonstrates inferior economic performance compared to both the half-offshore/half-nearshore and purely nearshore setups. On the other hand, the economic viability of the wind turbine-only renewable energy combination surpasses that of the FPV and TSG systems in all configurations. Energy management strategies based on electric ferries and EVs affect the economic performance of different renewable energy combinations simultaneously. Considering that the FSOC of the electric ferry was only reduced by 0.15, and the FSOC of electric cars, although the reduction reached about 0.5, the overall capacity is smaller. The total capacity and energy reduced by regulating the charging FSOC target for single electric ferry and electric cars were still too small compared to the energy scale of the harbour building. Consequently, no significant disparity in economic performance was observed. This result showed that this charging strategy, which only adjusted the FSOC target value, did not enhance the performance of the whole system, prompting the need to recalibrate the charging power and duration through the grid in the subsequent charging strategy.
6.1.3. Impact of Averaging the Charging Power
Both the initial and subsequent charging approaches focus solely on managing the FSOC. Analysing the charging power profiles, it becomes apparent that when grid electricity charges the ferry and EV batteries, they reach full capacity within a limited number of time intervals. Charging behaviour will stop without continuing throughout the entire period in which the ferry or EVs are parked. This charging pattern leads to heightened energy demands at the start of the charging process and considering that the electricity tariff models used for our system in the Hong Kong and Macau sides include the demand charge, such a result will lead to escalated electricity costs and diminished economic viability. Therefore, control strategies must be refined to address this issue. In the third charging strategy, the FSOC control remains consistent with the second strategy. If the battery is powered by a grid, the charging power of a single time step will be limited to the average value of the whole ducking period. The demand curve will be flattened out, and the total demand will be evenly distributed throughout the ducking period. The major results are shown in Table 8 and Figure 13.
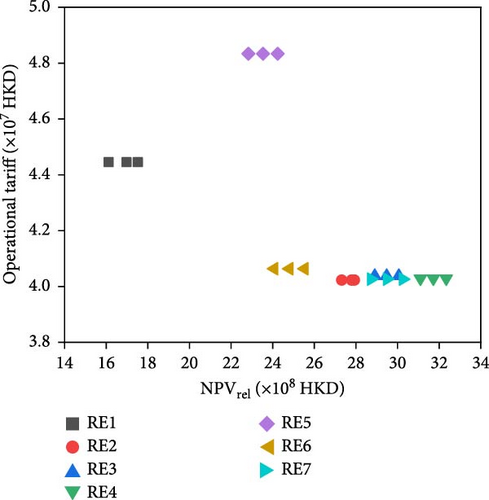
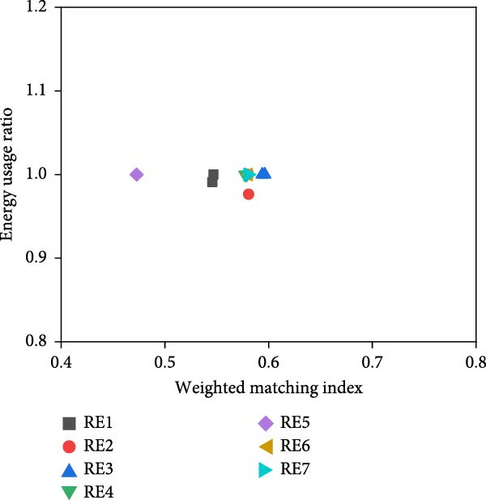
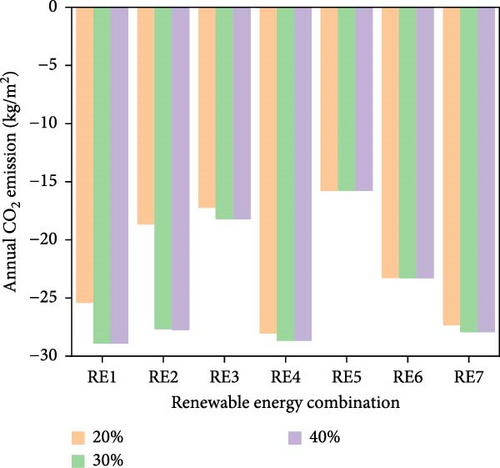
| Renewable energy combinations | WMI | Operational tariff | NPVrel | Energy usage ratio (%) |
CEa |
|---|---|---|---|---|---|
| [× 107 HKD] | [× 108 HKD] | kg/m2.a | |||
| 20% of submarine cable capacity upper limit | |||||
| RE1 | 0.55 | 4.44 | 17.52 | 99 | −25.41 |
| RE2 | 0.58 | 4.02 | 27.79 | 98 | −18.69 |
| RE3 | 0.60 | 4.04 | 30.06 | 100 | −17.24 |
| RE4 | 0.58 | 4.03 | 32.34 | 100 | −28.06 |
| RE5 | 0.47 | 4.83 | 24.24 | 100 | −15.78 |
| RE6 | 0.58 | 4.06 | 25.53 | 100 | −23.29 |
| RE7 | 0.58 | 4.03 | 30.25 | 100 | −27.34 |
| 30% of submarine cable capacity upper limit | |||||
| RE1 | 0.55 | 4.44 | 16.98 | 100 | −28.92 |
| RE2 | 0.58 | 4.02 | 27.93 | 100 | −27.67 |
| RE3 | 0.59 | 4.04 | 29.48 | 100 | −18.23 |
| RE4 | 0.58 | 4.03 | 31.72 | 100 | −28.67 |
| RE5 | 0.47 | 4.83 | 23.54 | 100 | −15.78 |
| RE6 | 0.58 | 4.06 | 24.80 | 100 | −23.29 |
| RE7 | 0.58 | 4.03 | 29.49 | 100 | −27.94 |
| 40% of submarine cable capacity upper limit | |||||
| RE1 | 0.55 | 4.44 | 16.12 | 100 | −28.92 |
| RE2 | 0.58 | 4.02 | 27.32 | 100 | −27.76 |
| RE3 | 0.59 | 4.04 | 28.90 | 100 | −18.23 |
| RE4 | 0.58 | 4.03 | 31.11 | 100 | −28.67 |
| RE5 | 0.47 | 4.83 | 22.83 | 100 | −15.78 |
| RE6 | 0.58 | 4.06 | 24.07 | 100 | −23.29 |
| RE7 | 0.58 | 4.03 | 28.73 | 100 | −27.94 |
- Note: (1 HKD = 0.128 USD).
According to the results of the third charging strategy, it can be found that the energy usage ratio is consistent with the first two charging strategies; only in the two all-offshore combinations when 20% of the capacity limit, the energy usage ratio of RE1 and RE2 is less than 100%, which is 99% and 98%, and the other combinations of the energy usage are all 100%, this is because the energy usage is only related to the capacity ratio and the energy management method, different charging strategy will not have an effect. The energy-matching performance changes are minimal compared to the previous strategy, with some combinations remaining consistent at the 2-digit decimal setting in the scenarios for specific submarine cable capacities. Different charging strategies will affect the operational tariff of the entire system and thus NPVrel. Compared to the first charging strategy, the operational tariffs are all reduced by more than 1 million HKD, with the maximum reduction percentage occurring in RE2 at 3.1% and the minimum in RE5 at 2.3%. Different submarine cable capacities did not affect the percentages of reduction in operational tariffs. Likewise, ocean energy systems solely situated nearshore exhibit superior economic performance, with offshore-only systems showing the lowest relative net present value. Wind turbines incur lower costs and deliver stronger economic outcomes when compared to FPV and TSG systems. The increasing percentages in NPVrel were less significant, occurring between 0.6% and 1.3%. The combination with the most significant increase in NPVrel is RE1 and the smallest is RE4. Meanwhile, when the submarine cable capacity was increased, there was an increasing trend in the rise of NPVrel for the same combination. Although the percentage of operational tariff decrease and NPVrel increase was insignificant, the actual reduction and increase were greater than 1 and 10 million; small percentages were caused by the enormous magnitude of two large-scale ferry terminal buildings. The outcomes indicate negative CEa values, signifying that each case successfully achieves the goal of zero emissions.
In summary, when electric ferries and electric cars only have building-to-vehicle interactions and appear as part of the energy demand in a cross-harbour system, a hybrid ocean energy system that exists both nearshore and offshore can support a system containing two large ferry terminal buildings, one electric ferry and 10 electric cars to achieve the goal of zero-emission system. Meanwhile, by adjusting the FSOC target value and the average charging power during the charging phases of these electric vehicles and ferries, there is potential to improve economic performance by lowering operational costs. Maintaining the charging power to a constant value for slow charging of electric transportation can reduce the power peaks caused by charging and reduce the demand charge, which can lead to a maximum reduction of 3.1% of the operational tariff and an increase of 1.3% of the relative net present value. In this scenario, the complex structure containing multiple demands manage to obtain a zero-emission target in all cases of hybrid ocean energy combinations, a high renewable energy self-digestion rate and economic feasibility, confirming the first contribution of this study.
6.2. Scenario 2: With Energy Sharing Function (With V2B Function)
In Scenario 2, the system from Scenario 1 integrates V2B capabilities, enabling electric vehicles and vehicle-carrying vessels to discharge energy to buildings facing shortages. The effectiveness of the designed controls and the impact of the V2B functionality on the energy sharing and the techno-economic performance of the system are examined through a series of progressively refined control strategies. Three distinct control strategies are developed based on managing the FSOC and peak power utilisation. These strategies are evaluated in separate sections to analyse their outcomes.
6.2.1. Impact of V2B Function
The initial strategy, S2CS1, maintains consistency with the best-performing approach from Scenario 1, S1CS3, with the addition of the V2B feature. The target FSOC for charging and discharging the car carrier ferry and EVs was set to fulfil the FSOC requirements for the next trip. When the car carrier ferry and the EVs were in the state of docking at the ferry terminal building, the V2B feature triggered energy discharge to the building in case of shortages, provided the FSOC exceeded the prescribed threshold. Conversely, if the FSOC were lower than this value, the B2V or G2V function would be activated to charge for the car carrier ferry and the EVs. For the car carrier ferry, the minimum FSOC that could satisfy the next trip was 0.6. Considering the lower limit FSOC of the battery was 0.2, the target FSOC of the ferry was 0.8. The minimum FSOC that can satisfy the next trip was 0.14 on the Hong Kong side and 0.04 on the Macau side, including the lower limit FSOC. The target FSOC was 0.34 and 0.24, respectively. The results and variations of their respective parameters relative to the scenario without the V2B function under this control strategy are shown in Table 9 and Figure 14.
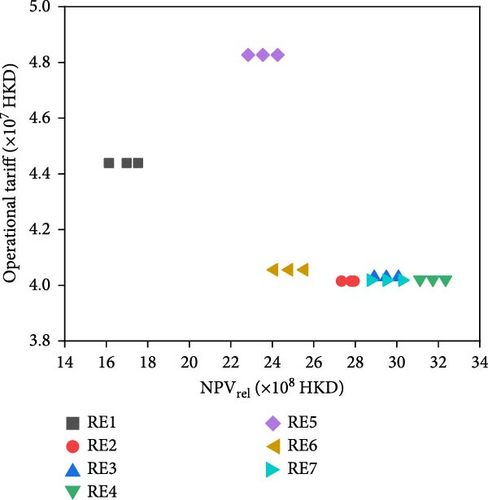
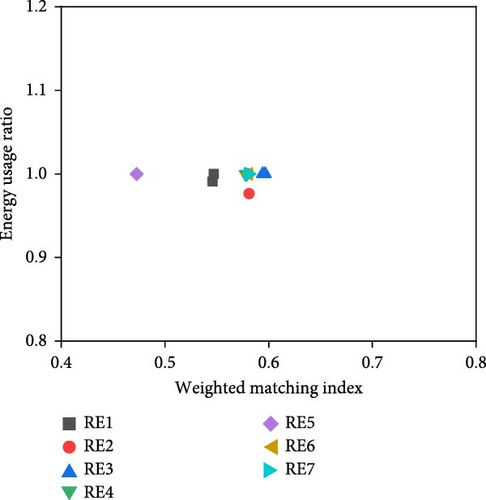
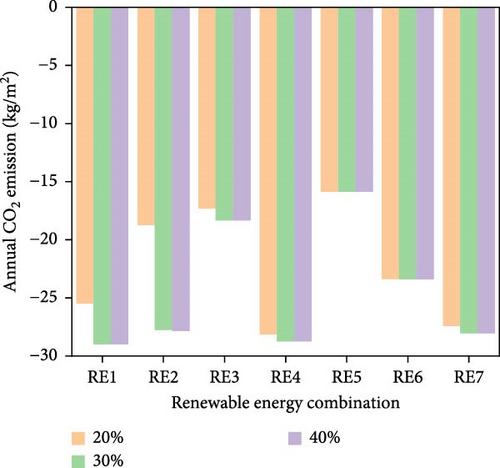
| Renewable energy combinations | WMI | WMI increase (%) |
Operational tariff | Operational tariff reduction (%) |
NPVrel | NPVrel increase (%) |
Energy usage ratio (%) |
CEa |
|---|---|---|---|---|---|---|---|---|
| [× 107 HKD] | [× 108 HKD] | kg/m2.a | ||||||
| 20% of submarine cable capacity upper limit | ||||||||
| RE1 | 0.55 | 0.04 | 4.44 | 0.15 | 17.54 | 0.06 | 99 | −25.48 |
| RE2 | 0.58 | 0.05 | 4.01 | 0.20 | 27.80 | 0.04 | 98 | −18.74 |
| RE3 | 0.60 | 0.06 | 4.03 | 0.22 | 30.08 | 0.05 | 100 | −17.32 |
| RE4 | 0.58 | 0.05 | 4.02 | 0.20 | 32.35 | 0.04 | 100 | −28.14 |
| RE5 | 0.47 | 0.03 | 4.83 | 0.14 | 24.26 | 0.05 | 100 | −15.86 |
| RE6 | 0.58 | 0.04 | 4.06 | 0.20 | 25.55 | 0.05 | 100 | −23.38 |
| RE7 | 0.58 | 0.05 | 4.02 | 0.20 | 30.26 | 0.04 | 100 | −27.43 |
| 30% of submarine cable capacity upper limit | ||||||||
| RE1 | 0.55 | 0.04 | 4.44 | 0.15 | 16.99 | 0.07 | 100 | −28.99 |
| RE2 | 0.58 | 0.05 | 4.01 | 0.20 | 27.95 | 0.05 | 100 | −27.74 |
| RE3 | 0.59 | 0.07 | 4.03 | 0.22 | 29.50 | 0.05 | 100 | −18.32 |
| RE4 | 0.58 | 0.05 | 4.02 | 0.20 | 31.74 | 0.04 | 100 | −28.74 |
| RE5 | 0.47 | 0.03 | 4.83 | 0.14 | 23.55 | 0.05 | 100 | −15.86 |
| RE6 | 0.58 | 0.04 | 4.06 | 0.20 | 24.82 | 0.06 | 100 | −23.38 |
| RE7 | 0.58 | 0.05 | 4.02 | 0.20 | 29.51 | 0.05 | 100 | −28.03 |
| 40% of submarine cable capacity upper limit | ||||||||
| RE1 | 0.55 | 0.04 | 4.44 | 0.15 | 16.13 | 0.07 | 100 | −28.99 |
| RE2 | 0.58 | 0.05 | 4.01 | 0.20 | 27.34 | 0.05 | 100 | −27.84 |
| RE3 | 0.59 | 0.07 | 4.03 | 0.22 | 28.92 | 0.05 | 100 | −18.32 |
| RE4 | 0.58 | 0.05 | 4.02 | 0.20 | 31.12 | 0.04 | 100 | −28.74 |
| RE5 | 0.47 | 0.03 | 4.83 | 0.14 | 22.84 | 0.05 | 100 | −15.86 |
| RE6 | 0.58 | 0.04 | 4.06 | 0.20 | 24.09 | 0.06 | 100 | −23.38 |
| RE7 | 0.58 | 0.05 | 4.02 | 0.20 | 28.74 | 0.05 | 100 | −28.03 |
- Note: (1 HKD = 0.128 USD).
The analysis reveals that when compared to S1CS3, lacking V2B functionality, all renewable energy combinations exhibit reduced operational tariffs. The most substantial decrease of 0.22% is observed in RE3, while RE5 sees a minor reduction of 0.14%. RE2, RE4, RE6 and RE7 display a uniform reduction of 0.2%, with RE1 experiencing a reduction of 0.15%. RE5 costs the highest electricity bill of all combinations at 4.83 × 10⁷ HKD, and RE2 has the lowest annual electricity bill at 4.01 × 10⁷ HKD. Given a single stakeholder owns the entire system, reducing operational costs will result in less economic expenditure and better economic performance for this stakeholder. Likewise, alterations in energy management strategies have not changed the ranking of economic performance among renewable energy combinations. Notably, the subsystem on the Macau side achieves a higher reduction in operational cost compared to the subsystem in Hong Kong. Alterations in the capacity of submarine cables do not affect operational tariff changes. Moreover, the integration of the V2B feature does not influence the overall system energy usage results. Regarding energy-matching efficiency, the WMI for S2CS1 marginally improves compared to the results of S1CS3 without the V2B function. The percentage increase varied between 0.03% and 0.07%. Furthermore, the results for NPVrel were similar and did not change significantly. The energy-matching parameter representing the technical performance was observed to be almost unchanged, whereas the parameter representing the environmental performance became smaller and remained negative.
6.2.2. Impact of Differentiating Charging FSOC for Renewable Energy Source
In the second control strategy, S2CS2, based on having both B2V and V2B functions, distinct FSOC values were assigned to different energy sources during the charging process, differing from S2CS1. When the energy source for the charging process was ocean renewable energy, the target FSOC would be the maximum FSOC value of 0.95 for the battery. When the energy source for the charging process is the imported energy from the grid, the target FSOC aligns with the requirement for the car carrier ferry and electric vehicles’ upcoming trips. The setting for the discharge process would be the same as the second control strategy. The energy-sharing, matching, environmental and economic results and the variations of their respective parameters relative to the scenario without the V2B function under this control strategy are shown in Table 10 and Figure 15.
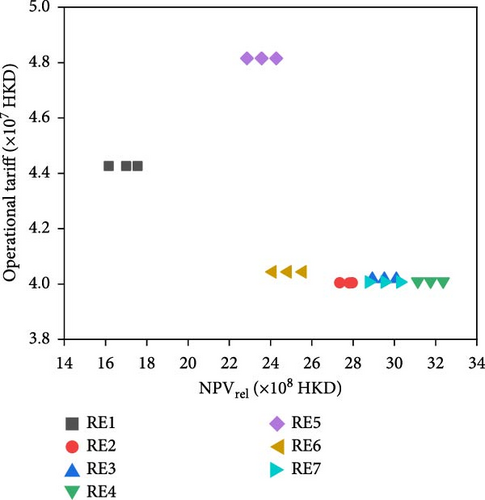
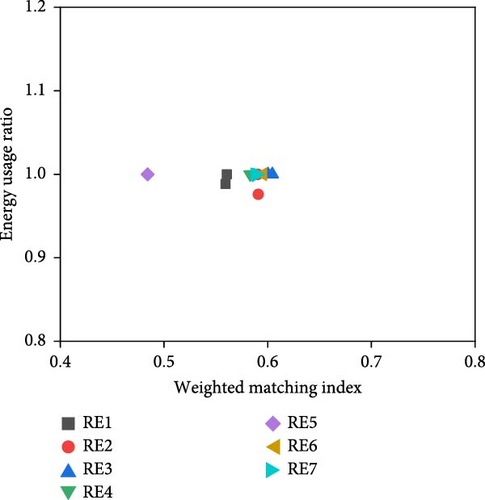
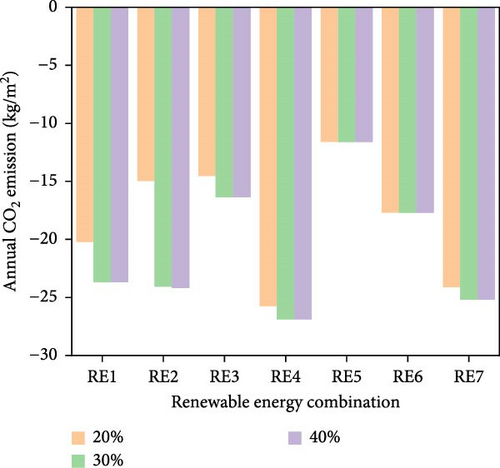
| Renewable energy combinations | WMI | WMI increase (%) |
Operational tariff | Operational tariff reduction (%) |
NPVrel | NPVrel increase (%) |
Shared energy | CEa |
|---|---|---|---|---|---|---|---|---|
| [× 107 HKD] | [× 108 HKD] | [× 107 kWh] | kg/m2.a | |||||
| 20% of submarine cable capacity upper limit | ||||||||
| RE1 | 0.56 | 2.52 | 4.43 | 0.36 | 17.56 | 0.22 | 4.38 | −20.23 |
| RE2 | 0.59 | 1.77 | 4.00 | 0.46 | 27.82 | 0.11 | 4.72 | −14.96 |
| RE3 | 0.60 | 1.37 | 4.02 | 0.50 | 30.10 | 0.11 | 4.71 | −14.54 |
| RE4 | 0.59 | 1.21 | 4.01 | 0.46 | 32.37 | 0.10 | 4.72 | −25.74 |
| RE5 | 0.48 | 2.43 | 4.82 | 0.39 | 24.28 | 0.13 | 3.94 | −11.59 |
| RE6 | 0.60 | 2.53 | 4.04 | 0.42 | 25.57 | 0.13 | 4.71 | −17.70 |
| RE7 | 0.59 | 1.56 | 4.01 | 0.46 | 30.28 | 0.10 | 4.72 | −24.12 |
| 30% of submarine cable capacity upper limit | ||||||||
| RE1 | 0.56 | 2.53 | 4.43 | 0.36 | 17.01 | 0.19 | 4.38 | −23.69 |
| RE2 | 0.59 | 1.71 | 4.00 | 0.46 | 27.96 | 0.11 | 4.73 | −24.07 |
| RE3 | 0.60 | 1.05 | 4.02 | 0.50 | 29.52 | 0.12 | 4.72 | −16.36 |
| RE4 | 0.58 | 1.00 | 4.01 | 0.46 | 31.75 | 0.10 | 4.73 | −26.88 |
| RE5 | 0.48 | 2.43 | 4.82 | 0.39 | 23.57 | 0.14 | 3.94 | −11.59 |
| RE6 | 0.60 | 2.53 | 4.04 | 0.42 | 24.84 | 0.13 | 4.71 | −17.70 |
| RE7 | 0.59 | 1.38 | 4.01 | 0.46 | 29.52 | 0.11 | 4.73 | −25.18 |
| 40% of submarine cable capacity upper limit | ||||||||
| RE1 | 0.56 | 2.53 | 4.43 | 0.36 | 16.16 | 0.20 | 4.38 | −23.69 |
| RE2 | 0.59 | 1.71 | 4.00 | 0.46 | 27.36 | 0.12 | 4.73 | −24.18 |
| RE3 | 0.60 | 1.05 | 4.02 | 0.50 | 28.94 | 0.12 | 4.72 | −16.36 |
| RE4 | 0.58 | 1.00 | 4.01 | 0.46 | 31.14 | 0.10 | 4.73 | −26.88 |
| RE5 | 0.48 | 2.43 | 4.82 | 0.39 | 22.86 | 0.14 | 3.94 | −11.59 |
| RE6 | 0.60 | 2.53 | 4.04 | 0.42 | 24.11 | 0.14 | 4.71 | −17.70 |
| RE7 | 0.59 | 1.38 | 4.01 | 0.46 | 28.76 | 0.11 | 4.73 | −25.18 |
- Note: (1 HKD = 0.128 USD).
Adjusting only the target FSOC level during charging has no impact on the energy usage ratio of the whole system. Therefore, the energy usage ratio results obtained from this charging strategy are the same as the first. In contrast, the energy usage ratio of all other combinations was 100%. Compared to the energy-matching performance of S1CS3 without the V2B function, the WMI results for S2CS2 exhibit a maximum percentage increase of 2.53% and a minimum rise of 1%. In the case of using 20% of the submarine cable maximum capacity, the WMI values stayed constant at 0.60 for RE3, and the WMI of RE6 rose from 0.58 to 0.60. Other combinations saw a WMI increase of 0.01. The combinations that maintained the same WMI as the submarine cable capacity increased shifted from RE3 to RE4. By refining the target charging FSOC level when utilising renewable energy, the electric ferry and vehicles can maximise surplus energy absorption, retaining more electricity for potential release during building shortages. This refinement enhances the system’s overall energy-matching performance, reinforcing its total energy-matching abilities. The enhanced energy-matching performance also reduced the operational tariff and strengthened economic performance by reducing the amount of shortage that needs to be covered by the grid. In comparison to the initial strategy incorporating the V2B function, S2CS1, the percentage decrease in operational tariffs more than doubles, with reductions ranging from 0.36% in RE1 to a maximum of 0.5% in RE4. RE5 still costs the highest electricity bill of all combinations at 4.82 × 10⁷ HKD, and RE2 still has the lowest annual electricity bill at 4 × 10⁷ HKD.
Meanwhile, the increase in submarine cable capacity did not affect the operational tariff and its percentage reduction. The most significant percentage of increase in NPVrel results occurred in RE1 at 0.12%, and the smallest increase occurred in RE4 and RE7 at 0.06%. The maximum result of NPVrel occurred in RE4 with 20% of the capacity limit, at 3.24 × 10⁹ HKD, and the minimum value occurs in RE1 with 40% of the capacity limit, at 1.62 × 10⁹ HKD. Similarly to Scenario 1, the increase in the capacity ratio caused NPVrel to decrease consistently for all combinations except RE2, which caused NPVrel results to increase first and then decline. Although the value of the percentage change in economic performance was not significant, it was relative to the larger scale of the whole system. The minimum decrease in operational tariff was 1.65 × 10⁵ HKD, and the minimum value of the increase in NPVrel was 3.10 × 10⁶ HKD in all cases. The energy shared via electric ferries and electric vehicles between the two regions has been computed and detailed. Among all combinations, RE5 has the lowest energy sharing at 3.94 × 10⁷ kWh, while RE2, RE4 and RE7 have shared the highest amount at 4.72 × 10⁷ kWh each. Both RE3 and RE6 have shared 4.71 × 10⁷ kWh, and RE1 has shared 4.38 × 10⁷ kWh.
6.2.3. Impact of Energy Flexibility-Based Discharging Strategy
In the third control strategy, S2CS3, the target FSOC of the charging and discharging process align with those of the second control strategy, S2CS2. However, the discharging process in S2CS3 will be adapted to optimise the demand charge, given the significant proportion of demand charge in the business models. When the electric ferry and electric car are docked at the harbour building, and the FSOC is above the level at which each can accommodate the next trip, the discharge process to the building will be activated. Monitoring the building’s energy demand at the current time step, a target value is established. If the energy demand of the building surpasses this target value, the electric ferry and electric car will discharge to the building, and if it is below this value, the electric ferry and electric vehicle will discharge to the building. If the energy demand of the building is higher than this target value, the electric ferry and electric vehicle will discharge the building. If it is lower than this target value, the electric ferry and electric car will not discharge the building. This setup aims to flatten the building’s energy demand curve, preventing sharp peaks that incur high demand charges. Three energy demand target values were set to explore the system’s performance: 4000 kW, 5000 kW and 6000 kW, respectively. The results and the variations of their respective parameters relative to the scenario without the V2B function under this control strategy are demonstrated in Figure 16.
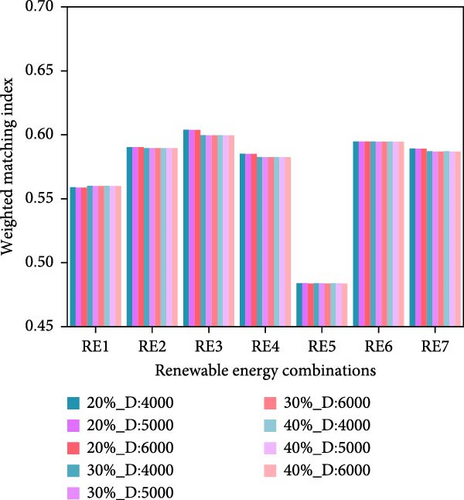
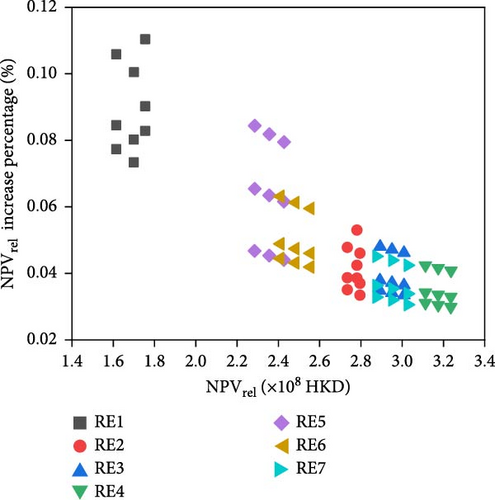
The results show that in this control strategy, setting a target value for energy demand and controlling the electric ferry and the electric vehicle discharged to reduce the shortage to this target value did not improve but instead reduced both energy-matching performance and economic performance. However, the reduction is not significant. Meanwhile, as the set target value of energy demand increased, all WMI results for the same case gradually decreased, the operational tariff for the same case gradually increased, and the NPVrel results for the same cases gradually decreased. Upon raising the demand target from 4000 to 6000, it can be observed that WMI, NPVrel, and the increase ratio of NPVrel compared to the increase ratio in the absence of the V2B function are gradually decreasing, and the maximum percentage increase in NPVrel at a demand target of 4000 is only half when compared to the outcomes of S2CS2. The result of this is that setting a target value for the demand of the V2B discharge process may cause the electric ferries and electric vehicles to have electricity in their batteries that can be released to the building at some time steps; however, at that time step, the building’s demand is lower than the set target value, the electric ferry and electric vehicles will not perform the discharge process, missing some shortage that could be partially covered. Representing such a control strategy in the system of this study did not achieve the purpose of the design.
In conclusion, the inclusion of V2B interactions for electric ferries and cars, facilitating partial energy sharing, yields a marginal enhancement in economic efficiency. This adjustment results in a modest decrease of 0.22% in operational tariffs and a meagre 0.07% peak increase in NPVrel compared to the outcomes of S1CS3. Subsequently, by regulating specific FSOC values for diverse energy sources during the charging process, the management of charging operations shows an additional improvement in economic performance when compared to scenarios where V2B interactions are introduced without control. The reductions in operational tariffs and enhancements in NPVrel more than double in magnitude. Moreover, the implementation of charge/discharge control strategies based on energy flexibility design has positively impacted economic performance. Despite this progress, the extent of the improvement is not substantial enough to be deemed highly impactful in the overall economic context. In this scenario, the presence of existent energy storage resources, electric ferries and electric vehicles establishing the V2B functionality commit to enhance energy sharing in the presence of submarine cable-based energy sharing, which improves the energy-matching rate and reduces the operational costs, confirming the third contribution of this study.
6.3. Scenario 3: Without Middle Submarine Cable, With Energy Sharing Function
The findings from Scenario 2 indicate that when a submarine cable links all sites, facilitating the transfer of renewable energy, energy distribution between Hong Kong and Macau predominantly occurs via the cable. While electric vehicles and ferries with B2V and V2B capabilities contribute to energy sharing, the overall system’s techno-economic performance sees minimal improvement due to control strategy constraints and battery limitations. To address this, the submarine cable connecting Hong Kong and Macau has been removed from this section. Consequently, energy sharing exclusively relies on electric ferries and vehicles, eliminating the submarine cable’s role in facilitating energy exchange between the two regions.
6.3.1. Investigation of Economic Performance-Based Control Strategy
The primary control principle of S3C1 was outlined earlier. To demonstrate the difference and enhancement of the V2B function on the techno-economic performance and energy-sharing performance, the results of S3C1 with only the B2V function and with both the B2V and V2B functions were shown and compared in this section. Due to the removal of intermediate submarine cables, there was only one flow of offshore renewable energy in combination with an offshore renewable energy system. Therefore, the submarine cable capacity was maintained at 100% of its maximum to prevent any excess energy. The energy-matching, economic and environmental results under this control strategy are shown in Figure 17 and Table 11.
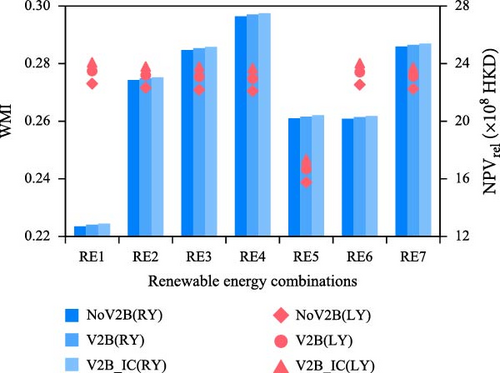
| Group name | Parameters | Units | RE1 | RE2 | RE3 | RE4 | RE5 | RE6 | RE7 |
|---|---|---|---|---|---|---|---|---|---|
| No V2B | WMI | — | 0.27 | 0.27 | 0.27 | 0.27 | 0.24 | 0.27 | 0.27 |
| Operational tariff | × 107 HKD | 7.36 | 7.36 | 7.37 | 7.34 | 7.71 | 7.35 | 7.35 | |
| NPVrel | × 108 HKD | 12.70 | 22.86 | 24.95 | 27.29 | 20.20 | 20.17 | 25.19 | |
| CEa | kg (m)2.a | −6.09 | −10.17 | −5.41 | −10.70 | −5.51 | −6.50 | −10.58 | |
| V2B | WMI | — | 0.28 | 0.28 | 0.28 | 0.27 | 0.24 | 0.28 | 0.28 |
| WMI increase | — | 1.60% | 1.60% | 1.67% | 1.60% | 1.94% | 1.59% | 1.60% | |
| Operational tariff | × 107 HKD | 7.29 | 7.29 | 7.29 | 7.26 | 7.64 | 7.27 | 7.27 | |
| Operational tariff reduction | — | 0.98% | 0.98% | 1.03% | 1.05% | 0.91% | 1.00% | 1.00% | |
| NPVrel | × 108 HKD | 12.81 | 22.97 | 25.07 | 27.41 | 20.31 | 20.28 | 25.31 | |
| NPVrel increase | — | 0.87% | 0.48% | 0.48% | 0.45% | 0.55% | 0.57% | 0.46% | |
| CEa | kg/m2.a | −8.23 | −12.30 | −7.42 | −12.66 | −7.59 | −8.52 | −12.60 | |
| V2B_IC | WMI | — | 0.28 | 0.28 | 0.28 | 0.28 | 0.25 | 0.28 | 0.28 |
| WMI increase | — | 2.72% | 2.73% | 3.00% | 2.95% | 3.37% | 2.75% | 2.76% | |
| Operational tariff | × 107 HKD | 7.24 | 7.24 | 7.24 | 7.21 | 7.59 | 7.23 | 7.23 | |
| Operational tariff reduction | — | 1.63% | 1.63% | 1.74% | 1.74% | 1.64% | 1.64% | 1.64% | |
| NPVrel | × 108 HKD | 12.89 | 23.05 | 25.16 | 27.50 | 20.41 | 20.37 | 25.39 | |
| NPVrel increase | — | 1.53% | 0.85% | 0.85% | 0.77% | 1.03% | 0.98% | 0.78% | |
| CEa | kg/m2.a | −10.19 | −14.27 | −9.61 | −14.90 | −9.70 | −10.48 | −14.56 | |
- Note: (1 HKD = 0.128 USD).
As this control strategy aims to maximise the feed-in tariff, all the generation in Macao was sent to the grid. This means that building demand is solely satisfied by the grid, resulting in low WMI results representing energy-matching performance. Compared to cases without the V2B function, the cases with the V2B function improved their energy-matching performance, with a minimum percentage improvement of 1.60% occurring in RE1, RE2, RE4 and RE7 and a maximum percentage improvement of 1.94% occurring in RE5. For the WMI results themselves, RE5, which has the most significant percentage improvement, has the smallest WMI result at 0.24, while RE1, RE2, RE3, RE6 and RE7 all have WMI results of 0.28, and RE4 has a WMI value of 0.27. With the addition of the V2B feature, the maximum increase in WMI is 0.01. Adding the V2B function to the case also enhanced the economic performance. The annual operational tariff has been reduced by a percentage ranging from 0.91% to 1.05%. In all cases, the annual electricity bill exceeded 7 × 10⁷ HKD. The actual reduction in operational tariff ranged from 7.05 × 10⁵ to 7.69 × 10⁵ HKD (1 HKD = 0.128 USD). Compared to the Scenario 2 case, the percentage reduction in annual operational tariffs increased more than twice. NPVrel also showed varying degrees of increase, with the most significant percentage increase occurring in RE1 at 0.87% and the smallest increase occurring in RE7 at 0.46%. The actual increase in the NPVrel values ranged from 1.10 × 10⁷ to 1.23 × 10⁷ HKD. The maximum value for the NPVrel results was 2.74 × 10⁹ HKD, which occurred in RE4, and the minimum value was 1.28 × 10⁹ HKD, which occurred in RE1. RE1 has the most significant percentage increase in NPVrel because its original benchmark was smaller, so the percentage is more significant than the other combinations. Based on such a strategy, the power input from the grid reaches the maximum value in all scenarios, thus leading to the highest CEa. In the absence of V2B, RE3 has the largest CEa of −5.41 kg/m2, and RE4 has the smallest CEa of 10.17 kg/m2. All combinations result in negative carbon emissions, representing a zero-emission system for the system in all cases. With the addition of V2B, the CEa of all combinations was further reduced by at least 2 kg/m2.
By reducing the energy consumption of the electric ferry, the study revealed significant enhancements in energy-matching and economic performance. The energy-matching performance, as indicated by the WMI parameter, saw a minimum increase of 2.72% and a maximum rise of 3.37% relative to the cases with original energy consumption per kilometre. In terms of economic performance, the operational tariff showcased a minimum reduction of 1.63% and a maximum decrease of 1.74%. For the NPVrel, the minimum value of the increase percentage could be improved to 0.77%, and the maximum value could be improved to 1.53%.
When energy sharing and exchange were conducted only by mobile electric transport, although changes in energy sharing could be captured by changes in energy matching and economic results, these two indicators did not directly present specific energy sharing and exchange levels. The energy exchanged from one side of Hong Kong or Macau to the other via electric ferry and electric vehicles directly through simulation should be calculated and demonstrated. Considering that energy from both sides being charged into the battery may exist simultaneously, it is difficult to differentiate and track the exact source of this energy. Therefore, some assumptions were made to calculate the amount of shared energy. First, the energy in the battery will be assumed to be adequately mixed, and the energy from both sides will be presented proportionally. When the battery is discharged, the source of the discharged energy will be calculated based on this ratio. The energy from Macau discharged in Hong Kong and the Hong Kong energy discharged in Macau will be considered shared energy. In this control strategy, the actual energy transferred from Hong Kong to Macau and Macau to Hong Kong is shown in Figure 18.
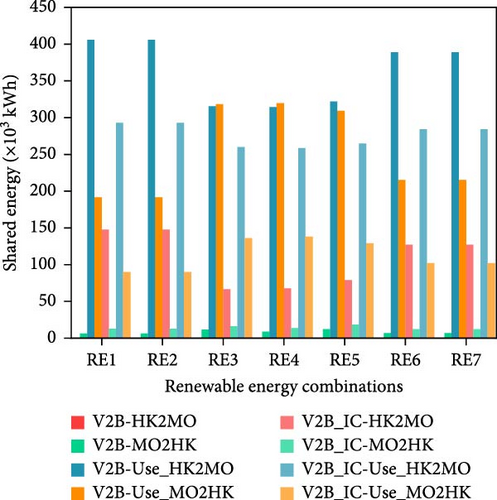
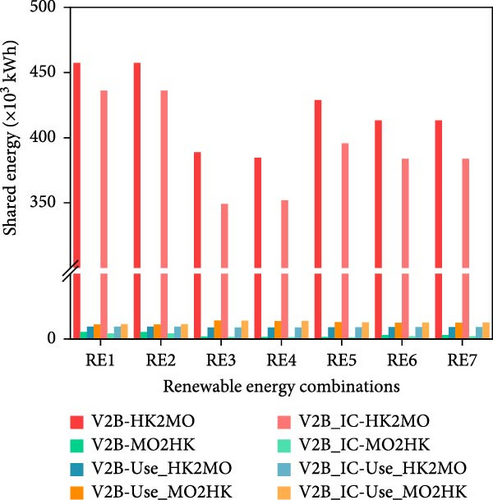
Through the results, it can be found that in the case of energy sharing to cover the building shortage by mobile electric transport only, electric vehicles played a primary role. For an electric car carrying ferry, if the energy used by itself was not considered, energy sharing occurred unidirectionally from Macao to Hong Kong, resulting in zero energy discharge from Hong Kong to Macao. The energy shared from Macau to Hong Kong varies from 6.36 to 12.19 × 10³ kWh, with the maximum occurring in RE5 and the minimum in RE1 and RE2. If the energy use of the electric ferry was considered, the energy sharing became bidirectional, and the energy from Hong Kong used in the Macao region was more significant than the reverse. For electric vehicles, the energy sharing was always bidirectional. Contrary to the electric ferry, more energy was shared from Hong Kong to the Macau side when only discharging to the building to cover the shortage was considered. The energy shared from Hong Kong to Macau varies from 3.84 to 4.57 × 10⁵ kWh, with maximum values occurring in RE1 and RE2 and minimum values in RE4. When only the energy used by electric vehicles was considered, more energy from Macau was used on the Hong Kong side.
6.3.2. Investigation of Energy Matching-Based Control Strategy
Similarly to S3C1, under the control of S3C2, the results of the cases with only the B2V function and with the addition of the V2B function were presented simultaneously for comparison to indicate the impact of the V2B function. The techno-economic and environmental results under this control strategy are shown in Figure 19 and Table 12.
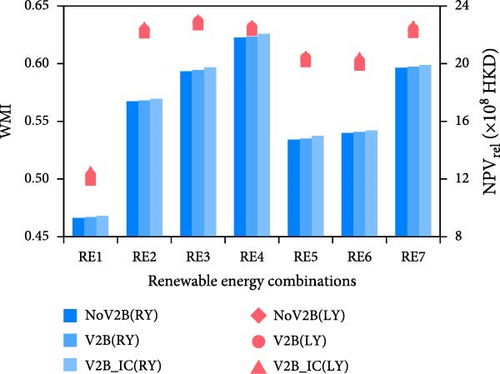
| Group name | Parameters | Units | RE1 | RE2 | RE3 | RE4 | RE5 | RE6 | RE7 |
|---|---|---|---|---|---|---|---|---|---|
| No V2B | WMI | — | 0.50 | 0.63 | 0.63 | 0.63 | 0.60 | 0.60 | 0.63 |
| Operational tariff | × 107 HKD | 5.20 | 4.05 | 4.04 | 4.01 | 4.38 | 4.30 | 4.03 | |
| NPVrel | × 108 HKD | 9.30 | 17.40 | 19.47 | 21.81 | 14.73 | 15.20 | 19.72 | |
| CEa | kg/m2.a | −4.33 | −8.58 | −3.72 | −9.02 | −3.83 | −4.76 | −9.05 | |
| V2B | WMI | — | 0.50 | 0.63 | 0.64 | 0.63 | 0.61 | 0.60 | 0.63 |
| WMI increase | — | 0.91% | 0.48% | 0.50% | 0.50% | 0.61% | 0.70% | 0.55% | |
| Operational tariff | × 107 HKD | 5.14 | 4.00 | 3.99 | 3.97 | 4.33 | 4.24 | 3.98 | |
| Operational tariff reduction | — | 1.31% | 1.08% | 1.21% | 1.21% | 1.15% | 1.41% | 1.25% | |
| NPVrel | × 108 HKD | 9.36 | 17.44 | 19.55 | 21.89 | 14.81 | 15.27 | 19.78 | |
| NPVrel increase | — | 0.71% | 0.25% | 0.41% | 0.37% | 0.53% | 0.43% | 0.29% | |
| CEa | kg/m2.a | −6.53 | −10.18 | −6.08 | −11.40 | −6.06 | −6.69 | −10.83 | |
| V2B_IC | WMI | — | 0.51 | 0.63 | 0.64 | 0.63 | 0.61 | 0.61 | 0.63 |
| WMI increase | — | 1.58% | 0.86% | 0.75% | 0.75% | 0.84% | 1.20% | 0.96% | |
| Operational tariff | × 107 HKD | 5.07 | 3.95 | 3.93 | 3.91 | 4.27 | 4.18 | 3.92 | |
| Operational tariff reduction | — | 2.50% | 2.53% | 2.61% | 2.66% | 2.47% | 2.81% | 2.73% | |
| NPVrel | × 108 HKD | 9.44 | 17.56 | 19.74 | 22.08 | 15.00 | 15.36 | 19.90 | |
| NPVrel increase | — | 1.56% | 0.93% | 1.37% | 1.24% | 1.82% | 1.06% | 0.91% | |
| CEa | kg/m2.a | −8.34 | −12.07 | −8.32 | −13.67 | −8.37 | −8.55 | −12.76 | |
- Note: (1 HKD = 0.128 USD).
Unlike S3C1, which prioritises economic performance, S3C2 focuses on maximising energy-matching efficiency. Here, the generated renewable energy is primarily directed towards meeting the building’s energy needs rather than exporting energy to maximise feed-in tariffs. In S3C2 scenarios incorporating the V2B function, the WMI values ranged from 0.50 to 0.64, with RE1 showing the lowest and RE3 the highest WMI results. Compared to the cases without the V2B function, the minimum percentage increase of WMI was 0.48% in RE2, and the maximum percentage increase of WMI was 0.91% in RE1. The largest increase in WMI was 0.01, occurring in RE3 and RE5, with all other combinations having increases less than this. In the case of the modified ferry energy consumption, RE1 and RE6 also showed a 0.01 increase in WMI. The percentage increase in WMI was more minor compared to the S3C1 cases because the benchmark for the percentage calculation was more significant.
Meanwhile, the annual operational cost reduction could reach 1.08% in RE2 and 1.41% in RE6 compared to the cases without the V2B function. The minimum reduction was 4.36 × 10⁵ HKD in RE2, and the maximum reduction was 6.83 × 10⁵ HKD in RE1. RE4, one of the best-performing combinations in terms of energy matching, was able to achieve the lowest operational tariff due to less shortage, at 4.01 × 10⁷ HKD without V2B and 3.97 × 10⁷ HKD with V2B. NPVrel results could be improved by 0.25% in RE2 to 0.71% in RE1. The minimum increase was 4.41 × 10⁶ HKD in RE2, and the maximum reduction was 8 × 10⁶ HKD in RE4. Among all the renewable energy combinations, RE4 has the highest NPVrel result, and RE1 has the most minor NPVrel result, 2.19 × 10⁹ HKD and 9.36 × 10⁸ HKD, respectively. Compared to S3C1, the reduction percentage of the operational tariff was more significant, and the increase percentage of NPVrel was smaller.
With more minor energy consumption, energy-matching and economic performance could be enhanced under the control strategy S3C2. On the parameter, WMI of energy-matching performance, the minimum value of the increasing percentage compared to the cases without V2B function increased to 0.75% and the maximum value to 1.58% relative to the cases with original energy consumption per kilometre. On the parameter operational tariff of economic performance, the minimum value of the reduction percentage increased to 2.47%, and the maximum value increased to 2.81%. For the NPVrel, the minimum value of the increase percentage could be improved to 0.91%, and the maximum value could be improved to 1.82%.
Under the control of S3C2, the actual shared energy to cover the building shortage and for its own travel purposes was also demonstrated in Figure 20.
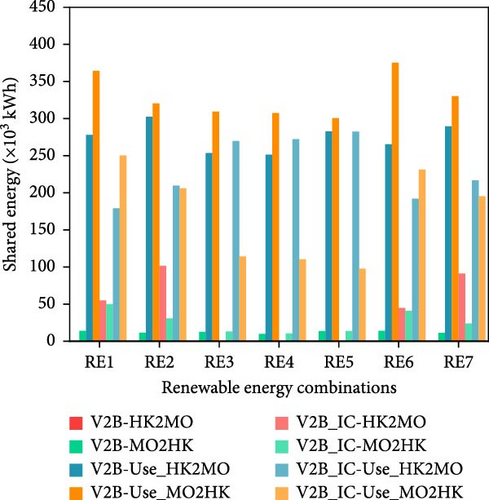
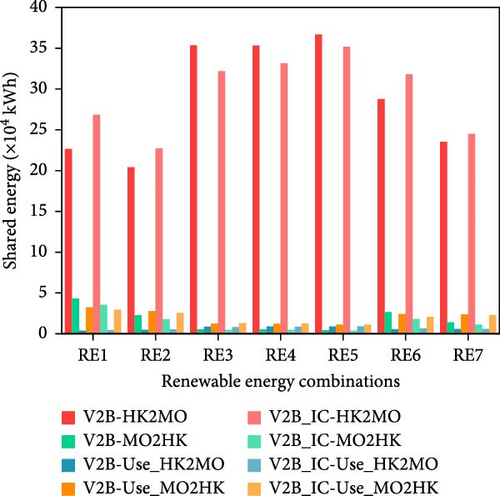
The findings in S3C2 exhibited similarities in magnitude to those of S3C1. Nonetheless, variations in results emerged due to distinct renewable energy combinations driven by varying control strategies. The inclusion of a charging process from Macau in this strategy led to a noticeable increase in energy shared from Macau to Hong Kong by both electric ferries and vehicles. The minimum value of energy shared from Macau to Hong Kong based on the electric ferry was 9.88 × 10³ kWh, and the maximum value was 13.9 × 10³ kWh. The energy that EVs were able to share from Macao to Hong Kong ranges between 4.52 × 10³ and 43.42 × 10³ kWh, with the maximum value combinations all being RE1. However, the EVs were able to share more than 2.04 × 10⁵ kWh of energy from Hong Kong to Macau. Meanwhile, the relationship between the magnitude of the shared energy used during the journey of the electric ferry changed. The energy shared from Macau to Hong Kong surpassed that from Hong Kong to Macau, reflecting the strategy’s emphasis on charging electric ferries and vehicles on the Macau side first using surplus renewable energy to their maximum capacity before resorting to grid charging. Scenarios with modified ferry energy consumption increased the shared energy in two-way energy sharing for ferries and for EVs from Hong Kong to Macau. However, there was a decrease in the energy shared by EVs from Macau to Hong Kong. This approach facilitated increased sharing of renewable energy from Macau. The duration curves of the renewable energy generation, system demand, surplus and shortage of RE4 in three scenarios were displayed in Figure 21, demonstrating that the studied system in all three proposed scenarios achieved the target of zero-emission.
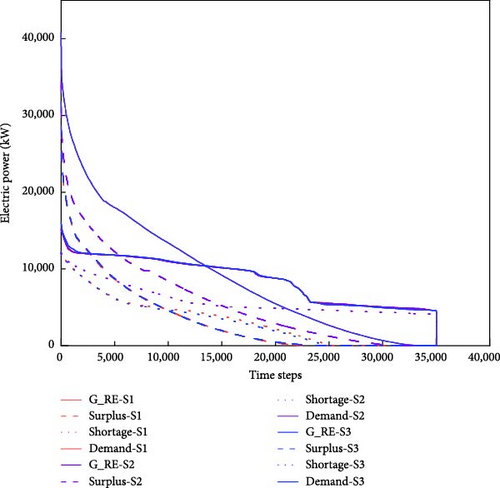
In Scenario 2, the transfer and sharing of energy between Hong Kong and Macao predominantly rely on submarine cables. By eliminating the central submarine cable, energy exchange occurs solely through electric ferries and vehicles commuting between the two cities in Scenario 3. Findings from S3C1 and S3C2 reveal that utilising electric ferries and vehicles for energy exchange enhances techno-economic performance compared to Scenario 2. However, to achieve a 2% or greater enhancement, further progress is necessary due to the substantial contrast in energy capacities between the zero-emission transport modes and the two prominent harbour structures. The disparity in energy scales between the zero-emission transportation options and the large harbour buildings poses a challenge for achieving significant improvements in techno-economic performance. Moreover, the restricted docking periods of electric transport vehicles, potential mismatches in timing with renewable energy generation, the battery capacity and travel energy consumption are parameters that can significantly affect techno-economic performance. The results of this scenario demonstrate the effectiveness of an energy-sharing management strategy for cross-harbour energy systems with V2B-capable electric transportation, as well as the effectiveness of energy sharing over submarine cables, while confirming the second and third contributions of this study.
6.4. Individual Analyses of Subsystems
Although under the ownership of a single stakeholder, the system can be categorised into three sub-systems that are relatively independent but can exchange energy via submarine cables or one of them itself. Two of the three sub-systems are buildings in Macau and Hong Kong and their supporting renewable energy systems, while the third sub-system is the electric ferry and EVs that can be used for energy-sharing functions in addition to their transport purposes. Through the results presented and analysed in the previous section, based on the same stakeholder’s perspective, the electric ferries and EVs with the V2B function can improve the performance of the system to a certain extent after applying the designed control methods. Enhanced performance as an individual system does not mean that the performance of all sub-systems can be enhanced. Therefore, this subsection utilises energy matching, operational tariffs and imported grid energy of electric ferries and EVs to evaluate the performance of individual sub-systems in various scenarios. For the sub-system of electric ferries and EVs, this parameter can reflect the impact of this sub-system on the economic performance since the imported energy from the Macau and Hong Kong grids will be added to the calculation of the operational tariffs of the other two sub-systems, which in consequence will affect the system’s cost and NPVrel. The results of one selected renewable energy combination, RE4, are shown in Table 13.
| Selected cases from RE4 | Energy matching (WMI) | Operational tariff | Imported energy for ferry and EVs | |||
|---|---|---|---|---|---|---|
| [× 106 HKD] | [× 104 kWh] | |||||
| HK | MO | HK | MO | HK | MO | |
| S1C3-RE4 | 0.65 | 0.53 | 15.03 | 25.26 | 12.39 | 65.49 |
| S2C2-RE4 | 0.66 | 0.53 | 14.97 | 25.14 | 11.43 | 59.19 |
| S3C2-RE4-No V2B | 0.642 | 0.619 | 19.91 | 20.69 | 0.68 | 54.51 |
| S3C2-RE4-V2B | 0.643 | 0.622 | 19.35 | 20.30 | 27.12 | 47.87 |
- Note: (1 HKD = 0.128 USD).
In Scenarios 1 and 2, which have submarine cables connecting all locations, the results of Scenario 2, which incorporates the V2B function, can be seen to improve the performance of all three subsystems compared to Scenario 1, which has only the B2V function. The increase in WMI results is not significant and occurs only in the Hong Kong subsystem with an increase of 0.01, while the WMI for the Macau subsystem is essentially unchanged. In terms of economic performance, the inclusion of the V2B function reduces the operational tariff of the Macau and Hong Kong subsystems by 12 × 104 HKD and 6 × 10⁴ HKD (1 HKD = 0.128 USD), respectively, with the Macau subsystem experiencing an even larger reduction. Meanwhile, the energy demand for electric ferries and EVs that need to be covered by the Macao and Hong Kong power grids has also been reduced by 6.3 × 10⁴ kWh and 0.96 × 10⁴ kWh, respectively. In Scenario 3 without the intermediate submarine cables, for the Macau and Hong Kong subsystems, a similar trend can be found for the results with both B2V and V2B functions compared to the results with just the B2V function, with some enhancement of the technical and economic performance. The WMI for the Macao and Hong Kong subsystems increased by 0.03 and 0.01, respectively, and the operational tariff decreased by 3.9 × 10⁵ HKD and 5.6 × 10⁵ HKD. Although the energy demand for electric ferry and EVs from the Macao grid has similarly decreased by 6.64 × 10⁴ kWh, their energy demand from the Hong Kong grid has increased by 26.44 × 10⁴ kWh, which negatively impacted the performance.
7. Sensitivity Analysis
7.1. Impact of Ferry Travel Schedule and Ferry Travel Energy Consumption
Considering the impact of travel energy consumption, required FSOC levels for a journey and docking durations on energy-sharing limitations, a new set of theoretical scenarios was devised to explore how ferry travel schedules and energy usage affect energy-sharing efficiency. These cases involved adjusting the travel schedules, prompting electric ferries and cars to travel directly between Hong Kong and Macau without detours, reducing single trip distances from 50 to 45 km and increasing harbour stoppage times by 4 h per day. The modified schedules excluded offshore stops, enhancing efficiency by shortening travel distances and increasing time spent at harbour buildings. At the same time, business trip schedules for electric vehicles on land remained unchanged. Furthermore, under the condition that the travelling schedules are changed, in addition to one group of cases where the original energy consumption of the electric ferries is maintained, an additional group of cases with minor energy consumption of the electric ferry are also included. The techno-economic and environmental performance of both S3C1 and S3C2 are shown in Figure 22 and Table 14.
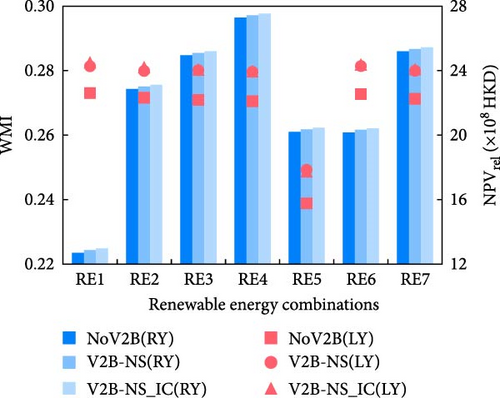
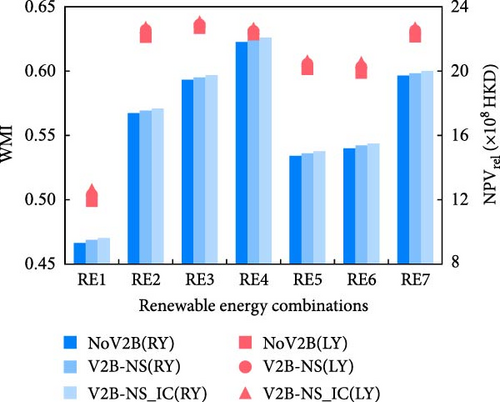
| Groups | Parameters | Units | RE1 | RE2 | RE3 | RE4 | RE5 | RE6 | RE7 |
|---|---|---|---|---|---|---|---|---|---|
| S3C1 | |||||||||
| NS | WMI | — | 0.28 | 0.28 | 0.28 | 0.28 | 0.25 | 0.28 | 0.28 |
| WMI increase | — | 2.31% | 2.32% | 2.36% | 2.25% | 2.78% | 2.20% | 2.21% | |
| Operational tariff | × 107 HKD | 7.25 | 7.25 | 7.28 | 7.25 | 7.61 | 7.25 | 7.25 | |
| Operational tariff reduction | — | 1.44% | 1.44% | 1.22% | 1.24% | 1.30% | 1.30% | 1.30% | |
| NPVrel | × 108 HKD | 12.8 | 23.03 | 25.09 | 27.44 | 20.36 | 20.32 | 25.35 | |
| NPVrel increase | — | 1.33% | 0.74% | 0.57% | 0.53% | 0.77% | 0.75% | 0.60% | |
| CEa | kg/m2.a | −7.51 | −11.58 | −7.18 | −12.50 | −7.18 | −7.99 | −12.07 | |
| NS_IC | WMI | — | 0.28 | 0.28 | 0.28 | 0.28 | 0.25 | 0.28 | 0.28 |
| WMI increase | — | 3.44% | 3.45% | 3.44% | 3.42% | 4.12% | 3.34% | 3.35% | |
| Operational tariff | × 107 HKD | 7.20 | 7.20 | 7.22 | 7.19 | 7.55 | 7.19 | 7.19 | |
| Operational tariff reduction | — | 2.21% | 2.21% | 2.00% | 2.03% | 2.04% | 2.08% | 2.08% | |
| NPVrel | × 108 HKD | 12.97 | 23.13 | 25.19 | 27.54 | 20.46 | 20.42 | 25.45 | |
| NPVrel increase | — | 2.11% | 1.17% | 0.98% | 0.90% | 1.27% | 1.25% | 1.00% | |
| CEa | kg/m2.a | −9.50 | −13.57 | −9.05 | −14.55 | −9.22 | −10.01 | −14.09 | |
| S3C2 | |||||||||
| NS | WMI | — | 0.50 | 0.63 | 0.64 | 0.63 | 0.61 | 0.60 | 0.63 |
| WMI increase | — | 1.03% | 0.90% | 0.43% | 0.43% | 0.71% | 0.82% | 0.79% | |
| Operational tariff | × 107 HKD | 5.12 | 3.96 | 3.98 | 3.96 | 4.30 | 4.23 | 3.96 | |
| Operational tariff reduction | — | 1.52% | 2.13% | 1.40% | 1.45% | 1.72% | 1.62% | 1.92% | |
| NPVrel | × 108 HKD | 9.50 | 17.55 | 19.61 | 21.95 | 14.89 | 15.38 | 19.87 | |
| NPVrel increase | — | 2.21% | 0.87% | 0.73% | 0.67% | 1.06% | 1.16% | 0.73% | |
| CEa | kg/m2.a | −6.75 | −10.20 | −5.82 | −11.15 | −6.11 | −7.03 | −10.74 | |
| NS_IC | WMI | — | 0.51 | 0.63 | 0.64 | 0.63 | 0.61 | 0.61 | 0.63 |
| WMI increase | — | 1.78% | 1.20% | 0.77% | 0.75% | 1.05% | 1.39% | 1.10% | |
| Operational tariff | × 107 HKD | 5.06 | 3.92 | 3.93 | 3.91 | 4.25 | 4.17 | 3.91 | |
| Operational tariff reduction | — | 2.74% | 3.27% | 2.64% | 2.62% | 2.87% | 3.03% | 3.06% | |
| NPVrel | × 108 HKD | 9.61 | 17.68 | 19.75 | 22.09 | 15.02 | 15.49 | 20.00 | |
| NPVrel increase | — | 3.40% | 1.61% | 1.42% | 1.28% | 1.95% | 1.91% | 1.39% | |
| CEa | kg/m2.a | −8.78 | −12.10 | −7.78 | −13.08 | −8.13 | −9.04 | −12.64 | |
- Note: (1 HKD = 0.128 USD).
Based on the results, it can be found that when only the travel schedule of the electric ferry and electric vehicles was modified to increase the length of the docking time, both the matching and economic results were improved compared to the original running time. For the first control strategy, S3C1, the percentage increase in the energy-matching performance parameter WMI compared to the scenario without the V2B function ranges from 2.20% to 2.78%. The reduction percentage of the first economic parameter operational tariff has increased from 1.22% to 1.44% compared to the original schedule, and the increasing percentage of the other economic parameter NPVrel has increased from 0.53% to 1.33% compared to the cases with the original schedule. For the second control strategy, S3C2, the cases with new schedules also improve the techno-economic performance. The increase percentage of WMI results ranged from 0.43% to 1.03%, the reduction percentage of operational tariff ranged from 1.40% to 2.13% and the increase percentage of NPVrel ranged from 0.67% to 2.21%. Therefore, the increase in techno-economic results under different control strategies demonstrated that prolonging the interaction time between mobile electric vehicles and harbour buildings can effectively enhance energy-matching and economic performance. Furthermore, in line with both control strategies, scenarios featuring reduced energy consumption by the electric ferry were incorporated following the adjusted travel timetable. The decrease in energy usage by the electric ferry facilitated a greater reserve battery capacity for energy-sharing purposes. This led to improved energy-matching capabilities and economic efficiency compared to earlier instances.
Furthermore, the actual shared energy of S3C1 and S3C2 to cover the building shortage and for their own travel purpose was also demonstrated in Table 15.
| Illustrative cases | Electric car-carrying ferry | Electric vehicles | ||||||
|---|---|---|---|---|---|---|---|---|
| HK2MO | MO2HK | Use_ HK2MO |
Use_ MO2HK |
HK2MO | MO2HK | Use_ HK2MO |
Use_ MO2HK |
|
| [× 103 kWh] | ||||||||
| S3C1-NS | ||||||||
| RE1 | 0.00 | 27.22 | 366.56 | 247.73 | 399.67 | 24.15 | 6.14 | 8.01 |
| RE2 | 0.00 | 27.22 | 366.56 | 247.73 | 399.67 | 24.15 | 6.14 | 8.01 |
| RE3 | 0.00 | 32.70 | 366.16 | 248.50 | 388.80 | 25.36 | 6.35 | 7.87 |
| RE4 | 0.00 | 27.16 | 366.62 | 247.67 | 394.09 | 24.11 | 6.18 | 7.98 |
| RE5 | 0.00 | 37.00 | 374.24 | 240.81 | 454.37 | 21.26 | 5.58 | 8.13 |
| RE6 | 0.00 | 27.19 | 366.59 | 247.70 | 398.58 | 24.12 | 6.16 | 8.02 |
| RE7 | 0.00 | 27.19 | 366.59 | 247.70 | 398.58 | 24.12 | 6.16 | 8.02 |
| S3C1-NS_IC | ||||||||
| RE1 | 0.00 | 30.93 | 314.13 | 94.11 | 419.68 | 22.14 | 6.20 | 7.98 |
| RE2 | 0.00 | 30.93 | 314.13 | 94.11 | 419.68 | 22.14 | 6.20 | 7.98 |
| RE3 | 0.00 | 36.93 | 312.67 | 95.64 | 390.98 | 23.31 | 6.51 | 7.93 |
| RE4 | 0.00 | 30.78 | 314.49 | 93.76 | 424.39 | 21.92 | 6.24 | 7.97 |
| RE5 | 0.00 | 36.72 | 321.53 | 86.76 | 477.21 | 19.11 | 5.83 | 8.07 |
| RE6 | 0.00 | 30.84 | 314.34 | 93.91 | 424.38 | 21.93 | 6.23 | 8.00 |
| RE7 | 0.00 | 30.84 | 314.34 | 93.91 | 424.38 | 21.93 | 6.23 | 8.00 |
| S3C2-NS | ||||||||
| RE1 | 0.00 | 28.34 | 359.21 | 252.00 | 346.38 | 22.71 | 6.02 | 7.66 |
| RE2 | 0.00 | 28.50 | 358.03 | 253.16 | 241.29 | 21.38 | 7.90 | 7.18 |
| RE3 | 0.00 | 34.70 | 355.45 | 255.34 | 237.51 | 22.91 | 7.81 | 7.05 |
| RE4 | 0.00 | 28.37 | 358.34 | 252.87 | 241.11 | 21.33 | 7.92 | 7.17 |
| RE5 | 0.00 | 38.82 | 368.09 | 244.36 | 317.59 | 18.87 | 7.04 | 7.50 |
| RE6 | 0.00 | 28.30 | 359.18 | 252.04 | 316.16 | 21.56 | 6.99 | 7.29 |
| RE7 | 0.00 | 28.44 | 358.14 | 253.06 | 248.97 | 21.23 | 7.93 | 7.14 |
| S3C2-NS_IC | ||||||||
| RE1 | 0.00 | 35.21 | 303.19 | 102.97 | 383.02 | 19.00 | 5.67 | 7.81 |
| RE2 | 0.00 | 35.30 | 302.99 | 102.71 | 254.72 | 17.30 | 7.81 | 7.14 |
| RE3 | 0.00 | 43.58 | 298.44 | 107.15 | 264.93 | 18.61 | 7.74 | 7.16 |
| RE4 | 0.00 | 35.15 | 303.14 | 102.57 | 259.99 | 17.43 | 7.81 | 7.16 |
| RE5 | 0.00 | 41.47 | 312.69 | 93.59 | 344.88 | 15.67 | 7.00 | 7.29 |
| RE6 | 0.00 | 35.13 | 303.28 | 102.88 | 345.47 | 18.54 | 6.68 | 7.60 |
| RE7 | 0.00 | 35.21 | 303.07 | 102.64 | 264.92 | 17.17 | 7.84 | 7.04 |
The results show that in all cases where the new travel schedule was applied, the energy shared from the Hong Kong side to the Macao side by electric ferry was zero. In contrast, the energy shared from the Hong Kong side to the Macao side by electric vehicles was more than that in the cases where the original travel schedule was applied. The cases using the new travel schedule with longer interaction times with two harbour buildings shared more energy from Hong Kong to Macau and from Macau to Hong Kong through electric ferry and electric cars than the cases using the original schedule. Furthermore, the total level of shared energy of the illustrative cases using less energy consumption of the electric ferry has been further improved.
7.2. Impact of Feed-in Tariff
The previous NPVrel outcomes were calculated with a feed-in tariff, which is a government subsidy aimed at supporting renewable energy development and potentially straining governmental finances. As a result, considerable interest surrounds the economic efficacy of a zero-emission building system without feed-in tariff assistance. A sensitivity analysis was conducted in the absence of a feed-in tariff to evaluate the economic viability of the examined system. Similarly to the previous subsection, the cases under the control strategy S2CS2 with 20%, 30%, and 40% of the capacity upper limit were selected, and the NPVrel results are demonstrated in Table 16 and Figure 23.
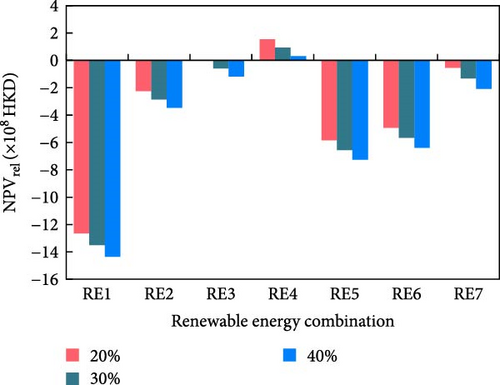
| Submarine cable capacity | NPVrel [× 108 HKD] (1 HKD = 0.128 USD) | ||
|---|---|---|---|
| 20% | 30% | 40% | |
| RE1 | −12.65 | −13.50 | −14.35 |
| RE2 | −2.24 | −2.86 | −3.48 |
| RE3 | −0.02 | −0.60 | −1.18 |
| RE4 | 1.54 | 0.93 | 0.31 |
| RE5 | −5.85 | −6.55 | −7.26 |
| RE6 | −4.93 | −5.66 | −6.39 |
| RE7 | −0.55 | −1.32 | −2.08 |
The positive income component of NPVrel was the savings from the operational and feed-in tariffs, while the other components were the initial investment and the annual O&M costs. Therefore, when the feed-in tariff was cancelled, it can be found that most renewable energy combinations cannot reach a positive or neutral NPVrel result, except RE4. Meanwhile, the NPVrel results of all combinations diminished as the capacity of submarine cables increased. The minimum value of NPVrel was −14.35 × 10⁸ HKD in RE1 with 40% of the capacity upper limit, and the maximum value was 1.54 × 10⁸ HKD in the case of RE4 with 20% of the capacity upper limit (1 HKD = 0.128 USD). RE4 was the only combination with positive NPVrel results, consisting only of nearshore wind turbine systems. Nearshore wind turbine systems can achieve smaller investment and annual O&M costs than FPV and TSG systems. The annual operational tariff savings from this combination could fully cover the annual O&M costs each year, and the remaining savings over 20 years could cover the initial investment costs of the nearshore wind turbine system. This is the reason why RE4 still achieved positive NPVrel results.
7.3. Analysis of Important Parameters Affecting Economic Performance
When evaluating the NPVrel, a key indicator of economic performance, several factors come into play that can notably influence the outcomes. These parameters will relate to the investment cost of the system over its entire life cycle, the annual expenditure and revenue, and the expenses linked to equipment renewal. Thus, in this section, a sensitivity analysis was undertaken on these variables. The initial focus lies in evaluating the investment expenses linked to both the renewable energy system and the submarine cable. Subsequently, the examination extends to the interest rate and escalation rate, which are pivotal for determining annual financial flows over the system’s lifespan. Lastly, the sensitivity analysis encompasses the determination of the necessity and timing of potential replacements for the submarine cables. Initially, the calculation considered these factors to possess realistic and rational values derived from genuine data sources. Subsequently, in the sensitivity analysis, the original values were subject to adjustments ranging from decreases to increases of 10%, 20%, and 30%, respectively. In the initial calculations, the assumption was that the submarine cables would operate continuously for 20 years without any replacement over the entirety of their life cycle. However, in the sensitivity analysis, it is postulated that replacements will indeed be necessary. Specifically, replacements are anticipated in the 10th, 12th, 14th, 16th, and 18th years, with considerations made for salvage value in the ensuing calculations. RE4 from Scenario 2 was selected for this sensitivity calculation. The outcomes of the sensitivity analyses, structured as described, are visually depicted in Figures 24 and 25.
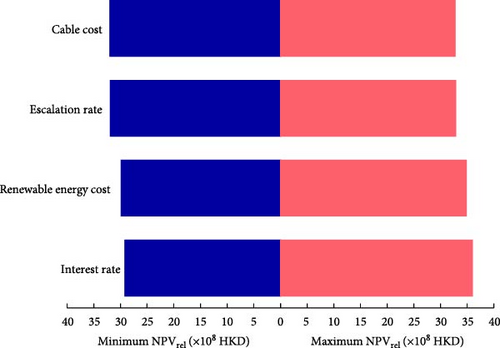
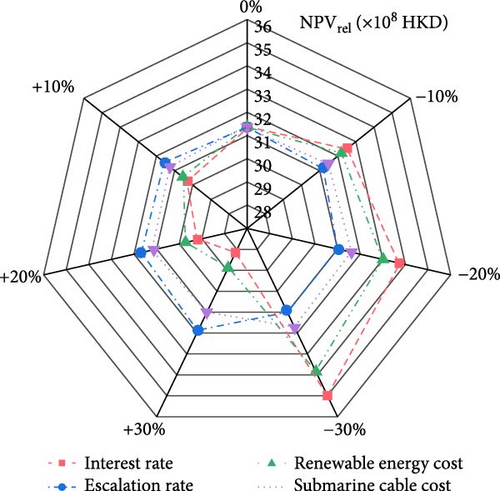
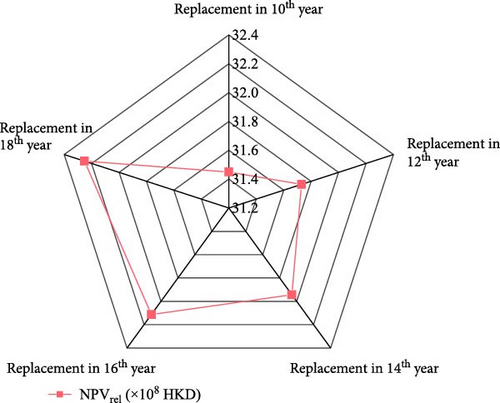
The findings illustrate a consistent trend where NPVrel experiences a decline as the interest rate, as well as the investment costs associated with renewable energy and submarine cables, fluctuate from a 30% decrease to a 30% increase. Conversely, NPVrel demonstrates an upward trend only in response to the increase in the escalation rate. The alteration in NPVrel attributed to variations in the interest rate emerges as the most significant, showcasing a substantial gap between the highest and lowest values of 6.85 × 10⁸ HKD when comparing a 30% decrease to a 30% increase from the initial value. Conversely, adjustments in submarine cable costs yield the least impact on the economic result, with a difference of 7.40 × 10⁷ HKD between the maximum and minimum values. Meanwhile, the necessity of replacing submarine cables throughout a 20-year life cycle impacts the economic result. As the replacement time extends incrementally from year 10 to year 18, there is a corresponding increase in NPVrel from 3.14 × 10⁹ to 3.23 × 10⁹ HKD. This progression highlights the financial implications of the submarine cable replacement timing on the overall economic performance.
8. Limitations, Challenges and Future Prospects
This study presents diverse scenarios and cases to analyse the effects of demand and energy sharing on the system caused by electric ferries and vehicles based on dynamic simulation. However, several limitations and obstacles persist. First, this study is entirely based on simulations conducted using the TRNSYS dynamic energy simulation software. While efforts were made to mimic real-world conditions closely, slight discrepancies may exist compared to actual instant changes in real-life situations. Conducting practical experiments on the same scale remains challenging. Certain assumptions required to construct systems and scenarios also serve as limitations. These constraints arise from the initial assumptions made during the development of the models and scenarios, thereby influencing the scope and applicability of the study. Initially, the fixed travel schedules of a single electric ferry and 10 electric cars restrict flexibility, leading to repetitive daily journeys that do not mirror real-world variability. From the previous results, it can be found that the itinerary is a factor that can significantly affect performance. Furthermore, the hypothetical fleet size and type of ferries and cars are constrained. In comparison to reality, the quantity and battery size of electric ferries are relatively modest. This discrepancy highlights a potential limitation in replicating real-world conditions accurately, making their scale minuscule relative to the overall cross-harbour zero-emission system, which also affects the magnitude of the change in system performance brought about by their energy sharing. Finally, all designed energy management strategies are based on instantaneous control of current information and, therefore, lack versatility and lead time in the face of some special circumstances, as well as the design of more flexible and effective energy management strategies based on predictive control. Moreover, the study encounters numerous challenges. Based on the number of parameters that can be varied in different cases and scenarios of the designed cross-harbour system and that have the potential to significantly affect energy sharing as well as economic performance, it was only possible to select a representative number of parameters to be tested and explored. Therefore, some prospects can be further explored in the future. First, a more diversified fleet of electric ferries and cars can be constructed to evaluate the impact of energy sharing on the zero-emission system through V2B interactions. Additionally, a comprehensive analysis of variables with significant performance implications could be conducted to identify the most and least sensitive parameters. Introducing predictive control into future energy management strategies could enhance system efficiency by leveraging energy storage resources more flexibly and efficiently.
9. Conclusions
Based on the hybrid cross-harbour system consisting of two zero-emission harbour buildings located in GBA and all connected by submarine cables, in this study, one car carrying electric ferry and 10 electric cars were included in this system, trying to utilise the available capacity of their battery to enhance the energy sharing between Macau and Hong Kong. The performance of the system and the impact of mobile electric transportation were investigated and compared without and with the incorporation of the V2B function of the electric ferry and cars. Multiple energy management strategies were designed to explore the impact of performance variations and find the optimal one. Furthermore, the system performance when there were no intermediate submarine cables linking all renewable energy sites and buildings, and mobile electric transport was the only way of energy sharing was also demonstrated and compared through several strategies. The present research aimed to investigate the energy-sharing enhancement of mobile electric transportation on a hybrid cross-harbour zero-emission system.
9.1. Achieved Research Outcomes
- 1.
The establishment of a hybrid ocean energy system has been instrumental in realising the zero-emission building objective within the investigated cross-harbour system encompassing two ferry terminal buildings. When all submarine cables are present, enabling submarine cable-based energy sharing to be activated and electric ferries and EVs are only used as a demand, all cases of renewable energy combinations can reach a positive NPVrel and negative carbon emissions, reaching a zero-emission target while being able to cover all the costs over a 20-year lifecycle. This conclusion aligns with the primary objective of this study and contributes to the first scientific gap.
- 2.
By adjusting the target FSOC value for charging and implementing an averaging strategy for charging power, it is possible to decrease the operational tariff and enhance the NPVrel outcomes. This adjustment can lead to a maximum reduction of 1.24% in operational tariff and a maximum improvement of 1.02% in NPVrel. Integrating the V2B feature into electric ferries and cars, enabling them to supplement the energy requirements of the two harbour buildings, results in improved energy matching and economic performance, albeit within certain limitations. Further fine-tuning the charging FSOC upper limit based on whether the energy source for charging from the grid or renewable sources can offer additional enhancements. In this context, the primary energy-sharing mechanism for the studied cross-harbour system remains the submarine cable. This connectivity plays a crucial role in enhancing system performance through efficient energy exchange and sharing, aligning with the second objective and contributing to the second scientific gap outlined in the study.
- 3.
In situations where intermediate submarine cables are incorporated, the primary mode of energy sharing predominantly relies on these cables, with a smaller portion facilitated through mobile electric transportation. Conversely, scenarios without intermediate submarine cables were also examined, where energy sharing solely relied on portable electric vehicles. In these scenarios, the increase in energy-matching could be up to 3.44%, the decrease in operational tariff could be up to 1.42 × 10⁶ HKD and 2.74% and the increase in NPVrel could be up to 3.16 × 10⁷ HKD and 3.40%. In essence, electric vehicles with V2B function can contribute to the performance of the system by undertaking energy exchange and sharing, in line with the third point of objective and contribute to the third scientific gap.
In summary, this study demonstrates that, in addition to common transport functions, electric mobility vehicles that incorporate V2B functions and can provide energy-sharing functions for two or more unconnected systems can enhance the techno-economics of the whole system. Utilising the electrical energy storage within the e-mobility vehicles present in the system itself and adding V2B functionality, energy-sharing strategies can be applied to provide energy interchanges for multiple independent systems without additional construction and investment to enhance energy matching, reduce grid dependence and operational tariffs and increase relative net present value. Such an energy-sharing approach can be applied to other systems.
9.2. Future Recommendations
The conclusions obtained based on the summary of all the above results can provide some potential recommendations for future research and energy management strategies. Energy sharing by applying the V2B function to develop the battery resources of the system’s own electric ferries and EVs could clearly bring enhancements to the zero-emission system performance. However, the enhancements are less impressive owing to the restricted numbers and travelling schedules, whilst the lower number of electric ferries is less than realistic. Therefore, a suggestion for future research could be to explore the different number of electric ferries and EVs by dividing them into groups with different routes, departure times and travel schedules. Furthermore, the energy-sharing strategy designed in this study based on the existence of its own e-mobility resources was proved to be effective. Therefore, in the future, reality of the existence of similar zero-emission systems with e-mobility, the V2B function can be applied through a complete, detailed and reasonable design to achieve the energy sharing of multiple buildings or communities to improve the technical and economic feasibility.
Nomenclature
-
- Bt:
-
- The benefit of period t (HKD)
-
- B2V:
-
- Building to vehicle function
-
- Ct:
-
- The cost of period t (HKD)
-
- CEFe.g.:
-
- The equivalent CO2 emission factor of the electric grid (kg CO2, eq/kWhe)
-
- CEa:
-
- The annual operational equivalent CO2 emission (kg CO2, eq/m2.a)
-
- DHW:
-
- Domestic hot water
-
- EV:
-
- Electric vehicles
-
- Eimp,a:
-
- Annual import energy from the grid (kWh)
-
- Eexp,a:
-
- Annual export energy to the grid (kWh)
-
- Edumped (t):
-
- The dumped energy that cannot be transported through submarine cable (kWh)
-
- ERE,total (t):
-
- The total renewable energy generation of all the nearshore and offshore sites (kWh)
-
- FPV:
-
- Floating photovoltaic panels
-
- FSOC:
-
- Fractional state of charge of battery
-
- GBA:
-
- Greater bay area
-
- HVAC:
-
- Heating, ventilation, and air conditioning system
-
- i:
-
- Interest rate (%)
-
- OEFe:
-
- Onsite electrical energy fraction
-
- OEMe:
-
- Onsite electrical energy matching
-
- Lelec (t):
-
- The total electricity load power of the building (kW)
-
- NPVrel:
-
- Relative net present value (HKD)
-
- n:
-
- The total lifetime (year)
-
- Pimp (t):
-
- The exported power from the system to the grid (kW)
-
- PREe (t):
-
- The electricity power output of the hybrid renewable energy system (kW)
-
- PV:
-
- Photovoltaics
-
- renergy usage:
-
- Energy usage ratio (%)
-
- S1CS1:
-
- Scenario 1 charging strategy 1
-
- S1CS2:
-
- Scenario 1 charging strategy 2
-
- S1CS3:
-
- Scenario 1 charging strategy 3
-
- S2CS1:
-
- Scenario 2 charging strategy 1
-
- S2CS2:
-
- Scenario 2 charging strategy 2
-
- S2CS3:
-
- Scenario 2 charging strategy 3
-
- S3C1:
-
- Scenario 3 control strategy 1
-
- S3C2:
-
- Scenario 3 control strategy 2
-
- TSG:
-
- Tidal stream generator system
-
- V2G:
-
- Vehicles to grid function
-
- V2B:
-
- Vehicles to building function
-
- WMI:
-
- Weighted matching index
-
- WT:
-
- Wind turbines.
Conflicts of Interest
The authors declare no conflicts of interest.
Funding
This research was partially supported by the HK RGC (Hong Kong Research Grants Council) Research Project 15211822. This research was also partially supported by the Projects “P0043916” and “P0044567” from the Research Institute for Smart Energy (RISE), The Hong Kong Polytechnic University.
Acknowledgments
This research was partially supported by the HK RGC (Hong Kong Research Grants Council) Research Project 15211822. This research was also partially supported by the Projects “P0043916” and “P0044567” from the Research Institute for Smart Energy (RISE), The Hong Kong Polytechnic University.
Open Research
Data Availability Statement
Data will be made available on request.


