Optimizing Radiation Shielding for Fusion Maintenance Facilities: Insights From a Comprehensive Analysis of ITER Hot Cell
Abstract
One of the primary goals of the ITER project is to demonstrate the safety characteristics of a fusion device, particularly in terms of radiation management. Radiation protection during maintenance periods is of special concern, as personnel performing maintenance-like activities will be exposed to delayed gamma fields from numerous and complex radioactive components. Ensuring a safe and equipped environment for such activities is the objective of the ITER hot cell. This facility requires extensive design optimization, balancing spatial and temporal availability constraints, radiation protection, and cost-effectiveness. In this paper, we present a comprehensive assessment of ITER hot cell’s radiation environment to support its efficient design and safe operation. The study evaluates the shielding efficiency of the conceptual design layout from 2021, providing meaningful insights for layout improvement. We show that substantial amounts of concrete (~2900 m3) could be saved from the currently evolving design while respecting radiological requirements. The evaluation of the occupational radiation exposure (ORE) associated with hot cell maintenance activities resulted in 179 man·mSv·year−1, which represents a significant fraction (36%) of the project’s annual budget. This highlights the importance of integrating shielding analysis, accounting for personnel radiation exposure, even in early design phases, to support the optimization of the maintenance plan according to safety requirements.
1. Introduction
Guaranteeing the safe operation of a large experimental fusion device is one of ITER’s main objectives. Unlike nuclear fission and accelerator-like facilities, where safety standards are long-established, fusion facilities present unique challenges that require novel approaches across multiple domains [1], including the management of activated components and their radiation fields. ITER hot cell, the facility dedicated to handling the radioactive and contaminated components produced during the project [2], is at the core of ITER’s maintenance plans.
The hot cell, to be located next to the tokamak complex as shown in Figure 1, is tasked with multiple critical functions, including: (i) the repair, refurbishment, testing and storage of radioactive and contaminated components; (ii) the processing, packaging and export of radioactive waste; and (iii) the management, hosting and maintenance of contaminated machinery used in previous tasks.
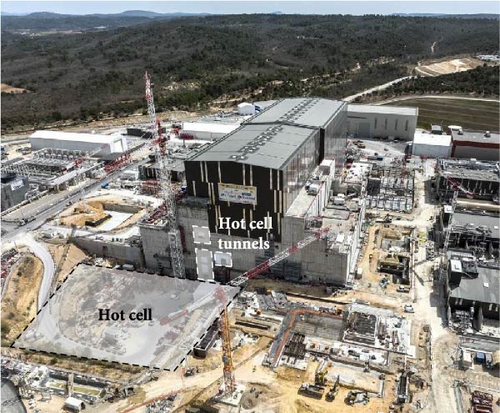
Such operations, which make use of a combination of sophisticated remote-handling (RH) technologies [3] and manual hands-on (HO) interventions, are performed under radiation exposure. The delayed gamma radiation fields, emitted by the components exposed to the intense neutron fluence produced during tokamak operation, heavily impact the design and operation of the hot cell.
The effects of radiation on living tissues are well known, varying from mild, such as skin reddening, to severe, such as many types of cancer and death. Effective radiation management is essential for personnel safety, but also for minimizing the capital and operational costs of the project and securing an optimal availability of personnel executing tasks under radiation exposure. In ITER, the accumulated radiation exposure limit is 2.5 mSv/year per worker for regular operations and 500 man·mSv/year collectively for the whole project. Also, remote operations are recommended when dose rates exceed 100 μSv/h.
Despite its current conceptual design phase [4], the hot cell has undergone multiple design advancements to optimize its maintenance operability [5–8]. Still, its design is a major technical challenge. Given its size, the variety of components it must handle, and the complexity of the numerous tasks it must perform, ITER hot cell is a large and sophisticated facility. However, it is also central to the project’s success, as it ensures that the tokamak operates safely, efficiently, and in compliance with stringent safety requirements.
In terms of radiation protection, shielding analyses have been performed in the past to address the radiation environment in the hot cell [9–11], but their scope has been limited. Some of them focus on isolated radiation sources or individual processes, areas, or systems. Others decouple the evaluation of occupational radiation exposure (ORE) from the design process, which limits their utility in creating an integrated, optimized layout. In other cases, they aim to provide a holistic assessment of personnel exposure to radiation in the entire facility, but general assumptions are made about expected dose levels.
It is within this context that we present a comprehensive and global analysis of the ITER hot cell 2021 layout design. Advanced radiation transport codes, models, and methodologies are employed to produce high-resolution radiation maps over the facility. The layout’s shielding efficiency and the associated ORE were studied during all operational modes. This integrated approach has allowed us to identify design features, components, and operations that challenge radiological requirements, but also shielding margins to reduce construction costs without compromising safety.
This work aims to serve as a guide for ITER hot cell design and operation, while offering a foundation for future research to support next-generation fusion maintenance facilities.
2. The Hot Cell and Its Operational Scenario
The 2021 hot cell layout, being 85 m wide, 90 m long, and 37 m high, is a massive facility comparable in size to the tokamak complex. It is divided into five levels as shown in Figure 2. B2 and B1 are underground, while L1 to L3 are above. Both buildings are connected through tunnels (see Figure 1) at all levels except L2. At L1, a second tunnel connects it with the neutral beam cell.
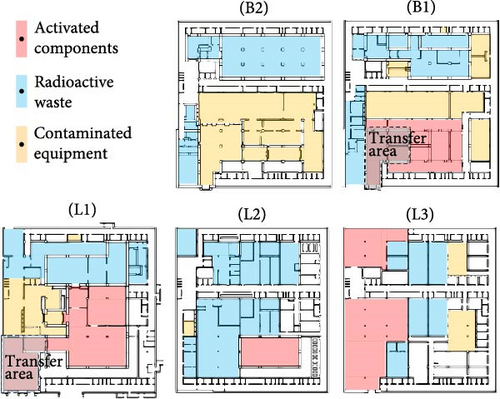
The facility, excluding deployed systems, mainly comprises ordinary concrete walls and slabs of varying thicknesses, ranging from 30 to 165 cm. It also includes steel shielding structures to protect personnel.
The hot cell functions during all of the project’s modes of operation, including tokamak operation, tokamak shutdown, and decommissioning. However, the most active periods coincide with tokamak shutdowns, fitting between plasma operational phases. They are categorized as long-term or short-term maintenance, depending on their duration. The main operations performed during such periods can be classified into the following groups:
2.1. Maintenance, Repair, and Testing of Components
Preventive and corrective maintenance operations are planned for activated in-vessel and ex-vessel systems. Blankets, divertor cassettes, Neutral beam components or port plugs, and their associated systems deployed in interspace and port cell regions are prime examples.
2.2. Characterization, Conditioning and Storage of Medium, Low and Very Low Activity, and Purely Tritiated Radwaste
Previously activated components that are of no use to the project are considered radioactive waste, or radwaste, and must be properly handled. Type A (low level) and Type B (intermediate level) radwaste will be produced and handled in ITER.
2.3. Decontamination, Maintenance, and Storage of Contaminated Equipment
Systems dedicated to handling previous components also require dedicated maintenance. Although not directly activated, they can become contaminated with activated and tritiated dust or activated corrosion products through different mechanisms. Examples include high-efficiency particle arresting (HEPA) filters, RH equipment accessing the vessel, or filters from the liquid radwaste system.
The complexity and variety of these scenarios require the implementation of tailored maintenance protocols and specialized equipment throughout the entire hot cell, as depicted in Figure 2, at multiple times after neutron irradiation. As a result, the radiation environment within the facility is highly dynamic, with multiple sources generating radiation fields that vary in intensity and type over time. The implementation of radiation shielding, studied through shielding analysis, becomes a crucial part of the hot cell design for personnel protection.
3. Analyzed Scenarios
- 1.
Shielded canisters storing activated dust.
- 2.
Drain tanks, resin tanks, and resin filters from the liquid waste system contaminated with activation corrosion products and activated dust in some cases.
- 3.
Tritium blanket module (TBM), both inside and outside a dedicated shielded TN-MTR flask [8].
- 4.
Pipe Forest equipment from TBM ports [12].
- 5.
Equatorial and upper port plugs.
- 6.
Blankets (first wall panels and/or shielding blocks).
- 7.
Type A waste as ex-vessel components (i.e., port Cell equipment) packed in drums and containers.
- 8.
Type B waste as in-vessel components (i.e., blankets, divertors, etc.) inside and outside given containers.
- 9.
Remote-handling equipment contaminated with dust
- 10.
HEPA filters contaminated with dust.
Dedicated working areas, either within the room hosting the radiation source or in adjacent areas, are considered for human interventions. The location of components and working areas, as well as preliminary working patterns, are provided by ITER organization according to the hot cell’s operational schedule and maintenance needs.
Transient configurations were only considered during the transfer of activated components through the hot cell transfer area, shown in Figure 2. All positions along the transfer paths were considered for all in-vessel components. Final positions include dedicated docking stations for testing (at B1 level) and refurbishment (at L1). The transfer of ex-vessel components was not included in this study, as they will enter the hot cell through the same path as in-vessel components and exhibit lower activation levels.
Additionally, tokamak operation during a 500 MW pulse was also included in the analysis.
Table 1 summarizes the scenarios considered in this study.
| Operation | Type | Component |
|---|---|---|
| Tokamak operation | — | Plasma and activated water |
| Transfer to refurbish | RH | Port plugs, blankets, divertor |
| Transfer to testing | RH | Port plugs, divertor |
| Transfer to storage | RH | RH equipment |
| Decontamination | RH–HO | RH equipment |
| Refurbishment | RH | Port plugs, blankets |
| Testing | RH | Port plugs |
| Liq. Radwaste process | RH–HO | Drain & resin tanks, resin filter |
| Sol. Radwaste process | RH–HO | Blankets, TBM, pipe forest, type A & B waste |
| Radwaste packaging | RH–HO | Type B waste containers, TBM |
| Radwaste storage | RH–HO | Pipe forest, dust canister, type A & B waste drums & containers |
| Radwaste support | HO | HEPA filter |
| Laboratories | HO | Radwaste samples |
4. Methods
4.1. Radiation Transport Model
The hot cell radiation transport model, produced in MCNP format [13], has been developed from scratch according to its layout design from 2021.
Being in a conceptual design phase, the model presents notable simplicity in terms of geometry and material usage. It consists of building structures made of standard concrete, such as external and internal walls, slabs, and columns, as well as essential steel structures within the layout for radiation shielding, such as shielding doors. The wall thicknesses ranges from 30 to 165 cm, while those of steel structures generally vary from 10 to 40 cm.
Neither the systems deployed to operate the hot cell nor their openings in concrete walls have been modeled, with the exception of the systems comprising the radiation sources of interest, such as port plugs, tanks, or filters. In subsequent design iterations, these features (especially wall penetrations) will be incorporated.
The hot cell CAD model was simplified and refurbished using SpaceClaim software [14]. The conversion into an MCNP-compatible format was performed with GEOUNED [15]. This model was integrated into the broader ITER site MCNP model, which includes the description of the tokamak complex and other structures as described in [16]. Figure 3 illustrates this integration.
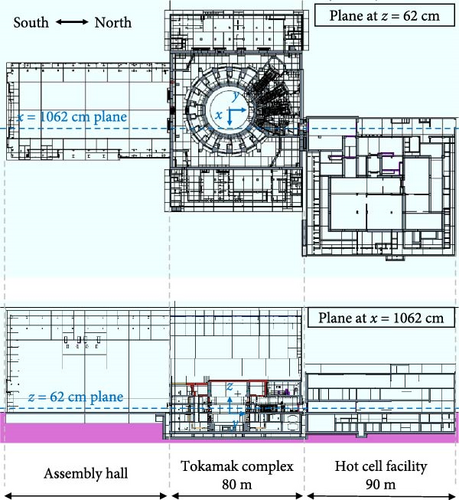
This model, considered baseline in this paper, is modified to analyze the impact of different shielding configurations, described in the following sections, on the hot cell radiation environment.
4.2. Radiation Sources Treatment
The different scenarios previously mentioned consider significantly different radiation sources with varying importance depending on the operational modes of the facility. The relevant radiation sources present during these operational modes are the following:
4.2.1. Tokamak Operation
- 1.
Plasma neutrons and subsequent prompt photons.
- 2.
Gamma rays (neutrons) from 16N (17N) decay in activated water running through the tokamak cooling water system [17].
A 500 MW pulse intensity is considered for these sources.
4.2.2. Transfer and Maintenance During Shutdown
- 1.
Bulk material: Materials of components exposed to the neutron fluence will become activated. These are distinguished from the following sources.
- 2.
PbLi residual layer: Some Tritium Breeding designs consider a liquid mixture of PbLi. This mixture, which will reach first-wall regions, is drained after plasma operation towards equipment in the interspace and port cell, further from the plasma and therefore less exposed to plasma neutrons. However, a solidified residual layer (less than 1 µm thick), exposed to first-wall fluence, will remain on such equipment.
- 3.
Activated dust: Generated either from the interaction between the plasma and first-wall components or from processing activated components in the hot cell. Equipment handling such components, which are not exposed to neutron fluence, becomes contaminated with dust that is activated with first-wall level fluence.
- 4.
Activation corrosion products: Cooling pipes, which are exposed to neutron fluence, are corroded, resulting in activated particles released to the cooling circuit and pumped by the hot cell liquid radwaste system or trapped in filters handled as waste.
To computationally describe this diversity of sources, various cutting-edge methodologies are required. These methods have allowed us to address the radiological conditions of ITER hot cell during all operational modes of the project in an accurate and manageable timeframe. These tools are (i) SRC-UNED [18] for tokamak operation sources, (ii) common decay gamma sources (CDGS) [19] for geometrically complex components, with a spatial resolution ranging from 2 × 2 × 2 to 4 × 4 × 4 cm3, (iii) motion capability and time-discretization [16] for moving sources, (iv) SURF-UNED [20] for complex surface radiation sources, and (v) the standard MCNP SDEF card for geometrically simpler sources.
Table 2 summarizes the computational methods used in this study, while S2 shows an example of the use of one of them (a CDGS).
| Radiation source | Method | Cool time (d) |
|---|---|---|
| Plasma neutrons & prompt photons | SDEF + SRC-UNED | 0 |
| Activated water | CDGS + SRC-UNED | 0 |
| RH equipment | SURF-UNED | 116 |
| Tanks, canisters & filters | SDEF | 12 |
| Eq. & Up. port plugs | CDGS | 21 |
| Blankets & divertors | CDGS | 21, 116 |
| TBM | CDGS | 21 |
| TBM within flask | SDEF | 21 |
| Pipe forest | CDGS | 21 |
| Pipe forest (PbLi layer) | SDEF | 21 |
| Type B waste (containers) | SDEF | 21, 116 |
| Type A waste | SDEF | 116 |
| Type B waste (blankets) | CDGS | 21, 116 |
| Components transfer | CDGS + Motion source | 21 |
The SA2 irradiation scenario, accounting for the entire ITER operational lifetime, is considered for the sources present during shutdown. The cooling time considered is component-specific and is set as the minimum time after which components can be managed. It ranges from 12 to 116 days and is also shown in Table 2.
4.3. Other Computational Considerations
D1SUNED code v.4.1.2 [21] (MCNP-based), has been used for all radiation transport simulations. In general, FENDL-3.1 c/d [22] was used for neutron transport, while EAF-2007 [23] and MCPLIB [24] were used for activation and photon transport, respectively.
Global Variance Reduction [25] was applied. The number of sources’ sampled histories considered per simulation, both in variance reduction and production runs, ranges from 109 to 1011. Meshes of 1 × 1 × 1 m3 are used to tally the results. Statistical errors, shown in S3, are below 10% in the regions of interest.
5. Results and Discussion
5.1. Tokamak Operation
While tokamak operation is a secondary mode of operation for radiation protection in the hot cell, it has still been analyzed to ensure full compliance with safety requirements. Neutron and photon contributions to the dose–both from the plasma and the activated water, are evaluated separately, as shown in Figure 4B,C.
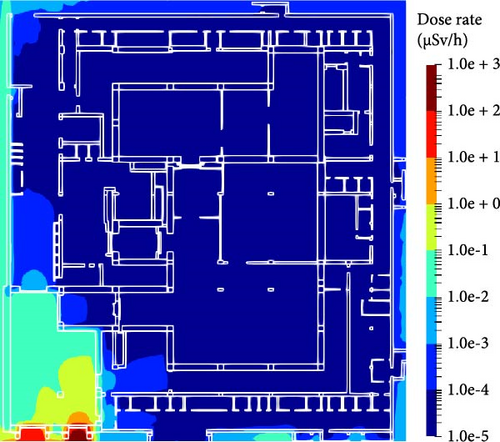
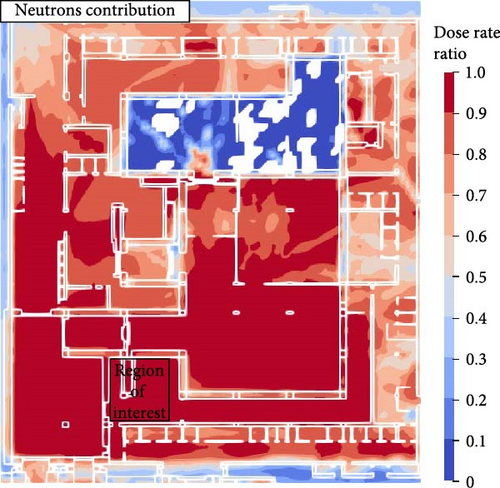
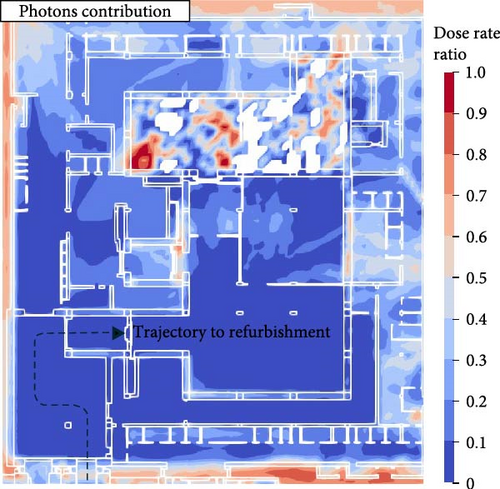
As expected, the highest dose rates are observed at the entrance of the hot cell, just after the tunnels (points P and Q in Figure 4B). The main radiation leakage originates from the tunnels connecting with the cargo lift (point P), where the calculated dose rate is 3.6 μSv/h. In contrast, results after the tunnel connecting with the neutral beam cell (point Q) are 0.1 μSv/h. This difference is due to enhanced shielding measures in the neutral beam cell, presenting high radiation levels from both neutrons and photons. The neutral beam tunnel is equipped with two shielding doors composed of stainless steel and borated polyethylene. This composite is an efficient solution to shield both neutrons and photons, as it combines: (i) high-Z elements (such as the iron in steel), which enhance photon interactions, and (ii) a rich content of low-Z elements (hydrogen of the polyethylene) for neutron moderation, with additional boron content to increase neutrons absorption.
However, during tokamak operation, the neutronic radiation levels within the hot cell are very low (see Figure 4A). Consequently, borated polyethylene is unnecessary in this area, as the primary radiation sources are decay photons from activated components, as discussed in the following sections.
Despite the low results, plasma neutrons are the main contributors in all hot cell areas during tokamak operation. Activated water contribution is negligible. Dose rates ranging from 1 and 0.1 μSv/h are observed within the hot cell entrances across various levels. In other areas, dose rates drop below 10−3 μSv/h.
5.2. Transportation of Activated Components
The transfer of in-vessel components produces a time-dependent radiation environment that is critical for radiation protection planning. Since the transfer cask is not shielded, the hot cell layout must provide sufficient shielding to minimize radiation exposure in adjacent areas where human access is permitted. Figure 4B highlights one of the regions of interest during this operation.
Radiation leakages are observed around all doors leading to the transfer areas, shown in Figure 2. These leakages are mainly due to the shielding weak points around the door’s frames revealed under certain conditions, depending on the radiation source, its position and orientation along the transfer, and the problem geometry. When the source is in front of the door, the photons’ most probable path leading to the region of interest is parallel to the door’s surface normal. The effective shielding is, then, the whole steel door’s thickness. When the source moves away from the door following a perpendicular trajectory with respect to its normal, the effective shielding starts increasing until radiation levels on the region of interest are insignificant. However, and only under specific geometrical circumstances, when the source continues its trajectory, the photons’ most probable path crosses the door frame, leading to a substantial drop in the encountered effective shielding, which may be just a few centimeters of concrete around the door’s frame. This dependency of results on the location of the region of interest, the geometry of the problem, the radiation source, and its position along the transfer, as well as the exact conditions used for the simulations, are detailed in S4.
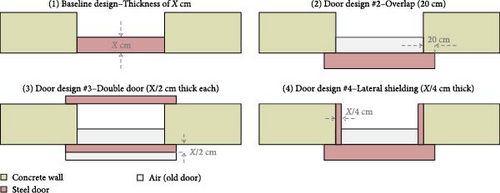
For this reason, a scoping analysis regarding shielding designs has been conducted for all transferred operations. Four designs were considered: (1) baseline, (2) addition of a 20 cm overlap, (3) a double door with overlap, and (4) the addition of lateral shielding to the single door with overlap. Figure 5 illustrates such designs. The evolution of the maximum dose rate observed in the region of interest shown in Figure 4B and produced by the equatorial port plug tracked along its trajectory (shown in Figure 4C) is displayed in Figure 6A.
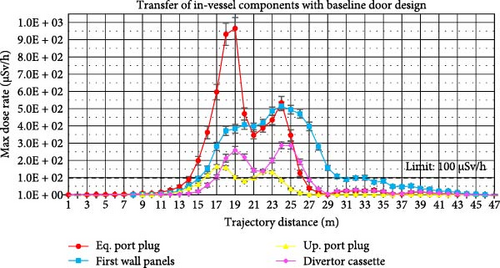
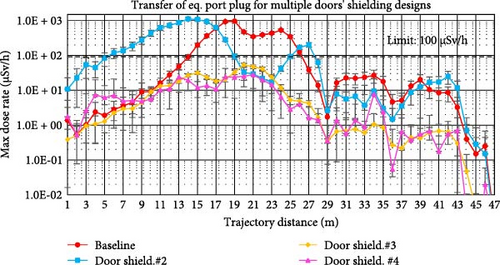
The peak dose rate in the region of interest, 0.97 mSv/h, is observed once the Equatorial Port Plug has traveled approximately 17 m of its trajectory starting at the tokamak complex’s cargo lift. This value corresponds to the baseline doors’ shielding design. Transferring other components typically results in lower dose rates, though the position along the trajectory where peak dose occurs may vary due to the different distributions and intensities of radiation fields produced by each component [16].
Door designs have a direct impact on dose levels. For instance, for the Eq. Port plug, the inclusion of the overlap increases the peak dose rate to 1.1 mSv/h, occurring at 14 m along the trajectory. In contrast, as shown in Figure 6B, shielding designs #3 and #4 lead to significantly lower peak values, 54 µSv/h and 28 µSv/h, respectively.
5.3. Maintenance Activities
This operational mode represents the most significant radiation protection challenge and the primary driver for layout optimization in ITER hot cell. Individual dose rate maps have been generated for each case described in Section 3. They are used for three main distinct purposes.
5.3.1. Limit Compliance and Dose Reduction Measures
Radiation maps are compared with radiation safety project requirements (internal thresholds that should not be exceeded without formal project approval) for human-intervention, which comprise (i) 100 µSv/h in the vicinity of the radiation source, (ii) 10 µSv/h in adjacent rooms, and (iii) 1 µSv/h in adjacent corridors or laboratories.
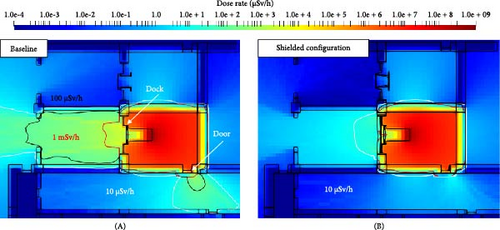
Several radiation leakages are identified around layout weak points, especially around shielding doors (as in section 0), docking stations, and system penetrations. One notable example, shown in Figure 7A, is the presence of the equatorial port plug within the test facility. Here, the docking station and shielding door significantly affect radiation levels in neighboring rooms, with dose rates up to 3.6 mSv/h and 0.67 mSv/h, respectively. Two dose reduction measures were included: (i) a 12 cm thick lead plate on the dock side, reducing levels up to a factor of 76 in the target region, and (ii) a triangular steel shield of maximum thickness of 15 cm on the door side, reducing the dose rate up to a factor 23 in the target room. Figure 7B shows the combination of both measures.
Another example involves Type A waste processing near the buffer storage area (Figure 8A). Although dose rates in the working area are about 5 µSv/h, levels exceeding 100 µSv/h are observed in regions that personnel must access. A dedicated 10 cm thick steel corridor-type shield and a 20 cm thick concrete wall are sufficient to reduce radiation levels up to a factor of 37 (see Figure 8B).

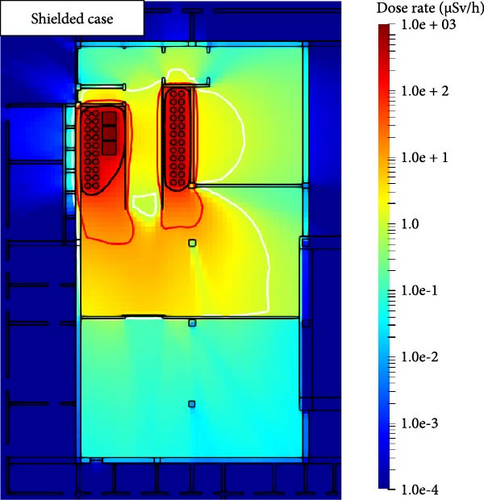
Table 3 gathers dose rate levels of the previous examples.
| Radiation source–case | Dose rate (µSv/h) | |
|---|---|---|
| After dock | After door | |
| Eq. port plug–baseline | 3596 | 674 |
| Eq. port plug–shielded | 47 | 29 |
| In corridor | In work area | |
| Type A waste– baseline | 150 | 5.0 |
| Type A waste–shielded | 4.0 | 0.7 |
- Note: Statistical errors in S3.
5.3.2. Layout Optimization
Beyond implementing specific dose reduction measures, radiation maps have also been employed to assess the optimal thickness of walls to meet the requirements.
The dose rate was tallied within grid voxels 10 cm long across the layout of concrete structures, enabling the evaluation of the attenuation coefficient due to the complex sources considered in this study. Once these are determined case-by-case, and the radiological requirements in different areas are specified, optimal wall thicknesses to meet safety requirements may be obtained.
This approach is detailed in S5.
This analysis allowed for the removal of up to 6,458 tonnes of concrete (~2900 m3) from the entire hot cell layout, reducing over-design in radiologically safer areas. Conversely, an additional 173 tonnes of concrete is required to meet safety requirements in other areas. Table 4 summarizes these results per level.
| Level | Concrete mass (tonnes) | |
|---|---|---|
| Saved | Included | |
| B2 level | 2266 | — |
| B1 level | 761 | — |
| L1 level | 747 | 105 |
| L2 level | 1193 | 68 |
| L3 level | 1491 | — |
| Total | 6458 | 173 |
5.3.3. ORE Evaluation
The evaluation of the ORE has been conducted by integrating the computed dose rate maps with preliminary working patterns defined by ITER organization. Preventive maintenance operations are considered only. Corrective maintenance is disregarded.
Due to uncertainties in working operations and in the level of activated dust contamination, processes regarding radwaste export and equipment decontamination are also neglected. The decontamination process is treated in a separate study [20].
To capture the range of radiation exposure scenarios, over 90 working areas are considered throughout the facility. The average dose rate within each working area is extracted and multiplied by the area-specific working pattern and a 70% occupancy factor.
The evaluation, shown in Table 5, revealed that the considered hot cell operation accounts for a significant fraction (36%) of the project’s ORE annual budget. Although this is within regulatory limits, there are two operations, completely different in nature, where a large workforce would be required to meet individual requirements. These are the testing of the equatorial port plug (shown in Figure 7A) and the processing of Type A radwaste (one of the few operations considered is depicted in Figure 8A). These two operations are responsible for 80% of the total radiation exposure in ITER hot cell.
| Operation | Component | ORE (man·mSv·y−1) |
|---|---|---|
| Refurbishment | Port plugs, blankets | 0.01 |
| Testing | Equatorial port plug | 43.9 |
| Upper port plug | 6.8 | |
| Liq. radwaste process | Drain & resin tanks & filter | 0.16 |
| Solid radwaste analysis, process, and packing | Type A waste | 98.7 |
| Type B waste | 9.6 | |
| Pipe forest | 14.6 | |
| Tritium breeding module | 0.22 | |
| Dust canister | <0.01 | |
| Radwaste support | HEPA filters | 4.87 |
| Total | 179 | |
The exposure during the port plug testing (25% of the total) is due to the high doses observed in adjacent rooms, where operators perform short-term activities. In the case of the Type A waste process, the numerous and extended-duration operations, as well as the large workforce required for each of them, result in a radiation exposure accounting for 55% of the total despite the lower doses.
These results provide a flexible framework to analyze worker radiation exposure under the wide spectrum of maintenance tasks. They enable the definition of a regulatory-compliant maintenance plan for which continued adherence to ALARA (as low as reasonably achievable) principles is strongly recommended.
6. Conclusions
- 1.
Plasma operation is a negligible mode of operation in terms of radiation protection in most areas of the hot cell. Activated water does not play a relevant role.
- 2.
Weak points around layout structures, usually shielding doors, may be an issue during cask transfer and maintenance operations.
- 3.
“One-fits-all” doors’ design is not a suitable approach, especially during transportation. Complex geometry scenarios with many free parameters (source, trajectory, orientation, distance, angle, etc.) require tailored design solutions, door-by-door. Proposed shielding designs are efficient in reducing radiation levels by up to a factor of 34.
- 4.
A radiation maps-based evaluation of the ORE during maintenance in ITER hot cell has been produced for the first time, resulting in 179 man·mSv·y−1.
- 5.
Main contributors in terms of components (equatorial port plug) and operations (Type A waste processing) have been identified.
- 6.
The considered dose reduction measures achieve a reduction of radiation levels by up to a factor of 76, evidencing their shielding efficiency.
- 7.
Up to 6458 tonnes of concrete may be saved from the original hot cell layout to reduce over-designed features, reducing costs and respecting safety limits.
- 1.
Comprehensive and detailed shielding analysis, especially at early phases of the design, is essential to guarantee effective radiation protection and cost-effectiveness.
- 2.
The evaluation of the ORE, even with preliminary working patterns, must not be detached from shielding analyses. A systematic approach is recommended.
- 3.
Low-level activity components must be carefully handled. Prolonged exposure to low-dose levels can still be the main contributor to the personnel radiation exposure in a fusion facility.
These results provide a foundation for future research in radiation protection and workplace safety studies in fusion maintenance facilities, including ITER’s. Future studies may explore corrective maintenance tasks, uncertainties affecting dust decontamination and radwaste export, and multiyear radiation exposure trends for further investigation.
As a final note, the very accurate but time-consuming Monte-Carlo shielding analysis approach is incompatible with a fast design optimization process. This is especially relevant when many configurations (composed by radiation sources, locations, cooling times, operations, etc.) must be considered, such as in the case of ITER hot cell. Accelerated and accurate approaches could be explored for future shielding analysis enhancement.
Disclosure
The views and opinions expressed herein do not necessarily reflect those of the ITER organization.
Conflicts of Interest
This work was supported by ITER organization, which retains ownership of the generated data. At the time of this study, all authors were affiliated with UNED or ITER organization. Authors Joffrey Germa and Yannick Le Tonqueze have since moved to new affiliations, which did not provide nor receive any influence nor support during this work. No other relationships or activities exist that could be perceived as potential competing interest.
Author Contributions
Pablo Martínez-Albertos: investigation, methodology (lead), formal analysis (lead), visualization, writing–original draft. Patrick Sauvan and Juan Pablo Catalán: software, methodology (support), formal analysis (support). Mario Belotti: methodology (support), formal analysis (support). François Javier: conceptualization, resources, writing–review and editing Alexis Dammann: resources, writing–review and editing. Joffrey Germa: resources, data curation. Yannick Le Tonqueze: resources, project administration. Rafael Juárez: funding acquisition, validation, supervision.
Funding
This work has been funded through contract IO/20/CT/6000000345 between ITER organization and UNED.
Acknowledgments
We appreciate the support given by: (i) the MCIN/ AEI/ 10.13039/501100011033, for the PID2023-153160OA-I00 project; (ii) ENEN2plus mobility grant, co-funded by the European Union; (iii) Escuela Técnica Superior de Ingenieros Industriales (UNED) of Spain; (iv) and UNED. OpenAI’s language model ChatGPT (GPT-4) was used during the preparation of this manuscript for editorial support.
Supporting Information
Additional supporting information can be found online in the Supporting Information section.
Open Research
Data Availability Statement
Data and models are the intellectual property of ITER organization. Data will be made available upon request after the recipients confirm in writing that the purpose of obtaining the data is only to reproduce the results and after the recipients have signed and returned a nondisclosure agreement confirming that no part of the data will be distributed in any way. Data for the tritium breeding module ports will not be made available, as they are subject to additional intellectual property restrictions. The codes MCNP6 and D1SUNED v4.1.2 are required to obtain the results presented. The MCNP6 code is distributed by the Radiation Safety Information Computational Center (RSICC, Oak Ridge National Laboratory) under user licenses, following the procedure provided online (https://mcnp.lanl.gov/how_to_get_the_mcnp_code.html). The D1SUNED v.4.1.2 code, which is developed by UNED, is a proprietary patch code to MCNP6. The code will be made available on request after the recipients confirm in writing that the purpose of obtaining the code is only to reproduce the results and after the recipients have signed and returned a nondisclosure agreement confirming that no part of the code will be distributed in any way.


