Chemical Bath Deposition of Pollen Grain-Like NiS/CoS Heterostructure for Supercapattery With High Areal Capacity
Abstract
Chemical bath deposition (CBD) is a facile technique to coat the substrate with a thin and uniform coating of material with unique morphology. Herein, the CBD method was adopted to fabricate nickel sulfide/cobalt sulfide (NiS/CoS) electrodes for supercapattery application. The NiS/CoS electrodes were fabricated at different deposition times to study the evolution of material morphology with respect to time. Deposition time is a crucial factor in regulating the growth kinetics of the active material to attain the desired morphology for energy storage applications. XRD and X-ray photoelectron spectroscopy (XPS) analysis verified the growth of NiS/CoS nanostructures on the nickel foam (NF) surface. Based on field emission scanning electron microscope (FESEM) micrographs, it was evident that the deposition time of 2.5 h was ideal for maximum coverage of material with spherical thread-like morphology resembling the pollen grains. Correlatedly, the NiS/CoS-2.5 electrode showed the highest specific capacity of 2.60 C cm−2 at 2.0 mA cm−2 current density. The optimized electrode was coupled with activated carbon (AC) to fabricate NiS/CoS-2.5//PVA + KOH//AC supercapattery, which sustained 90% of the initial capacity after 2000 continuous cycles at 4.0 mA cm−2. This study portrays the prospects of CBD as a simple yet reliable approach to developing electrodes with good specific capacity for supercapattery application.
1. Introduction
Recently, the developments of electrode material to be applied in energy storage applications are achieving new milestones in device performance and stability. Material exploration for supercapattery applications is highly promising due to exceptionally high-power density, rapid charge–discharge process, and long shelf life. Particularly, transition metal sulfides (TMSs) is an efficient choice of substance for developing energy storage devices owing to their high theoretical capacity, low redox potential, outstanding electrochemical reversibility, and versatility in morphology tuning [1, 2]. Formulation of TMS with a combination of different metals is advantageous as it allows for the customization of specific properties, including conductivity, electrochemical activity, and stability [3].
Earlier studies have revealed that the amalgamation of cobalt and nickel sulfides (NiS) produces excellent performance due to synergistic effects and improved conductivity [4, 5]. Particularly, the NiS/cobalt sulfide (NiS/CoS) heterostructure offers a unique morphology with a higher density of electrochemically active sites compared to monolithic bimetallic sulfides. The heterojunction between NiS and CoS significantly enhances charge transport properties, overcoming the conductivity challenges of conventional bimetallic sulfides [6]. Miao et. al [7] fabricated a core–shell structure developed based on CoS deposited on NiS nanosheets, using hydrothermal and electrodeposition method, respectively. Leveraging the highly conductive and open framework of the core–shell nanolayer structure, the 5-NiS@CoS electrode achieves a remarkable specific capacitance of 1210 F g−1 at a current density of 1 A g−1 [7]. In another recent work, phosphorus-doped Co3S4@Ni3S4 electrode material integrates the advantages of TMSs and a 3D porous network heterostructure. The specific capacitance of this electrode reached 3614 F g−1 (451 mAh g−1) at 1 A g−1 and still maintain the initial specific capacitance of 73% after 3000 cycles [8]. Among these reported techniques, chemical bath deposition (CBD) is an interesting approach to achieve unique morphologies using a simple setup. For instance, Phonsuksawang et al. [9] reported the fabrication of coral-like NiS/CoS using a combination of hydrothermal and CBD. This work demonstrated a high areal capacitance of 2.16 F cm−2 at 10 mA cm−2. In CBD, the substrate is submerged in the growth solution which contains ions of interest. These ions gradually precipitate and form a coating on the substrate over time.
In this study, NiS/CoS was synthesized on nickel foam (NF) substrate using a one-step CBD process. The proposed method uses NF as the source of nickel ion, reducing the need for separate nickel ion sources. This method is also advantageous because the nickel ions are readily available on the substrate surface, promoting strong interaction between NF and the NiS/CoS layer to form well-adhered coating of the active material. The study also focuses on the outcome of different deposition times on the structure, morphology, and electrochemical properties. Optimal deposition time allows for stabilization of the growth process, leading to uniform and well-defined nanostructures, which are ideal for supercapattery application.
2. Materials and Methods
2.1. Synthesis of NiS/CoS/NF
NiS/CoS were deposited on NF substrates using CBD technique as outlined in Figure 1. The substrates were cleaned using an ultrasonic cleaner in the presence of 1 M hydrochloric acid (HCl), methanol, acetone, and deionized (DI) water. CBD process was carried out in a growth beaker, which consists of 50 mL of DI water, 0.10 M urea as the complexing agent, 0.05 M of cobalt (II) nitrate, and 0.05 M of thioacetamide as the cobalt and sulfur source, respectively.
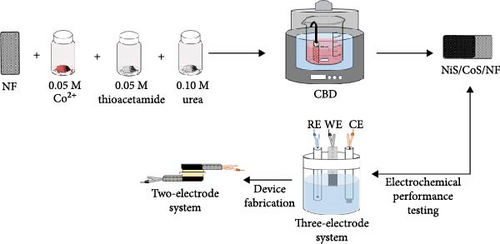
The mixture was stirred for 10 min leading to formation of a homogeneous solution. The precleaned NF were clipped vertically and submerged into the growth solution which was then placed into a stirring water bath setup. The deposition was carried out at 90°C for 1, 2, 2.5, and 3 h, in which the samples were named accordingly as NiS/CoS-1, NiS/CoS-2, NiS/CoS-2.5, and NiS/CoS-3. Upon complete deposition, the samples were rinsed in DI water and subsequent oven drying for 6 h prior to further characterization.
2.2. Material Characterization
The crystalline properties of the bimetallic sulfides were studied using an X-ray diffractometer (Bruker AXS D8 ADVANCE) at a scanning rate of 2° per minute. The Merlin, Gemini II field emission scanning electron microscope (FESEM) coupled with Oxford Instruments energy dispersive X-ray spectrometry (EDX) was used to analyze the morphological characteristics and composition of elements. The electronic composition of the samples were analyzed using X-ray photoelectron spectroscopy (XPS) with a Shimadzu system and a kα X-ray source.
2.3. Electrochemical Characterization
The measurements of the supercapattery cell were conducted using a two-electrode setup, with NiS/CoS/NF as the cathode and activated carbon (AC) smeared on NF serving as the anode. The negative electrode was fabricated using a slurry comprising AC, acetylene black, and PVdF with the ratio of 8:1:1 in the presence of N-methyl 2-pyrrolidone (NMP). The prepared slurry is applied to NF with a dimension of 1 cm × 2 cm and heated at 100°C for 3 h before it is ready for use.
3. Results and Discussion
3.1. Structural Properties of NiS/CoS/NF
The effect of CBD time on crystallinity of the active material was analyzed based on the X-ray diffractograms shown in Figure 2.
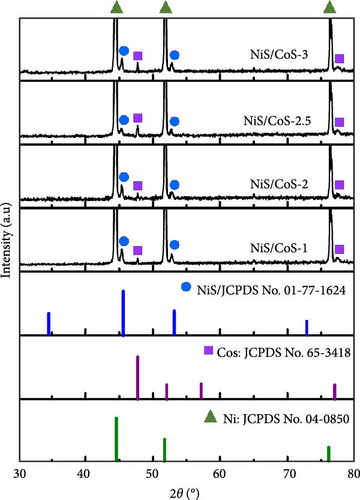
The samples exhibited significant XRD peaks at 44.52°, 51.90°, and 76.32°, which correspond to the NF (JCPDS No. 04-0850). Formation of NiS/CoS was evident due to the presence of new diffraction peaks at 45.33°, 47.76°, 52.82°, and 77.34°. These peaks coincide with the standard peaks of hexagonal NiS (JCPDS No. 01-077-1624) [10] and hexagonal CoS (JCPDS No. 65-3418) [11]. Upon hydrolysis, thioacetamide releases hydrogen sulfide, which reacts with the cobalt ion (Co2+) originating from the salt precursor and forms cobalt sulfide [12]. Concurrently, nickel ions (Ni2+) released from the NF substrate also react with the sulfur source to produce nickel sulfide. As predicted, the crystallinity of the bimetallic sulfide improved at higher deposition time. At the beginning of the deposition process, rapid nucleation takes place, leading to the formation of small and isolated structures with poor crystallinity. As the reaction progresses, these individual nuclei merge to form well-defined nanostructures with more well-ordered lattice structures, thus, enhancing the crystallinity.
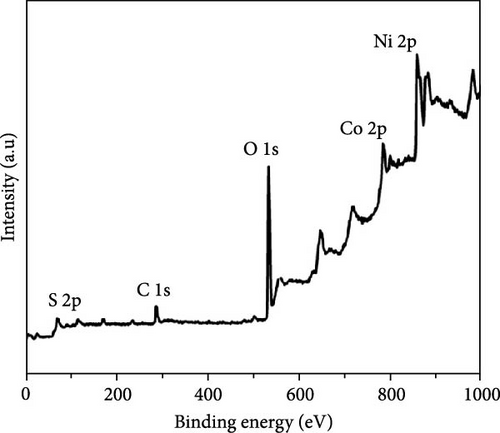
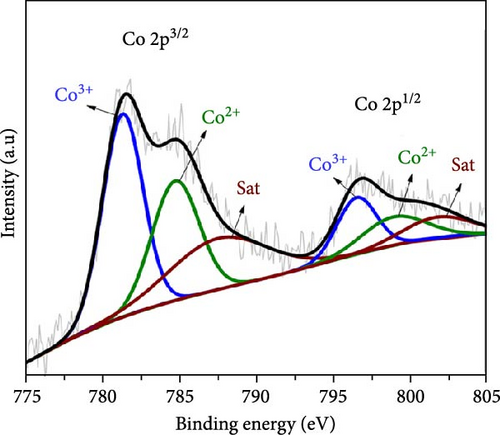
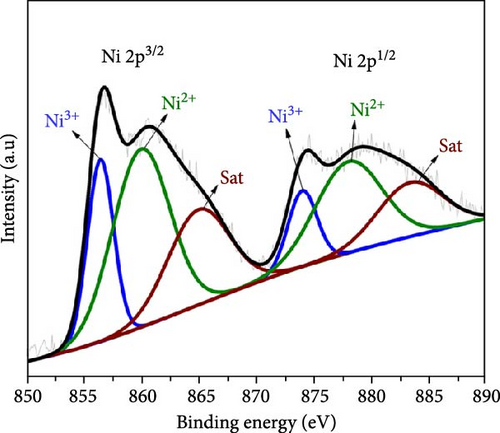
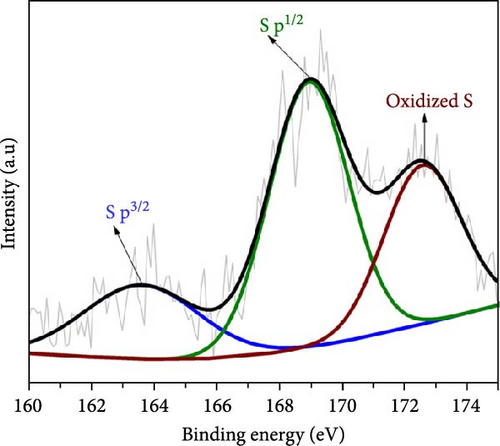
Figure 3 depicts the XPS analysis of NiS/CoS-2.5, which reveals the chemical valence states in the active material. The survey scan spectrum confirms the presence of Ni, Co, S, O, and C (Figure 3a). The high resolution XPS spectrums of Ni 2p, Co 2p, and S 2p were deconvoluted using the Gaussian fitting technique. The Co 2p high resolution XPS spectrum resolves into two spin–orbit doublets and two shakeup satellites corresponding to Co2+ and Co3+ states (Figure 3b). The Co 2p3/2 spectrum in the lower energy region deconvolutes into peaks at 781.4 and 784.9 eV which corresponds to Co3+ and Co2+, respectively [13]. The Co 2p1/2 spectrum shows a doublet ascribed to Co3+ and Co2+ at 796.6 and 799.1 eV. Similarly, deconvolution of the Ni 2p spectrum reveals two pairs of peaks assigned to Ni3+ and Ni2+ species. As shown in Figure 3c, the Ni 2p3/2 and Ni 2p1/2 signals at Ni3+ were detected at 856.5 and 874.2 eV, respectively. Meanwhile, the Ni 2p3/2 and Ni 2p3/2 signals of Ni2+ are located at 860.1 and 878.5 eV [14]. Figure 3d exhibits the high resolution XPS spectrum of S 2p, which resolved into two peaks at 163.7 and 168.6 eV attributed to S 2p1/2 and 2p3/2. Previous literature indicates that the peak at 163.7 eV is associated with the metal–sulfur bonds [15]. The peak at 172.3 eV, which is typically attributed to oxidized sulfur species, was also present in the spectrum [16].
3.2. Morphological Properties of NiS/CoS/NF
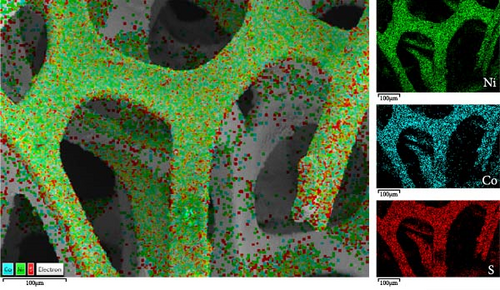
The evolution of the morphology of NiS/CoS nanostructures with increasing deposition time is obvious from the observation of FESEM micrographs of the samples. In NiS/CoS-1, the surface of NF still remains smooth with minimal coverage of the active material throughout the substrate (Figure 4a). With 2 h of deposition, NiS/CoS-2 showed a higher loading of active material on the surface of NF. Higher magnification images verified the formation of nanoclusters with more uniform and well-defined shapes (Figure 4b). At 2.5 h of deposition time, the sample showed the most interesting morphology. The nanostructures coalesced to form a spherical configuration with the spherical threaded surface, resembling a pollen grain-like structure (Figure 4c). The improvement in the morphology can be attributed to a higher extent of Ostwald ripening and surface energy minimization, which are facilitated by a longer deposition time. Finally, when the CBD process was extended up to 3 h, NiS/CoS-3 was arranged into more regularly-sized spheres (Figure 4d). With prolonged deposition time, the hollow surface structure found in NiS/CoS-2.5 was completely absent. Figure 4e depicts the EDX mapping of the FESEM micrographs to depict the uniform distribution of nickel, cobalt, and sulfur throughout the NF surface.


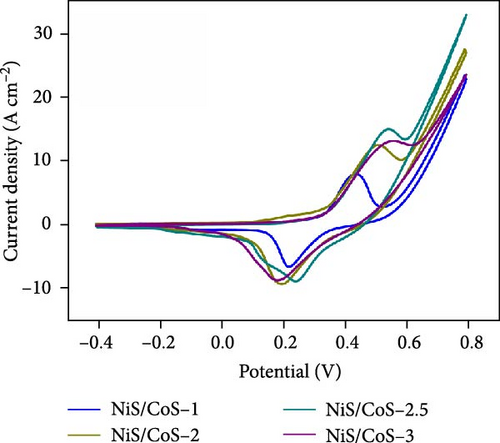
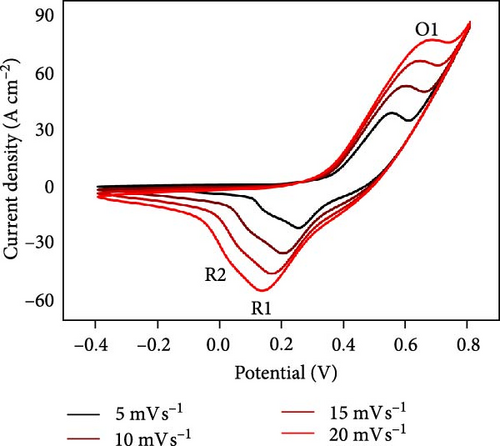
To assess the performance of NiS/CoS as an electrode component in supercapattery, electrochemical tests such as CV, GCD, EIS, and cycle stability were carried out. Figure 5a shows the CV plots of all fabricated electrodes. The CV measurement was studied in a three-electrode setup, where the Hg/HgO served as the reference electrode, platinum sheets as the counter electrode, and the prepared sample as the working electrode. The measurement was carried out within a potential window of −0.3 to 0.8 V in 1.0 M KOH electrolyte at scan rates between 5 and 30 mV s−1. From the CV curves, a pair of redox peaks can be seen, demonstrating pseudocapacitive properties.
3.3. Electrochemical Performance of NiS/CoS/NF
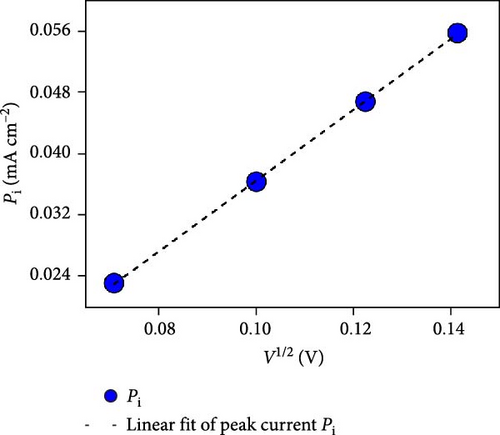
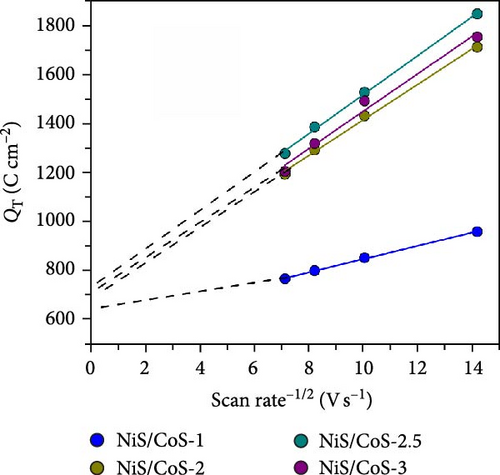
The NiS/CoS-2.5 sample underwent a series of CV measurements at scan rates between 5 and 30 mV s−1. The tests were carried out to gather more comprehensive data on the electrochemical performance of the electrodes. The CV curves are displayed in Figure 5b.
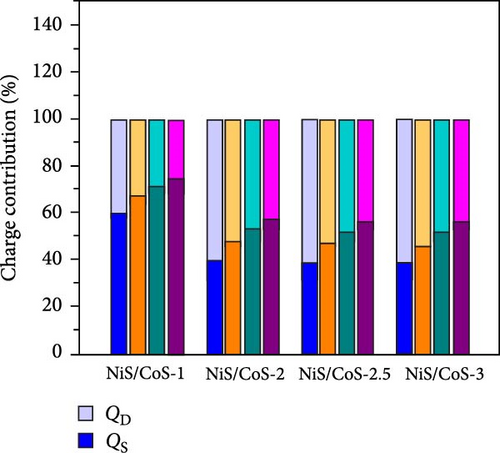
As shown in Figure 5e, the diffusion contribution of NiS/CoS-1, NiS/CoS-2.5, NiS/CoS-2.5, and NiS/CoS-3 were 39.8%, 59.4%, 60.7%, and 60.6%. The higher diffusion contribution in samples with deposition time longer than 2 h is attributed to the higher loading of active materials with abundant redox-active sites which promote faradaic reactions. At low scan rates, ions have sufficient time to diffuse into the deeper layers of the electrode, leading to a higher contribution from diffusion-controlled processes. Thus, for all the samples, as scan rate increased the diffusion contribution decreased.
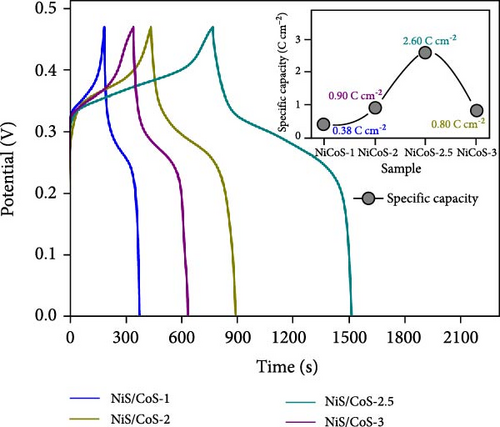
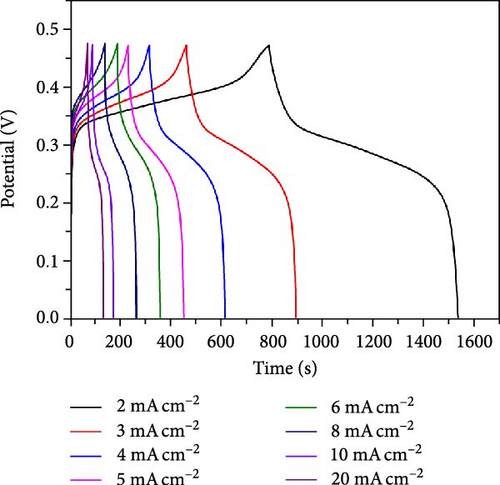
The energy storage capacity of the samples was assessed through GCD analysis. Figure 6a displays the GCD curves recorded at a current density of 2 mA cm−2 across the potential range of 0–0.47 V. The peaks observed in the CV profile correspond to the nonlinear charge and discharge curve, confirming the pseudo capacitance contribution from the electrode. The specific capacity is determined using Equation (1) and displayed in Figure 6a insets. The Cs emphasizes the impact of varying deposition times during the CBD process for sample fabrication on the charge storage performance of the samples. The highest Cs is observed when the sample is heated for 2.5 h. This is likely because the uniform NiS/CoS growth provides ample active sites for more effective OH− ion absorption. The increase in Cs can also be attributed to the hollow shape of the active material, providing more efficient pathways for ion diffusion. Extending the heating duration to 3 h leads to a decrease in Cs, associated to the increase in particle size as observed in the FESEM analysis. The increase in particle size leads to NiS/CoS agglomeration, which reduces the availability of sites for OH− ion absorption and desorption. Hence, the Cs for sample NiS/CoS-3 is 0.80 C cm−2, which is lesser than the Cs value of 2.60 C cm−2 found for sample NiS/CoS-2.5 measured at 2.0 mA cm−2 in 1.0 M KOH. The high specific capacity observed in sample NiS/CoS-2.5 is attributed to the rapid ion exchange facilitated by the well-organized NiS/CoS nanostructures on the substrate [21]. Comparison of GCD curves across different current densities for NiS/CoS-2.5 at current densities of 2 and 20 mA cm−2 are 2.60 and 0.74 C cm−2, respectively (Figure 6b). With the current density interval from 2 to 5 mA cm−2, the Cs retention is 79%. A high-capacity retention suggests strong charge storage capability, potentially due to rapid charge transfer associated with increased current densities [22]. The specific capacity value decreased to 1.82 C cm−2 as the current density increased to 6 mA cm−2. The value was further reduced to 1.21, 0.83, and 0.74 C cm−2 at current densities of 8, 10, and 20 mA cm−2. This shows that the sample could no longer sustain being charged at higher current densities than 5 mA cm−2. In this study, NF serves as both the substrate and a reactive source of nickel for the in situ formation of NiS/CoS. This process consumes a significant portion of the nickel at the surface of the substrate, potentially limiting the formation of Ni(OH)2 through corrosion in the alkaline KOH electrolyte. This observation is supported by the CV curves and GCD scan of pristine NF (Figure S2), which shows significantly lower capacitance compared to the NiS/CoS electrode, confirming the dominant role of the active material.
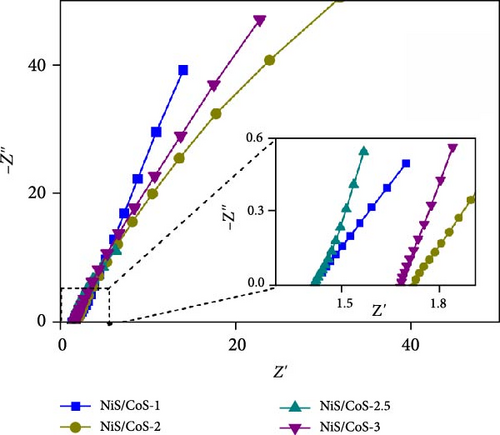
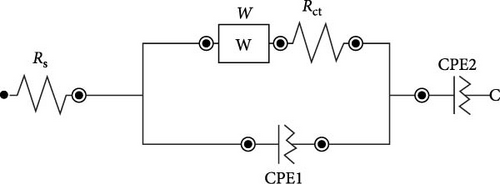
The EIS study of the electrodes is measured in a three-electrodes configuration as well with 1.0 M KOH electrolyte. The Nyquist plots of all samples are shown in Figure 6c. Similar electrochemical impedance characteristics were observed across all plots. The equivalent circuit corresponding to the Nyquist plot is included in Figure 6d. The EIS entails a high-frequency section forming a semicircle and a low-frequency region displaying an oblique line. Each region corresponds to its specific frequency range. The y-intercept of the semicircle on the x-axis in the high-frequency region is known as the equivalent series resistance (Rs). This value represents the total ionic resistance of the electrolyte, contact resistance, and the internal resistance of the material [23]. The RS values of sample NiS/CoS-1, NiS/CoS-2, NiS/CoS-2.5, and NiS/CoS-3 are 1.42, 1.71, 1.40, and 1.67 Ω. The charge transfer resistance (Rct) is calculated based on the redox reaction resistance, as shown by the high-frequency semicircle [24]. In the low-frequency range, an oblique line with a slope exceeding 45° can be seen, linked to diffusion and kinetic processes, referred to as Warburg impedance (W). The Rct values of sample NiS/CoS-1, NiS/CoS-2, NiS/CoS-2.5, and NiS/CoS-3 are 1.41, 0.54, 0.44, and 0.73 Ω. Compared to all the samples, NiS/CoS-2.5 electrode displayed the smallest Rct value. This low resistance supports more efficient electron diffusion and migration, contributing to its superior charge transfer mechanism. The homogeneous growth of NiS/CoS onto the NF greatly enhances ionic access to the active material surface. This observation is consistent with the FESEM findings. Table 1 summarizes the comparative charge storage performances from other contemporary works on TMSs. Many prior works on composite sulfides achieving high capacitance utilize the hydrothermal method, which often involves high temperature, long reaction times, and complex setups [33, 34]. In contrast, this work employs a CBD method—a simple, scalable, and cost-effective approach. This makes it highly suitable for industrial applications and overcomes some limitations of hydrothermal synthesis. In addition, unlike the common approach of synthesizing NiS/CoS separately and then coating them onto a substrate, this work employs an in situ growth process using NF as both the substrate and a source of nickel ions. This results in a tightly adhered active material layer on the NF surface, improving electron transport and mechanical stability during electrochemical cycling. From the table, sample NiS/CoS-2.5 has prospectively high specific capacity compared to other materials.
| Synthesis method | Substrate | Morphology | Charge storage performance | References |
|---|---|---|---|---|
| Chemical vapor deposition (CVD) and hydrothermal | Graphene foam | Nanosheets | 10.39 F cm−2 at 1 mA cm−2 | [25] |
| Hydrothermal | Carbon cloth | Nanosheets | 1653 F g−1 at 1 A g−1 | [26] |
| Hydrothermal | Nickel foam (NF) | Microspheres | 369 F g−1 at 0.5 A g−1 | [27] |
| Successive ionic layer adsorption and reaction (SILAR) | NF | Nanoflower | 1899 F g−1 at 5 mV s−1 | [28] |
| Hydrothermal | Porous carbon nanofibers | Nanowires | 334.7 mAh g−1 at 2 A g−1 | [29] |
| Hydrothermal | Polypyrrole coated NF | Nanoflower | 98.9 F g−1 at 1.84 A g−1 | [30] |
| Hydrothermal | Carbon fiber paper | Nanoparticles | 630.6 F g−1 at 1 A g−1 | [31] |
| Hydrothermal | Graphene-coated NF | Nanosheets | 4.55 F cm−2 at 1 mA cm−2 | [32] |
| Chemical bath deposition (CBD) | NF (as Ni precursor as well) | Nanopollen | 2.60 C cm−2 at 2.0 mAcm−2 | This work |
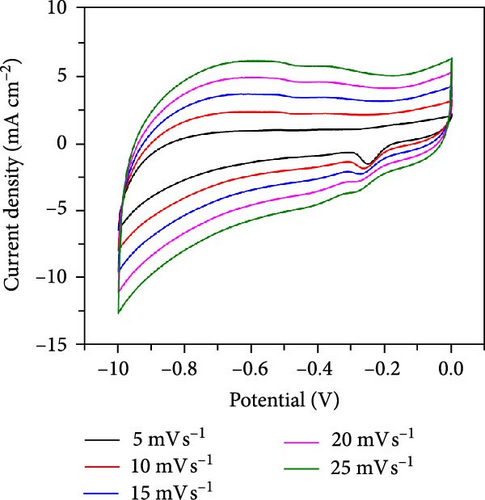
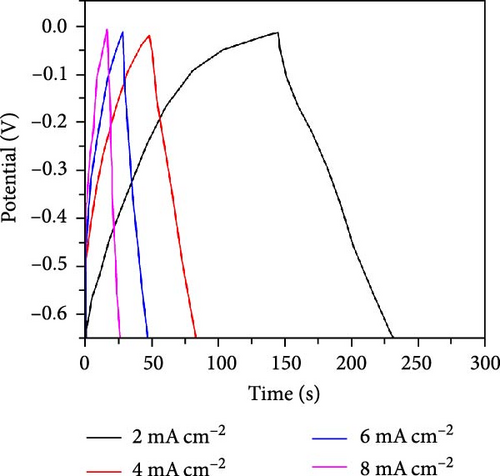
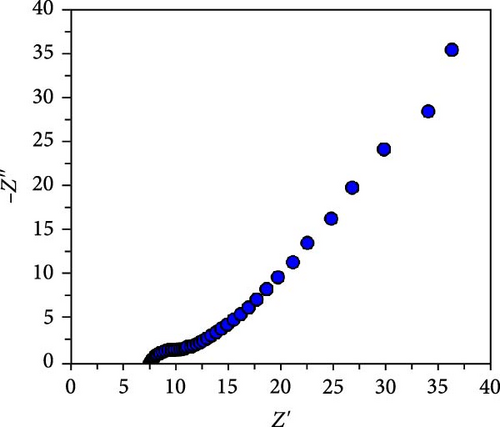
An asymmetric cell with the configuration NiS/CoS-2.5//PVA + KOH//AC was constructed to demonstrate the practical application of NiS/CoS as the positive electrode and to evaluate the cycling stability. Figure 7a shows the CV profile of AC coated NF which exhibits double-layer capacitive behavior, as evident from its near-rectangular curve shape, which reflects its ability to store charge through the formation of an electrochemical double layer at the electrode–electrolyte interface. No significant redox peaks were observed, indicating pure EDLC behavior with negligible pseudocapacitive contribution. The CV curve emphasizes that AC operates stably within the voltage range of 0 to −1.0 V in 1 M KOH. GCD measurements were conducted across a range of current densities between −0.65 and 0 V. As illustrated in Figure 7b, the GCD curves exhibit similar pattern, characterized by a typical nearly symmetrical triangular shape which is characteristic for EDLC material. The Nyquist plot of the AC electrode shows a RS and RCT of 7.44 and 3.16 Ω, respectively (Figure 7c). The stability of AC in the negative potential range complements the pseudocapacitive behavior of NiS/CoS, enabling a wide operating voltage range and enhancing the overall energy storage capacity of the asymmetric supercapattery.
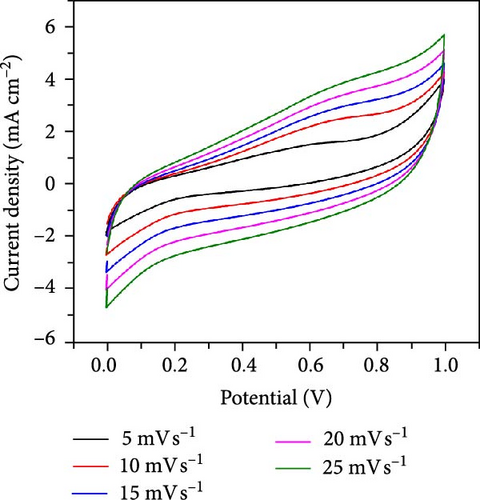
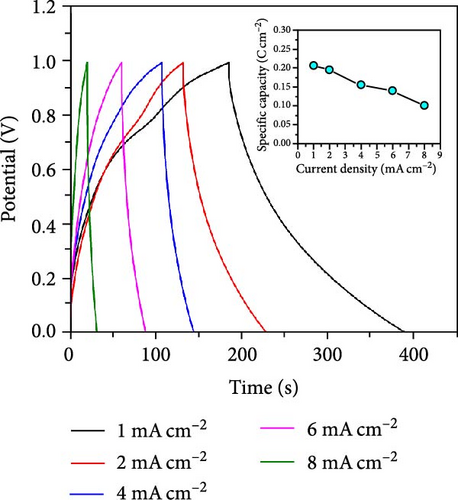
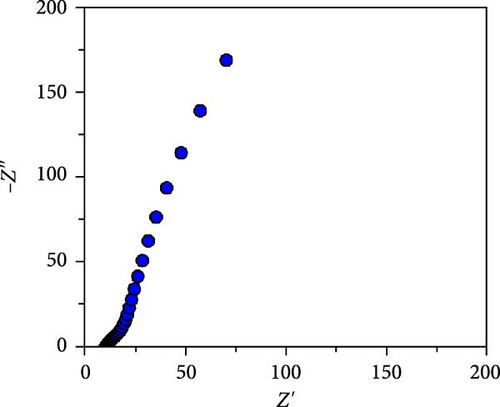
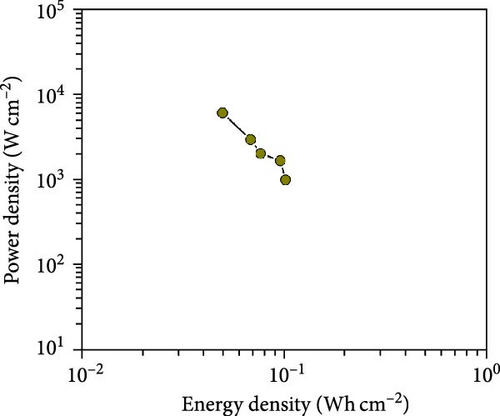
The CV curves of the cell at different scan rates are shown in Figure 7d. The CV curves show considerable asymmetry and consistent shape at all scan rates. It is evident that the broadening of the device’s redox peaks indicates a combination of EDLC and pseudocapacitance processes [37]. The redox peak shifts from lower to higher scan rates, indicating charge polarization within the device [38]. This confirms the superiority of the battery-type charge process, which leads to a decrease in charge as the scan rate increases. This suggests that ion diffusion is restricted to the outer active surface area of the electrodes [39]. Figure 7e presents the charge–discharge curves of NiS/CoS-2.5//PVA + KOH//AC at different current densities. The symmetric and nonlinear characteristics of the GCD profiles reflect the hybrid and reversible charge storage mechanism of the supercapattery device. The ASCs exhibited specific capacities of 0.207, 0.195, 0.156, 0.139, and 0.101 C cm−2 at current densities of 1, 2, 4, 6, and 8 mA cm−2, respectively. The percentage of retention rate of specific capacities is about 49.8% when the current density increases from 1 to 8 mA cm−2. The Nyquist plot of the ASC shows a RS and RCT of 9.78 and 0.75 Ω, respectively (Figure 7f). The overall charge storage performance of the asymmetric cell is shown in the Ragone plot (Figure 7g). At a specific capacity of 0.207 C cm−2 and an operating voltage of 1.0 V, the device exhibited a maximum energy density of 103.5 mWh cm−2 with a power density of 0.95 kW cm−2. The maximum power density was obtained at 5.86 kW cm−2 with an energy density of 50.5 mWh cm−2.
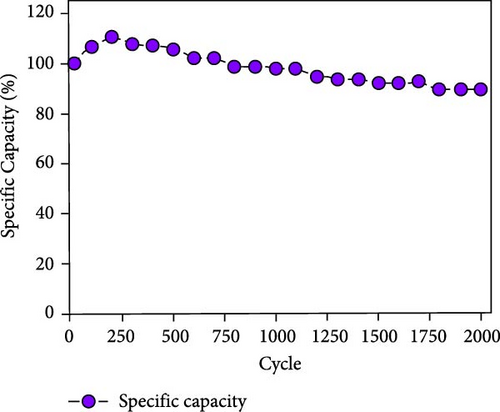
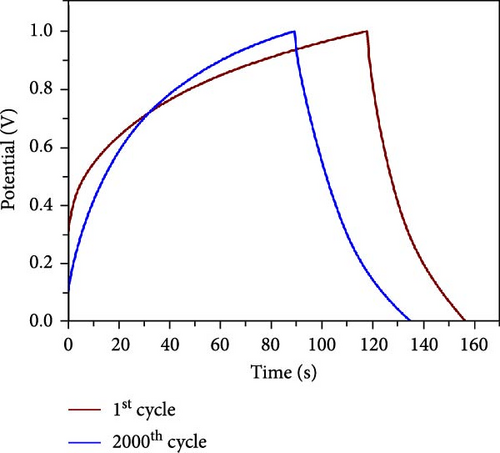
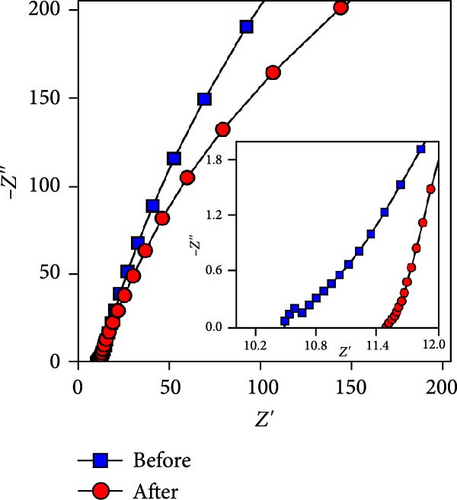
This cell was tested continuously for 2000 cycles at a current density of 4 mA cm−2 during charging and discharging. The NiS/CoS-2.5 electrode used in the cell had a total mass load of approximately 0.01120 g. The cell maintains excellent stability during continuous cycling. Figure 8a displayed the trend in specific capacity throughout the charge–discharge cycles. The specific capacity for the first 200 cycles was increased to 111% of the beginning value. Such a phenomenon is associated with the active material’s activation process, which led to inadequate utilization of NiS/CoS throughout the initial cycles [40]. Over the subsequent 200 cycles, the specific capacity decreased to 103%. Following 2000 cycles, the cell maintains approximately 90% of its original capacitance and can store charge. The minor attenuation in capacitance retention at high current densities indicates that the NiS/CoS-2.5 electrode maintains excellent electrochemical performance. This can also be confirmed by the GCD graph in Figure 8b having only slight changes between the 1st and 2000th cycle with specific capacity value of 0.19 and 0.17 C cm−2, respectively. The energy density and power density of the fabricated device is 115.0 mW h cm−2 and 2.62 kW cm−2, respectively before stability test and 102.8 mW h cm−2 and 2.74 kW cm−2 after 2000 cycles. The low-capacity value is mostly attributed to the usage of PVA in the electrolyte which is used to prevent leakage and enhance mechanical stability. However, this can reduce ionic conductivity compared to liquid electrolytes due to the restricted mobility of ions within the polymer matrix. In future studies, the performance of the device can be improved by replacing the negative electrode with RGO or graphite instead of AC. These materials can provide wider potential window, therefore, increase the specific capacity of the device. Figure 8c presents the EIS measurements taken before and after the cycling tests. After 2000 cycles, the Nyquist plot was shown to shift near higher resistance and the diameter of the semicircle extended. The Rct values were recorded as 0.33 Ω before cycling and 1.60 Ω after cycling. The higher resistance observed is probably due to the repeated charge–discharge processes. This low resistance is likely due to the strong synergistic interaction between NF and NiS/CoS [41]. Additionally, the porous nature of NF is advantageous for smooth electrolyte diffusion into and out of the electrode material, creating greater channels for swift ionic transitions [42].
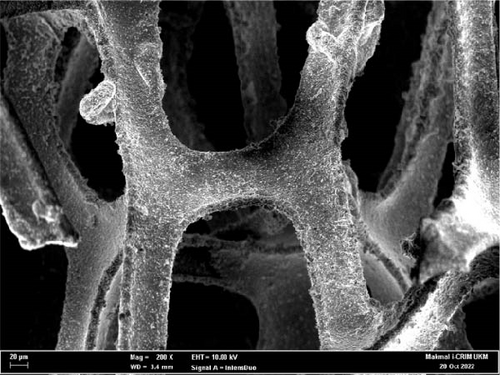
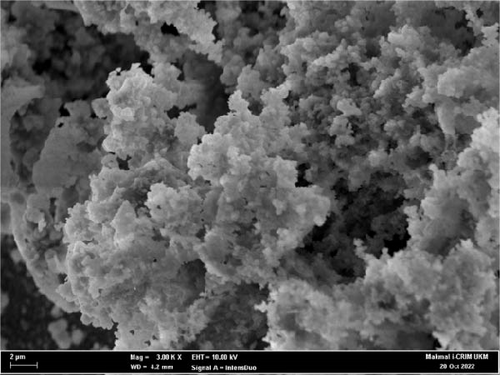
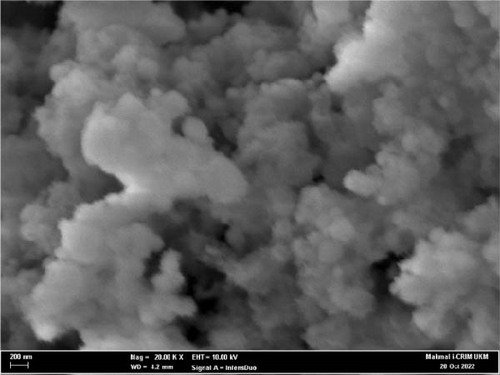
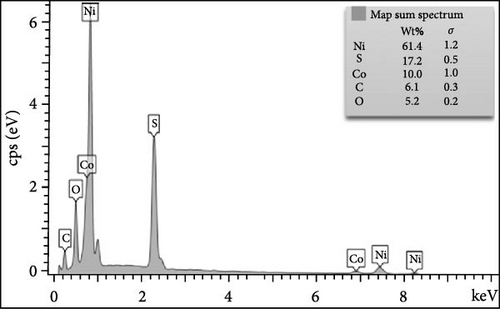
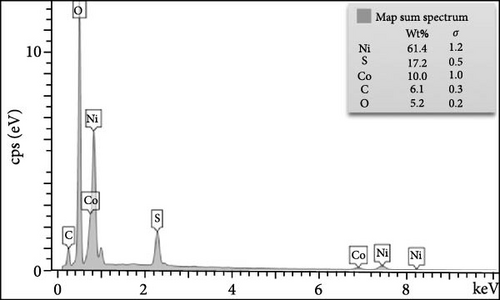
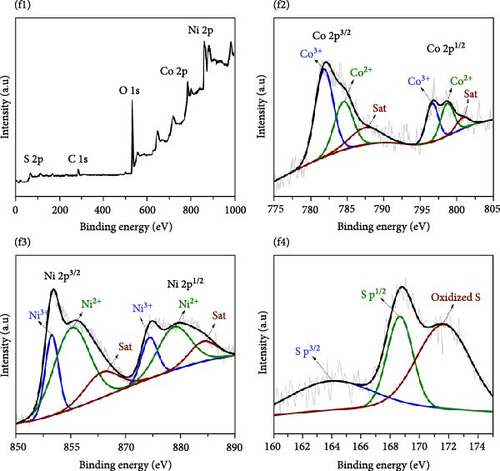
To better grasp the deviations in chemical composition states and morphology of NiS/CoS after the stability test, the samples were characterized to obtain XPS spectrum and FESEM micrographs. As seen in Figure 9a–c, upon continuous charge–discharge cycles, NiS/CoS-2.5 showed a similar spherical shape as before. However, the thread-like surface texture has completely diminished, forming a dense and opaque nanostructure. This transformation in morphology is identified as the primary rationale behind the decline in performance. The comparison of EDX spectrum before and after the stability test demonstrates a significant increase in the percentage of oxygen present in the sample in Figure 9d,e. After stability studies, the deconvoluted XPS spectrum of the sample showed similar electronic configurations in the valence states of nickel and copper, as shown in Figure 9f. However, in agreement with the EDX spectrum, the peak attributed to oxidized sulfur species displayed a substantial increase in area. This can originate from the electrochemical reaction upon consecutive charge–discharge cycles and surface oxidation following interaction between the electrode surface and the alkaline electrolyte.
4. Conclusions
This study explored the effect of different deposition times on the morphology and electrochemical properties of NiS/CoS electrode fabricated using CBD. When the deposition time was lower than the optimal duration, the coverage of active material on the substrate surface was poor, giving rise to low specific capacity. On the contrary, when the deposition was prolonged up to 3 h, the nanostructures agglomerated, leading towards a lapse in the hollow structure. At 2.5-h deposition time, the NiS/CoS coated on NF uniformly with the presence of pollen grain-like hollow structures. The effect of the unique morphology of NiS/CoS-2.5 was substantial in elevating the specific capacity to 2.60 C cm−2 at 2.0 mA cm−2, the highest among other samples. The NiS/CoS-2.5//PVA + KOH//AC supercapattery fabricated exhibited excellent electrochemical stability by retaining 90% of the initial value after 2000 cycles. Characterization of the electrodes poststability study revealed the transformation of surface morphology of the active material to be the main reason behind the decline in the capacity. Nevertheless, the chemical composition and structural integrity of the NiS/CoS electrode were intact, proving the material’s credibility for supercapattery application.
Conflicts of Interest
The authors declare no conflicts of interest.
Author Contributions
Vidhya Selvanathan: writing–original draft, formal analysis. Md. Rokonuzzaman: writing–review and editing, revision, supervision, funding acquisition. Syaza Amira Razali: drafting figures, writing, editing. Puvaneswaran Chelvanathan: revision and editing. Md. Ariful Islam: revision, formal analysis. Mohd Sukor Su’ait: supervision, writing–review and editing. Md. Akhtaruzzaman: supervision, writing–review and editing. Tiong Sieh Kiong: supervision, funding acquisition.
Funding
This work was sponsored by Tenaga Nasional Berhad (TNB) and UNITEN through the BOLD Refresh Postdoctoral Fellowships under the project code of J510050002-IC-6 BOLDREFRESH2025-Centre of Excellence and AAIBE Chair of Renewable Energy.
Acknowledgments
The authors would like to express their gratitude for the support provided by Monash University Malaysia (MUM). The authors also like to acknowledge Ms. Nur Nasuha Zolkifli and Mr. Mohamad Azri Tukimon from Center for Research and Instrumentation Management (CRIM), Universiti Kebangsaan Malaysia (UKM) for their assistance with the FESEM and XPS analysis, which was invaluable in the completion of this work.
Supporting Information
Additional supporting information can be found online in the Supporting Information section.
Open Research
Data Availability Statement
The data are available on request from the authors.


