Advanced Parameter Identification in Electric Vehicles Lithium-Ion Batteries With Marine Predators Algorithm-Based Optimization
Abstract
Accurate parameter identification of lithium-ion (Li-ion) battery models is critical for understanding battery behavior and optimizing performance in electric vehicle (EV) applications. Traditional methods often rely on manual adjustments or trial-and-error processes, leading to inefficiencies and suboptimal outcomes. This study introduces a novel parameter identification approach using the marine predators algorithm (MPA), applied to a Shepherd model for EV applications. The proposed technique was validated under various dynamic test conditions, including the urban dynamic driving cycle (UDDC), the new European driving cycle (NEDC), and the worldwide harmonized light vehicles test procedure (WLTP). The MPA-based method systematically identifies optimal parameters, achieving a voltage error of 2.743 × 10⁻³, a state of charge (SOC) error of 0.7693 × 10⁻³, and a root mean square error (RMSE) of 8.37 × 10⁻³ between the model and real data. Compared to other optimization techniques, the MPA demonstrated superior performance, achieving an optimization efficiency of 97.69%. These results validate the robustness and reliability of the method for accurately capturing battery dynamics under realistic driving conditions. These results highlight the potential of the MPA-based approach in improving the accuracy of Li-ion battery parameter identification, leading to more efficient energy management in EVs and contributing to enhanced battery performance and reliability.
1. Introduction
The battery, recognized as a significant energy-storage device, offers substantial potential for supporting the rapidly expanding smart grid concept and electrified transportation systems. This potential encompasses the capacity to store considerable amounts of energy over extended periods [1]. Lithium-ion (Li-ion) batteries are extensively employed in electric vehicles (EVs) due to their high energy density, rapid charging capabilities, and long cycle life [2–4].
Batteries, as the most used energy storage systems (ESSs), come in various electrochemical types depending on their chemistry model [5]. The market is dominated by Li-ion batteries because of its many advantageous features, such as their extended lifespan, low self-discharge rate, high power density, and lack of memory influence [6, 7]. Despite these advantages, batteries continuously degrade from their first use because of inevitable chemical reactions and potential internal short circuits [8]. Identifying a battery’s parameters is crucial for estimating its state of health (SoH) [9]. However, since these parameters can’t be determined directly, techniques based on models must be used to estimate them. Therefore, having an accurate battery model that is focused on applications is crucial.
Numerous studies in this field have been published, employing various methods to estimate battery parameters. Chen et al. [10] proposed a state of charge (SOC) prediction method using model error spectrum analysis. Researchers in [11–13] employed extended Kalman filters (EKFs) and unscented Kalman filters (UKFs) for estimating resistance–capacitance (RC) models. The choice of filter impacts the estimation accuracy, potentially increasing estimation errors. Wang et al. [14] employed adaptive square root UKF for SOC estimation. Xie et al. [15] proposed a recursive least squares method. An enhanced recursive least squares algorithm for identifying the parameters of second-order RC equivalent circuit models (ECMs) was introduced in [16]. Yong et al. [17] identified SOC using H-infinity filters; sequential-quadratic programing (SQP)-based methods were used to determine optimal parameters for the Shepherd battery model in [18].
Furthermore, intelligent identification strategies incorporating fuzzy logic, as detailed in [19, 20]. Deep learning techniques for predicting the remaining usable life of Li-ion batteries were explored in [21], and extreme learning machines [22] were used in machine-learning algorithms for estimating the SOC of Li-ion batteries.
Optimization metaheuristic algorithms (MAs) are currently gaining attention for tackling parameter identification problems due to their ability to seek wide optimal solutions without falling into local optima [23]. Several optimization algorithms, including genetic algorithm (GA) [24], salp swarm algorithm (SSA), particle swarm optimization (PSO), and gray wolf optimizer (GWO), have been used to identify battery parameters [25].
The Shepherd model, which captures the real nonlinear behavior of batteries, has also been utilized with various identification methods. Ferahtia et al. [26] proposed a novel artificial ecosystem optimization algorithm (AEO) based strategy to optimize Li-ion battery model parameters, tested across various batteries and profiles, and demonstrates its superiority over SSA, political optimizer (PO), the equilibrium optimizer (EO), and PSO methods. Other MAs applied include the bald eagle search algorithm (BES) [27, 28]. Houssein et al. [29], a modified version of the standard COOT algorithm, referred to as the modified COOT (mCOOT) algorithm, was proposed to address limitations and enhance the performance of the original COOT. This modified algorithm was subsequently used to identify the optimal parameters for a Li-ion battery model. To improve the balance between the exploration and exploitation phases and refine the position updates of search agents, the mCOOT integrates opposition-based learning (OBL) and a Phasor operator, thus strengthening its overall optimization capability.
Ferahtia et al. [30] employed the modified BES (mBES) to enhance the performance of the conventional BES. The mBES incorporates adaptive parameters that vary with the current and maximum iterations, facilitating a balanced transition from exploration to exploitation phases. This improved algorithm was then applied to determine Li-ion battery characteristics, serving as a validation of its performance. Additionally, battery identification parameters are optimized using the equilibrium algorithm (EA) [31]. In order to extract battery parameters for EV applications over multiple driving cycles, Ghadbane et al. [32] applied the self-adaptive Bonobo optimizer (SaBO). These methods identify the optimal values to minimize the difference between the measured battery performance and the model’s predictions by exploring the space of parameters.
This work uses the Shepherd model, as mentioned in Source [30, 32], to determine battery parameters but uses another identification algorithm. While the identification in Source [32] was based on the SaBO method and the identification in Source [27] was based on the mBES and PSO method, the current study estimates battery parameters using the marine predators algorithm (MPA) approach.
The MPA-based identification algorithm demonstrates superior competitiveness compared to other published optimizers, such as SaBO [29] and PSO [27], in terms of both convergence speed and complexity. This algorithm addresses the accuracy issues mentioned in the previous section, with results confirming its superiority in identification precision.
Comparative analyses indicate that MPA [33] outperforms other modern algorithms such as AEO [34], gradient-based optimizer (GBO) [35], pelican optimization algorithm (POA) [36], rain optimization algorithm (ROA) [37], white shark optimizer (WSO) [38], EO [39], ant lion optimizer (ALO) [40], tunicate swarm algorithm (TSA) [41], multiverse optimizer (MVO) [42], whale optimization algorithm (WOA) [43], and sine cosine algorithm (SCA) [44].
The proposed identification technique is based on enhancing the Shepherd battery model using the MPA optimizer. This research seeks to propose an optimum battery identification strategy based on the MPA algorithm by comparing the model’s output to real data of the battery. The method makes use of the MPA algorithm’s capability to achieve high-accuracy detection of battery parameters. Furthermore, because the MPA does not involve complicated analysis, this methodology is easier to implement than other approaches.
- -
Provide a novel method for determining the optimal parameters of a Li-ion battery model that is based on the MPA algorithm.
- -
Evaluate several identification profiles using the suggested method.
- -
Provide a thorough comparison between the suggested identification method and the AEO, GBO, POA, ROA, EO, WSO, ALO, TSA, MVO, WOA, and SCA to show why it is superior.
The organization of this paper is as follows: Section 2 discusses the battery storage system model, Section 3 details the identification approach and optimization algorithms, Section 4 presents the findings and their explanations, and Section 5 concludes this work.
2. Li-ion Battery Modeling
The selected EV utilizes a lithium iron phosphate (LiFePO4) battery as the primary power source, owing to its superior efficiency and elevated energy density relative to alternative battery technologies such as nickel–metal hydride (Ni-MH), nickel-cadmium (Ni-Cd), zinc-air, and lead-acid batteries.
The Shepherd battery model describes the behavior of a battery during discharge and charge processes. The battery’s model output voltage VModel is delineated in this manner [45, 46]:
3. Suggested Identification Approaches
The accurate identification of energy source parameters plays a crucial role in enhancing the energy management strategies for EVs. Parametric variations, especially in battery systems, can significantly affect the performance of energy storage models. Therefore, ongoing identification of internal parameters is essential to maintain model accuracy over time. This not only helps optimize energy management but also ensures that the models continue to reflect the actual operating conditions of EVs.
In this context, VData (N) denotes the measured data at instant N.Ts, VModel (N) denotes the model output voltage at instant N.Ts, k denotes the size of the measurement data set, and Ts refers to the sampling time.
The primary aim is to discover the optimal set of unknown model parameters, denoted as x, that minimizes the objective function as much as possible.
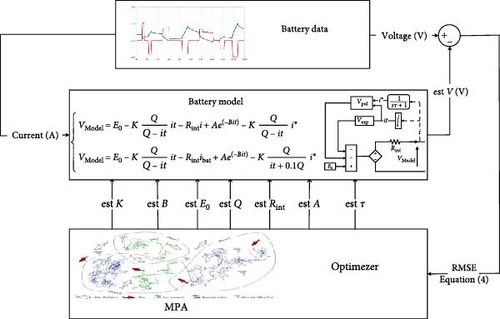
Algorithms like MPA, AEO, GBO, POA, ROA, EO, WSO, ALO, TSA, MVO, WOA, and SCA are used to solve the optimization issue given in Equation (4) and the parameters defined in Equation (5). These algorithms evaluate the signals that the battery model provides and then compare the output of the model with the actual voltage of the battery. The optimizer adjusts the positions of its agents iteratively to fine-tune the identification parameters, gradually convergent to the real values by specifying the RMSE, as shown in Figure 1.
3.1. Marine Predator Algorithm
The MPA is a metaheuristic optimization algorithm inspired by the behavior of aquatic predators during foraging. The algorithm leverages strategies such as Levy and Brownian movements to optimize the search process, ensuring effective exploration and exploitation of the search space. Here is a detailed breakdown of its essential steps:
3.1.1. Population Initialization
A set of solutions (referred to as the population of preyi) are randomly initialized.
To create a diverse starting point for the optimization process.
3.1.2. Phase 1: Brownian Motion (First Third of Iterations)
During this phase, the prey updates its location based on Brownian motion.
3.1.3. Phase 2: Combination of Brownian and Levy Motion (Second Third of Iterations)
In this phase, predators use the Brownian motion while prey use the Levy motion. The population is split into two halves with different updating rules.
If max iteration 2/3 > actual iteration > max iteration/3.
-
- Second half of population:
3.1.4. Phase 3: Levy Motion (Last Third of Iterations)
In this phase, both the predator and prey move based on Levy motion.
Figure 2 in the referenced material provides a flowchart summarizing these steps, offering a visual guide to the MPA’s implementation.
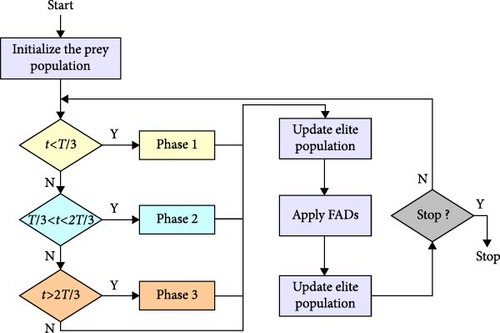
The MPA’s structure allows it to balance between local search (exploitation) and global search (exploration) effectively, leveraging the dynamic behavior of aquatic predators in nature. This balance is key to its high performance in optimizing complex problems. The MPA was initiated with a population size of 30 and allowed to run for a maximum of 50 iterations. The convergence criterion was established as a change in fitness value of less than 8.6 × 10⁻³ between iterations. Additionally, the search space was bounded by lower and upper restrictions, set to 80% and 120% of the actual parameter values, respectively. Notably, the MPA’s convergence rate is advantageous, typically requiring only 10–20 iterations to achieve the optimal solution, distinguishing it from other optimization methods, which often require a higher number of iterations to achieve similar performance.
4. Results and Discussion
The Li-ion battery was created using Matlab Simulink. Within the confines of the exploration area, random solutions were generated and subsequently assigned to the model. After that, the model was ran using these numbers, and the outcomes were compared to the collected data. Equation (4) was used to calculate the inaccuracy into the final result. This approach used the ECE-15 current profile from the urban driving cycle, and the observed output voltage was used as identification.
It appears from the MAs that their starting points differ from run to run. The robustness of the method is measured by its capacity to yield results that are almost exactly the same while using various identification techniques. Robustness can be assessed using statistical tests like Tukey and ANOVA. Comparing the suggested method against a number of MAs, including AEO, GBO, POA, ROA, EO, WSO, ALO, TSA, MVO, WOA, and SCA, demonstrated its superior performance. Since MAs are by their very nature random, each approach was tested 10 times to guarantee accuracy and dependability. Table 1 lists the settings for the optimization, which include a maximum number of iterations (T = 50), a population size (N = 30), and lower and upper search space restrictions set at 80% and 120% of the actual value, respectively.
| Parameter | T | N | Nruns | D | Lb (%) | Ub (%) |
|---|---|---|---|---|---|---|
| Value | 50 | 30 | 10 | 7 | 80 | 120 |
A specified current was delivered to the Li-ion battery under consideration. The output voltage was recorded and used during the identification process. Figure 3 shows the applied current and measured voltage.
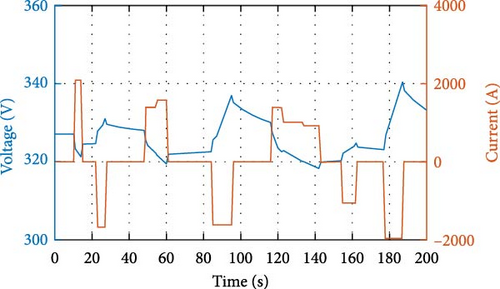
Table 2 illustrates the last configurations for the initial, middle, and last runs. The results of the identification tests are shown in Table 3.
| Run numb | MA’s | Q | Rint (10−3) | A | K (10−3) | B | τ | E0 | Fitness (10−3) |
|---|---|---|---|---|---|---|---|---|---|
| Real value | 1500 | 1.8667 | 23.513 | 1.3985 | 0.0407 | 20 | 303.620 | NA | |
| 1 | MPA | 1200.0841 | 1.6153 | 25.3167 | 1.4618 | 0.0374 | 20.8521 | 301.80 | 8.60 |
| 5 | 1207.6214 | 1.6169 | 22.5698 | 1.4586 | 0.0426 | 20.7700 | 304.5469 | 8.37 | |
| 10 | 1200 | 1.61418 | 21.1271 | 1.4527 | 0.0462 | 20.7367 | 306.0120 | 8.21 | |
| 1 | AEO | 1328.4843 | 1.6239 | 21.7967 | 1.4629 | 0.0444 | 20.91974 | 305.3375 | 8.35 |
| 5 | 1309.9442 | 1.6131 | 26.5737 | 1.4836 | 0.0350 | 21.0733 | 300.5192 | 8.93 | |
| 10 | 1488.1326 | 1.6206 | 21.6262 | 1.4968 | 0.0441 | 21.3185 | 305.4548 | 8.81 | |
| 1 | GBO | 1255.4623 | 1.5939 | 20.1280 | 1.4706 | 0.0487 | 20.9801 | 307.0015 | 8.36 |
| 5 | 1483.3720 | 1.6454 | 24.6398 | 1.4675 | 0.0388 | 21.1353 | 302.5037 | 8.83 | |
| 10 | 1200 | 1.6028 | 20.6135 | 1.4262 | 0.0479 | 20.3857 | 306.5387 | 8.35 | |
| 1 | POA | 1562.3049 | 1.6794 | 20.6825 | 1.4487 | 0.0476 | 21.5741 | 306.5858 | 1.10 |
| 5 | 1419.1719 | 1.6587 | 23.7380 | 1.3742 | 0.0424 | 19.7497 | 303.5077 | 1.12 | |
| 10 | 1343.7253 | 1.6912 | 26.3465 | 1.3649 | 0.0376 | 19.8928 | 300.9512 | 1.22 | |
| 1 | ROA | 1200.3376 | 1.6998 | 20.7282 | 1.5631 | 0.0470 | 23.1329 | 306.4620 | 1.20 |
| 5 | 1800 | 1.7378 | 24.6170 | 1.6095 | 0.0377 | 24 | 302.4952 | 1.47 | |
| 10 | 1711.7076 | 1.6495 | 25.7989 | 1.4982 | 0.0359 | 21.3415 | 301.2799 | 9.38 | |
| 1 | EO | 1647.8554 | 1.5416 | 24.1629 | 1.4530 | 0.0399 | 20.6859 | 302.9786 | 9.67 |
| 5 | 1693.6122 | 1.5608 | 28.2156 | 1.4169 | 0.0340 | 20.2192 | 298.9541 | 9.99 | |
| 10 | 1352.0670 | 1.674 | 20.6483 | 1.4341 | 0.0488 | 21.0016 | 306.5966 | 9.24 | |
| 1 | WSO | 1427.1015 | 1.6756 | 20.4913 | 1.4987 | 0.0410 | 22.8928 | 306.6243 | 9.51 |
| 5 | 1291.7489 | 1.6459 | 24.1280 | 1.4627 | 0.0363 | 21.9003 | 302.8697 | 1.4 | |
| 10 | 1506.9474 | 1.7799 | 24.6478 | 1.3570 | 0.0416 | 20.3085 | 302.7146 | 1.22 | |
| 1 | ALO | 1377.1480 | 1.6691 | 24.6596 | 1.2956 | 0.0416 | 19.0855 | 302.6736 | 1.43 |
| 5 | 1299.2566 | 1.6273 | 21.3959 | 1.2624 | 0.0481 | 17.6937 | 305.8356 | 1.71 | |
| 10 | 1734.1539 | 1.7121 | 20.9984 | 1.4079 | 0.0488 | 23.2247 | 306.4671 | 2.26 | |
| 1 | TSA | 1665.4590 | 1.9487 | 27.8620 | 1.1188 | 0.0357 | 17.3496 | 299.6682 | 3.57 |
| 5 | 1749.9855 | 1.5321 | 21.0228 | 1.4427 | 0.0462 | 20.0847 | 305.8377 | 1.85 | |
| 10 | 1200 | 1.4985 | 18.8106 | 1.5725 | 0.0466 | 21.3582 | 308.1498 | 1.86 | |
| 1 | MVO | 1800 | 1.6577 | 24.7906 | 1.5492 | 0.0426 | 21.9851 | 302.5675 | 2.11 |
| 5 | 1774.7859 | 1.5561 | 27.2898 | 1.2863 | 0.0413 | 19.3494 | 300.2686 | 2.39 | |
| 10 | 1741.9620 | 1.9212 | 26.3275 | 1.4717 | 0.0423 | 24 | 301.1696 | 3.13 | |
| 1 | WOA | 1678.4982 | 1.8656 | 27.9527 | 1.2614 | 0.0412 | 23.7095 | 300.0475 | 3.77 |
| 5 | 1713.5688 | 1.4935 | 26.8992 | 1.5037 | 0.0462 | 19.3102 | 300.7171 | 5.50 | |
| 10 | 1612.8033 | 1.9803 | 27.3 | 1.4023 | 0.0472 | 19.8033 | 306.5058 | 5.67 | |
| 1 | SCA | 1340.3114 | 1.7210 | 28.1796 | 1.1656 | 0.036 | 19.2194 | 299.3314 | 27.443 |
| 5 | 1200 | 2.0914 | 25.8771 | 1.6782 | 0.0340 | 23.8700 | 301.1854 | 31.096 | |
| 10 | 1714.5643 | 1.6318 | 20.5907 | 1.4191 | 0.0441 | 18.4850 | 306.4354 | 25.58 | |
| MAs | Best (10−3) | Worst best (10−3) | Mean best (10−3) | STD best (10−3) | Efficiency (%) | Elapsed time (s) | Total voltage error (10−3) | Total SOC error (10−3) |
|---|---|---|---|---|---|---|---|---|
| MPA | 8.17 | 8.63 | 8.37 | 0.154 | 97.69 | 312.41 | 2.743 | 0.7693 |
| AEO | 8.35 | 9.75 | 8.79 | 0.365 | 95.21 | 325.80 | 56.70 | 24.307 |
| GBO | 8.35 | 10.1 | 8.81 | 0.562 | 95.11 | 159.69 | 39.94 | 47.06 |
| POA | 8.58 | 15.3 | 11.1 | 1.787 | 79.23 | 319.25 | 37.13 | 7.693 |
| ROA | 9.38 | 15.8 | 11.6 | 2.028 | 83.07 | 154.44 | 114.23 | 23.28 |
| EO | 8.28 | 25.4 | 11.7 | 4.661 | 77.19 | 155.34 | 43.38 | 10.25 |
| WSO | 9.11 | 17.6 | 12.2 | 2.544 | 77.90 | 166.1 | 565.19 | 8.645 |
| ALO | 9.61 | 35.9 | 20.1 | 8.703 | 58.64 | 154.65 | 15.991 | 2.4426 |
| TSA | 14.2 | 35.7 | 24.7 | 7.691 | 63.57 | 159.03 | 138.51 | 47.06 |
| MVO | 10.7 | 48.2 | 27.2 | 10.676 | 46.80 | 157.97 | 171.76 | 31.3 |
| WOA | 19.2 | 70.5 | 44 | 13.627 | 49.17 | 154.20 | 191.35 | 2.02485 |
| SCA | 25.6 | 47.4 | 36.5 | 7.444 | 73.02 | 158.71 | 86.48 | 23.56 |
Table 2’s results show that all estimated parameters are rather near to their real values despite differences in identification accuracy between different methods and runs.
The fitness function’s evolution across 10 distinct runs is shown in Figure 4, illustrating the MPA’s superiority over other optimizers with a lower final fitness value and a faster convergence rate. Figure 5 further highlights the MPA’s advantage, showing the progression of the mean fitness value and confirming that the MPA reaches the optimal solution in just 10–20 iterations, outperforming other optimization methods in both convergence speed and accuracy.
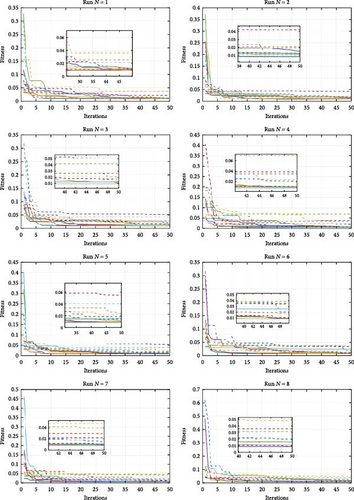
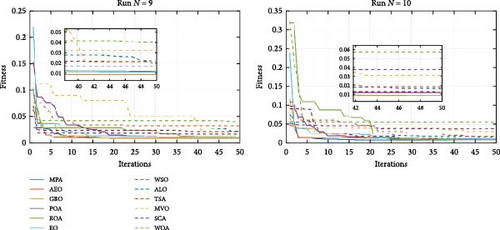
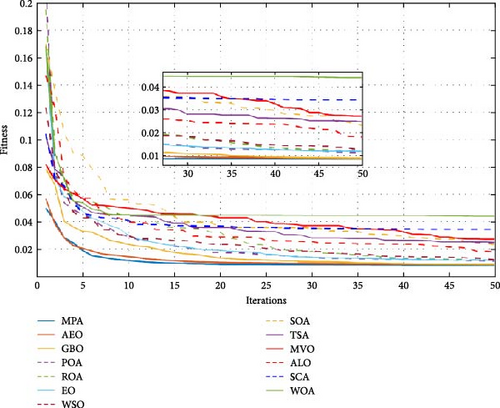
Table 4 presents the statistical analysis, revealing that MPA achieved an optimal mean fitness value of 8.37 × 10⁻³, with the best values for standard deviation (1.54 × 10⁻⁴) and maximum (8.63 × 10⁻³), along with an optimization efficiency of 97.69%. Despite taking slightly longer than other optimizers, the MPA method produced minimal overall voltage error. These results are further validated by Houssein et al. [29] during the ECE-R15 driving cycle, where MPA demonstrated a mean fitness value of 8.37 × 10⁻³, outperforming SaBO by a factor of 1.02 and achieving an efficiency of 97.69% with minimal voltage and SOC errors.
| Metric | SaBO | NGO | AOA |
|---|---|---|---|
| Best (10−3) | 8.350 | 8.590 | 29.3 |
| Worst (10−3) | 9.070 | 12.300 | 129 |
| Mean (10−3) | 8.640 | 9.810 | 67 |
| STD | 0.205 × 10⁻³ | 1.022 | 28.302 |
| Efficiency (%) | 96.6 | 88.4 | 51.94 |
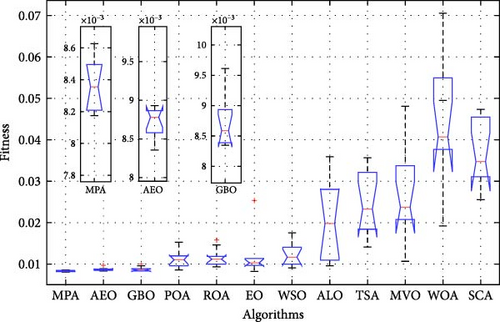
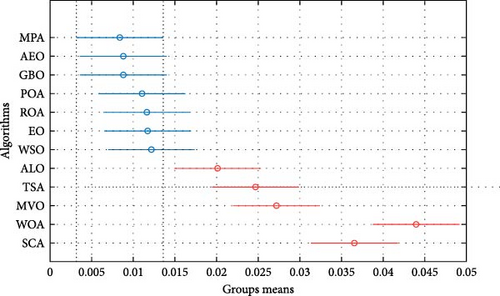
Additionally, Table 5 and Figures 6 and 7 highlight the ANOVA and Tukey test results, which further confirm MPA’s superiority in accurately identifying battery parameters. These statistical analyses validate the effectiveness of the proposed identification approach for Li-ion batteries, reinforcing MPA’s exceptional performance across multiple evaluation metrics.
| Source | SS | df | MS | F | Prob > F |
|---|---|---|---|---|---|
| Columns | 0.01568 | 11 | 0.00143 | 29.27 | 1.66128 × 10⁻²⁷ |
| Error | 0.00526 | 108 | 0.00005 | — | — |
| Total | 0.02094 | 119 | — | — | — |
The ANOVA results show a highly significant difference between the means of the 12 groups. The extremely small p-value (1.66128 × 10⁻²⁷) indicates that the observed differences are not due to random chance.
The F-statistic (29.27) compares the variation between group means to the variation within the groups. A higher F-statistic indicates that the differences between group means are more significant compared to the variability within each group. In this case, the F-statistic of 29.27 suggests that the differences between the groups are not likely due to random chance.
The corresponding p-value (1.66 × 10⁻27) is extraordinarily small, meaning the probability of observing such extreme differences under the null hypothesis (assuming no real difference between the groups) is virtually zero. This indicates that the differences between the groups are statistically significant, confirming that at least one of the group means is different from the others.
Tukey’s post hoc test should be used to pinpoint which specific group means differ significantly from each other. In this work, five groups have means significantly different from MPA (ALO, TSA, MVO, WOA, and SCA), as shown in Figure 7.
In Figures 8 and 9, the predicted and actual voltages, as well as the SOC variations over time, are compared, demonstrating a slight range of error and confirming the accuracy and robustness of the MPA-based algorithm in identifying battery parameters.
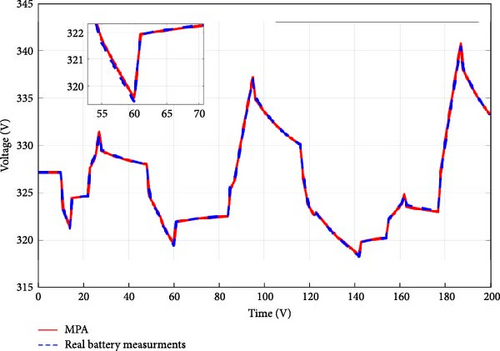
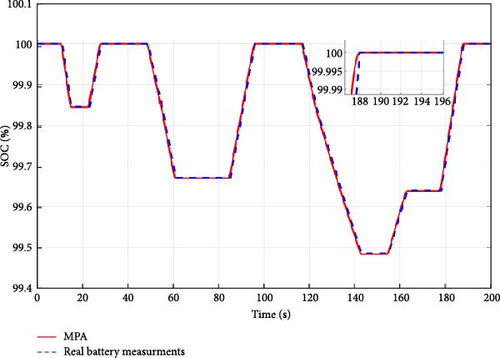
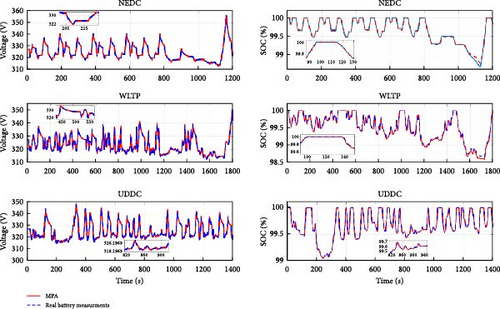
To verify the efficacy of the proposed approach, actual drive cycle data from EVs, including the urban dynamic driving cycle (UDDC), the new European driving cycle (NEDC), and the worldwide harmonized light vehicles test procedure (WLTP), were used. The battery performance was simulated using the identified optimal parameter values, and the outcomes were compared to the battery’s real performance during the driving cycle. The variations over time between the predicted and observed voltage and SOC, depicted in Figure 10, demonstrate the accuracy of the method in predicting battery usage and its effectiveness in EV applications. The obtained results confirm the ability of the proposed algorithm to accurately identify battery parameters under various dynamic conditions.
These findings suggest that MPA has significant potential for EV applications, with its high accuracy and robustness in parameter identification, which is essential for reliable energy management. MPA’s computational efficiency, though relatively slower than other methods, provides a balance between accuracy and dependability, making it a promising approach for real-time battery modeling. While MPA has proved effective, limitations such as its computational intensity should be addressed to enhance its suitability for real-time applications. Future research will extend MPA’s applicability beyond EV contexts, exploring other fields to test its versatility. Efforts will also focus on improving MPA’s computational efficiency to support large-scale applications. Expanding this research will contribute to developing more adaptable and reliable energy solutions across various applications.
5. Conclusion
This study presents a robust and advanced approach for parameter identification in Li-ion batteries, which is essential for optimizing performance in EV applications. Using RMSE as an objective function, the MPA was evaluated alongside several optimization techniques, including AEO, GBO, POA, ROA, WSO, EO, ALO, TSA, MVO, WSO, and SCA. The MPA demonstrated superior performance, achieving a voltage error of 2.743 × 10⁻³, a SOC error of 0.7693 × 10⁻³, and a mean RMSE of 8.37 × 10⁻³. Additionally, the ANOVA results show that the parameters identified by the MPA technique are significantly higher for the Li-ion battery, with a high F value of 26.77 and an extremely low probability value of 1.09624 × 10⁻¹⁷. These findings confirm that the observed differences are due to the efficiency of the MPA method in identifying the optimal battery parameters.
The MPA achieved an optimization efficiency of 97.69% and demonstrated strong robustness (StD: 1.54 × 10⁻⁴), validating its effectiveness in accurately identifying the optimal parameters for battery models. These results highlight the importance of advanced optimization techniques, such as MPA, for improving battery management, enhancing energy utilization, extending battery life, and optimizing overall EV performance.
Future research will focus on broadening the application of the MPA beyond EVs, exploring its potential in real-time, large-scale applications, and its adaptability to other battery models, such as Thevenin and ECM models. Furthermore, efforts will be made to enhance the computational efficiency of MPA for more extensive and dynamic applications, paving the way for more sustainable and adaptable energy solutions.
Nomenclature
Abbreviations
-
- EV:
-
- Electric vehicle
-
- RMSE:
-
- Root mean square error
-
- MPA:
-
- Marine predators algorithm
-
- MVO:
-
- Multiverse optimizer
-
- GBO:
-
- Gradient-based optimizer
-
- SCA:
-
- Sine cosine algorithm
-
- AEO:
-
- Artificial ecosystem optimization algorithm
-
- ROA:
-
- Rain optimization algorithm
-
- WOA:
-
- Whale optimization algorithm
-
- WSO:
-
- White shark optimizer
-
- TSA:
-
- Tunicate swarm algorithm
-
- POA:
-
- Pelican optimization algorithm
-
- EO:
-
- Equilibrium optimizer
-
- ALO:
-
- Ant lion optimizer
Symbols
-
- i:
-
- Actual battery current
-
- i ∗:
-
- Filtered battery current
-
- τ:
-
- Time constant
-
- Q:
-
- Battery capacity
-
- E0:
-
- Open-circuit battery voltage
-
- K:
-
- Polarization constant
-
- it:
-
- Actual battery charge
-
- Rint:
-
- Battery’s internal resistance
-
- A:
-
- Exponential zone amplitude
-
- SOCi:
-
- Initial battery state of charge
-
- VModel:
-
- Model output voltage
-
- VData:
-
- Measured data
-
- Ts:
-
- Sampling time
-
- k:
-
- Size of the measurement data set
-
- Ub:
-
- Upper bounds for the potential solutions
-
- Lb:
-
- Lower bounds for the potential solutions
-
- D:
-
- Parameters number
-
- t:
-
- Current iteration
-
- T:
-
- Maximum number of iterations
-
- N:
-
- Population size
-
- Nruns:
-
- Runs number
-
- P:
-
- Constant number
-
- Preyi:
-
- Candidate solutions
-
- Elitei:
-
- Predator position.
Conflicts of Interest
The authors declare no conflicts of interest.
Author Contributions
Study conception: Houssam Eddine Ghadbane and Hegazy Rezk. Analysis and interpretation of results: Hesham Alhumade and Houssam Eddine Ghadbane. Draft manuscript preparation: Hesham Alhumade, Houssam Eddine Ghadbane, and Hegazy Rezk. All authors reviewed the results, approved the final version of the manuscript, and agreed to be accountable for the content and conclusions of the article.
Funding
This research was supported by King Abdulaziz University (GPIP: 873-135-2024).
Acknowledgments
This project was funded by the Deanship of Scientific Research (DSR) at King Abdulaziz University, Jeddah, under grant no (GPIP: 873-135-2024). The authors, therefore, acknowledge with thanks DSR for technical and financial support.
Open Research
Data Availability Statement
The data used to support the findings of this study are available from the corresponding author upon request.


