Dual-Level Prediction Methodology and Software Platform for Roof Pressure in Coal Mining Faces: Case Study of Hongliulin Coal Mine
Abstract
To mitigate roof accidents through advanced prediction of periodic roof pressure behavior (including location and timing), this study proposes a novel dual-level prediction methodology integrating mathematical statistics and deep learning algorithms. The methodology establishes a hybrid prediction system that achieves dynamic fusion of both approaches through temporal feature extraction and prediction horizon optimization, enabling hierarchical precision in roof pressure forecasting. Using ground pressure monitoring data from Panel 15,219 of Hongliulin Coal Mine as a benchmark, we developed an integrated software solution, and validated the system through field application. Results demonstrate that the statistical method achieves 75% prediction accuracy (< 1.6 m error) with approximately 6-h advance warnings, while the deep learning component improves accuracy to 90% (< 1.6 m error) within 1–2 h horizons. The synergistic combination optimizes the trade-off between prediction lead time and spatial accuracy. This intelligent system enables automated analysis of massive ground pressure datasets and precise roof pressure forecasting, providing critical decision-support for coal mine safety management.
1. Introduction
Roof pressure refers to the phenomenon of intense pressure changes that occur when the stress equilibrium of the rock strata in a coal mining area is disrupted, and the surrounding rock seeks a new stress balance. This is typically manifested as pressure variations around the working face and on hydraulic supports [1]. In-depth research into the mechanisms of roof pressure, the patterns of initial weighting, and the periodic weighting, along with the ability to predict the location and timing of these events as early as possible, is crucial for preventing support failures and roof collapses, thereby ensuring the safety and productivity of coal mining operations [2–4].
With the application of electronic sensors and information technology in the mining sector, the prediction of roof disasters in mining areas primarily relies on the pressure data collected by the online monitoring systems of hydraulic supports [5, 6]. However, the data currently collected is mostly used for predicting periodic weighting intervals and critical warnings of support load thresholds, with insufficient depth and breadth in data analysis [7, 8]. Moreover, as the number of measurement points in mines continues to increase, the volume of pressure data collected by the support online monitoring systems also grows, making data processing increasingly complex and posing challenges to scientific data analysis [9, 10]. At present, the application of massive mine pressure data in the field of roof disaster prediction and early warning is still in its developmental stage, and the use of deep learning technology in the prediction of mine pressure in coal mining faces is just beginning, without a mature technical system. Current research mainly focuses on establishing single prediction models and optimizing traditional algorithms for roof pressure prediction [11–13].
In recent years, the construction of smart mines has been fruitful, and the technology for intelligent coal mining has flourished. Mine pressure prediction and early warning, relying on advanced technologies such as big data and artificial intelligence, has become a research hotspot [14, 15]. Numerous scholars and research institutions at home and abroad have conducted extensive research on the prediction and early warning technology of roof disasters in fully mechanized mining faces, achieving certain results [16, 17]. However, the complexity of geological structures and the widespread distribution of faults are uncertain factors affecting the prediction of roof pressure. The speed of advance and the method of support during the mining process are also directly related to the accuracy of weighting prediction. Therefore, establishing an intelligent prediction model for roof pressure in coal mining faces that can adapt to complex geological and mining conditions faces significant challenges.
In this context, based on the massive mine pressure data from the fully mechanized mining face of Hongliulin Coal Mine and combining mathematical and computer technology, this paper proposes a dual-level prediction method for roof pressure based on mathematical statistics and deep learning algorithms, and develops a supporting software system to achieve automatic analysis of massive mine pressure data and accurate prediction of roof pressure in coal mining faces. This approach provides a feasible way to achieve mine pressure prediction and early warning under current conditions.
2. Dual-Level Prediction Method for Roof Pressure
2.1. General Approach
The core of the dual-level prediction method for roof pressure in fully mechanized mining combines statistical prediction and deep learning prediction, as illustrated in Figure 1.
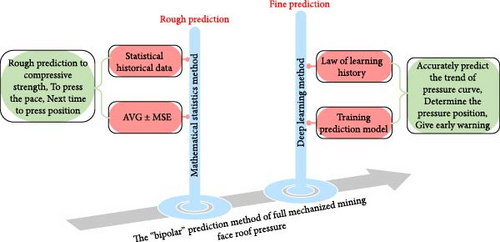
The statistical prediction method involves analyzing recent historical roof pressure data to determine the average and standard deviation of key metrics, including pressure intervals, timing, and intensity. This method allows for early predictions, typically one cycle in advance, but the accuracy is highly affected by geological conditions. For simpler geological conditions and more consistent pressure patterns, the predictions are fairly accurate. In contrast, for complex geological conditions and variable pressure patterns, the prediction range is generally broader. Therefore, statistical prediction can be used for early, rough forecasting of the next pressure event.
The deep learning prediction method involves analyzing historical roof pressure data to build and train a roof pressure prediction model using deep learning algorithms. This model can predict future pressure trends, determine the timing and location of the next roof pressure event, and trigger a warning if the prediction meets the set pressure alert criteria. This method offers accurate predictions but with limited lead time; the closer it is to the actual pressure event, the more accurate the prediction. Therefore, deep learning prediction is suitable for real-time, precise forecasting of upcoming pressure events. Combining these two methods provides complementary advantages: early lead time from statistical prediction and timeliness and accuracy from deep learning.
2.2. Statistical Prediction Method
2.2.1. Principles of the Method
The principle of the statistical prediction method is based on understanding the periodicity of roof pressure events. By collecting historical hydraulic support pressure data, statistical methods are applied to process and analyze this data, calculating the average and standard deviation of recent pressure locations, and timings as predictive indicators of the next event and its likely range of fluctuation.
2.2.2. Steps in the Method
Step 1: Calculate the sum of the mean and standard deviation of the cycle end resistance as the indicator for roof pressure determination. Based on this indicator, identify the historical pressure locations and timings for each support.
If the end resistance value (Pt) of a cycle exceeds this indicator (P’), then the timing and location of roof pressure in that cycle can be determined.
Step 3: Following the above method, calculate the historical pressure intervals for all supports over the past 10 days or 10 cycles.
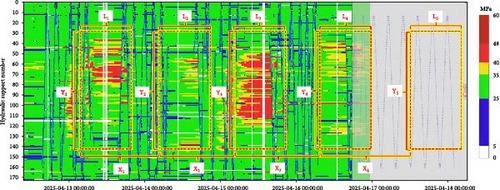
Step 4: The predicted range for the next pressure interval is determined by adding and subtracting the standard deviation of the average pressure interval. Adding this range to the most recent pressure location provides the predicted location for the next pressure event, as illustrated in Figure 2. In Figure 2, X1–X3 denote measured periodic weighting intervals, with X4 representing the corresponding predicted value; L1–L4 indicate the measured weighting influence ranges, while L5 signifies the predicted weighting range; Y1–Y4 characterize the measured support loading ranges under periodic weighting effects, and Y5 corresponds to the predicted support loading range.
2.3. Deep Learning Prediction Method
2.3.1. Principles of the Method
The deep learning prediction method involves training a deep learning model with extensive data. Once trained, the model can predict future data trends. Deep learning techniques excel in handling time series data and complex nonlinear problems [19]. In this paper, a Long Short-Term Memory (LSTM) model is used to analyze and predict the pressure data from hydraulic supports [20]. The LSTM model, a specialized form of recurrent neural network (RNN), effectively captures temporal dependencies and periodic patterns in pressure data, making it particularly suitable for long time series predictions. Unlike traditional RNNs [21], LSTM uses input, forget, and output gates to manage information flow, which helps mitigate gradient vanishing issues that can occur in long sequences.
2.3.2. Steps in the Method
After training the deep learning model on extensive roof pressure data, the model can automatically, continuously, and in real-time predict roof changes over a future period, with predictions showing important information such as future pressure values, as illustrated in Figure 3.
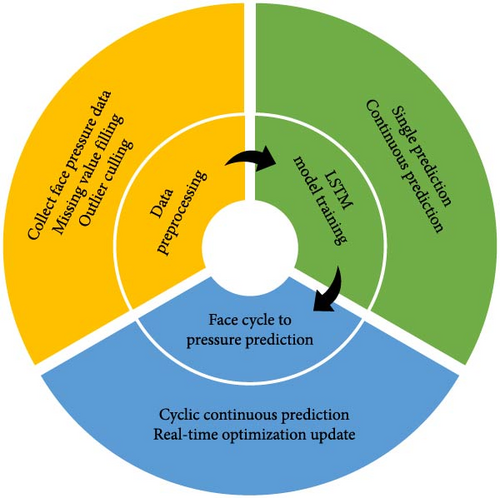
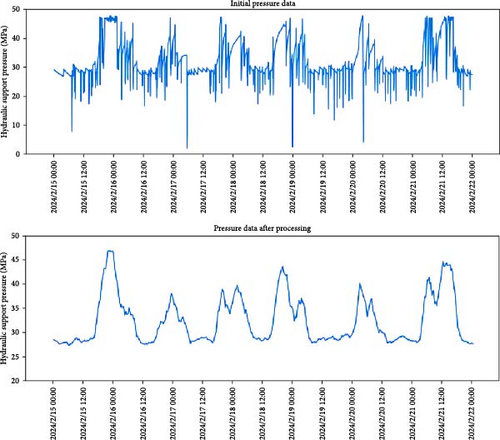
Step 1: Data preprocessing: Collect historical roof pressure (mining pressure) data from each support over the past 2 months. Preprocess the data to reduce noise and anomalies, enhancing data quality, and store it in an InfluxDB database for deep learning model training. Data preprocessing and smoothing results after noise reduction are shown in Figure 4.
Step 2: The deep learning model was trained based on historical ground pressure data from the working face, with model performance enhanced through hyperparameter optimization. The training process commenced with learning rate adjustment, where the learning rate was increased when observing slow convergence of training loss, while decreased in cases of loss oscillation. To accelerate the training process, the batch size was carefully controlled. Regarding the LSTM architecture, the optimization strategy initiated with a single-layer LSTM, followed by performance evaluation on the validation set. Subsequent layers were incrementally added based on empirical results, ultimately yielding a model capable of capturing periodic variations, trend patterns, and latent influencing factors.
Step 3: Periodic prediction of roof pressure: For each support on the coal mining face, use the past 48 h of pressure data as input to the LSTM model, which predicts the pressure trend for the next 6 h. The model’s predictions are updated every half hour in a continuous loop to ensure accuracy. The predicted results for each support are shown in Figure 5.
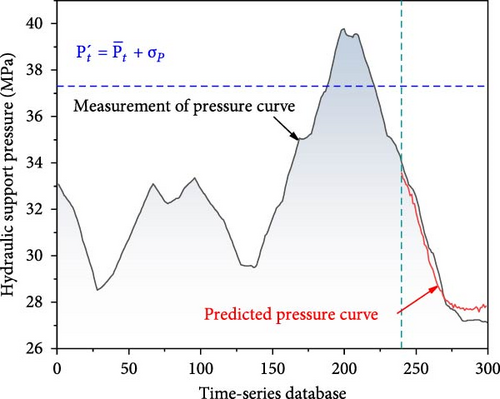
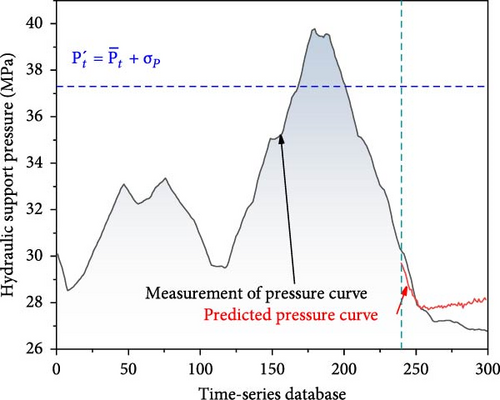
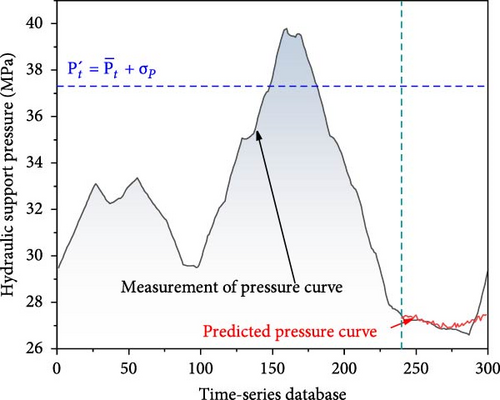
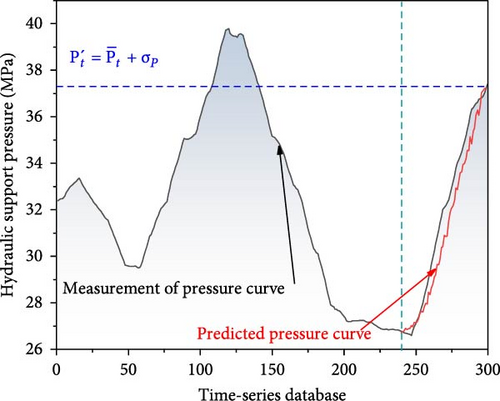
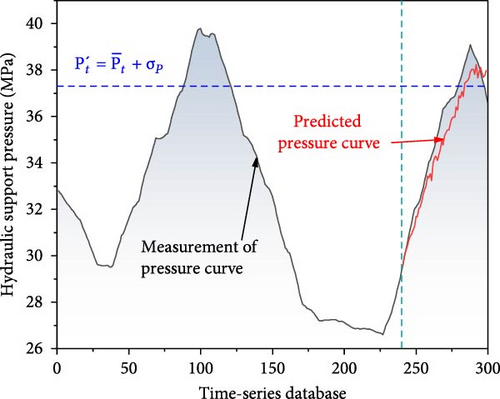
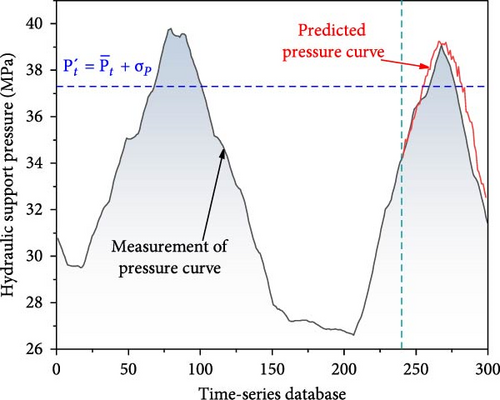
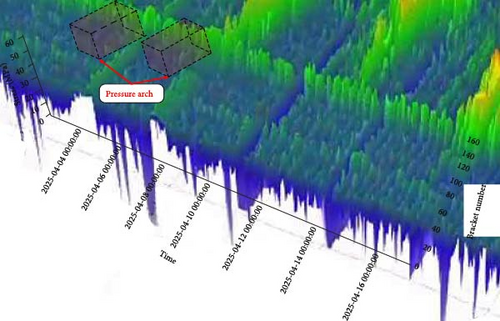
When pressure on supports in a certain region of the coal mining face increases, the overall pressure forms an arch-like distribution, indicating the presence of a “pressure arch.” Analyzing the pressure cloud chart for the face, as shown in Figure 6, can help determine if a “pressure arch” has formed as a pressure warning indicator. When the number of over-pressured supports in the arch region exceeds a threshold, a pressure warning is issued, and an alert is sent via software message, email, or other methods to inform relevant personnel of the impending pressure event, allowing timely response. It is important to highlight that this function requires effective filtering of false positives caused by anomalies in some supports to avoid unnecessary labor.
3. Software Platform Design and Implementation
The prediction methods described above require processing large volumes of roof pressure data and performing mathematical calculations. To apply these methods effectively in real coal mining operations, our team has developed a roof pressure prediction software platform based on statistical and deep learning algorithms, designed for dynamic monitoring of roof pressure on fully mechanized mining faces. This platform integrates data collection, predictive analysis, result visualization, and decision support functions, enabling mining managers to monitor pressure changes in real time and conduct proactive warnings.
3.1. Software Function Design
The software platform consists of five main functional modules: data collection and processing module, predictive analysis module, visualization module, alert and warning module, and decision support module.
3.1.1. Data Collection and Processing Module
The main function of this module is to continuously and uninterruptedly collect real-time pressure data from hydraulic support monitoring devices. The collected data undergo specialized processing, including noise reduction, error calibration, outlier removal, and missing value interpolation, to ensure data accuracy for subsequent analysis and decision-making.
3.1.2. Predictive Analysis Module
This module conducts in-depth analysis on the collected data using the statistical and deep learning methods described above. The process involves standardizing the collected data, using the rigor and consistency of statistical methods to identify patterns and relationships, and leveraging deep learning models’ fitting and predictive capabilities to study data correlations, forecast upcoming pressure intervals, and predict changes in support pressure trends.
3.1.3. Visualization Module
In this module, graphical methods are used to display pressure variation curves and prediction results for the coal mining face in a clear and intuitive way. Pressure data at various times is plotted into a single, continuous pressure variation curve, which can reflect the real-time pressure state of each support on the coal mining face. This enables decision-makers to gain a clearer understanding of the actual pressure status and maintenance measures required based on visual information.
3.1.4. Alert and Warning Module
This module responds promptly by issuing alerts when abnormal pressure is detected on the coal mining face through real-time monitoring, or when a pressure event is predicted by the algorithm. This ensures that management personnel receive the warning information immediately, allowing them to take effective countermeasures.
3.1.5. Decision Support Module
Based on real-world conditions and proactive prediction results, the system analyzes the causes of pressure events on the coal mining face and evaluates potential risks, providing mining managers with decision-making advice on safety measures.
3.2. System Architecture Design
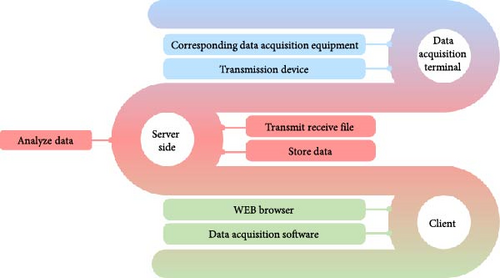
The software platform is designed with a distributed architecture, comprising data collection, server, and user components, as shown in Figure 7. The data collection component, installed on hydraulic supports underground, is responsible for real-time data collection and uploading to the server. The server component consolidates the data, stores it, performs analysis, runs predictive algorithms, and manages the database. The user component interacts with the server through a web interface to retrieve real-time monitoring information and prediction results for roof pressure.
3.3. Data Management and Processing
Due to the real-time nature and high frequency of support pressure data, the system must manage and store large volumes of data. We chose InfluxDB as the data storage solution, which is a high-performance time-series database suitable for storing and querying high-frequency sensor data [22].
The historical rock pressure data from each support in the working face over the past 2 months were collected and preprocessed. The local outlier factor (LOF) algorithm was applied to detect outliers, with clearly erroneous records removed and extreme outliers truncated. Additionally, linear interpolation was used to fill in missing values within a reasonable range, ensuring data continuity and integrity. Moreover, moving average filtering was employed to reduce noise interference and improve data quality. The processed data were then utilized for the training and optimization of the deep learning model.
3.4. Prediction Algorithm Implementation
The platform’s prediction algorithms include both statistical methods and a LSTM-based deep learning model. The statistical method analyzes historical data to predict future pressure intervals and values, while the LSTM model is trained on historical data to forecast support pressure over the next 6 h.
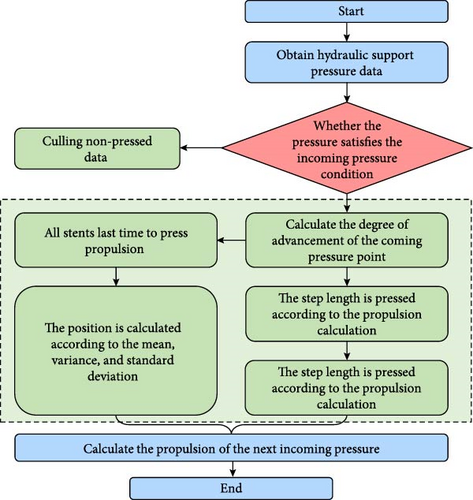
The statistical algorithm uses historical pressure and advancement data to predict the next pressure interval and advancement position, following the steps illustrated in Figure 8.
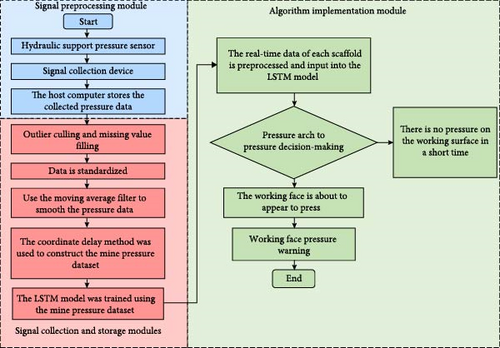
The deep learning algorithm learns and remembers long-term trend changes in historical roof pressure data, enabling it to predict future pressure values for each support. Each prediction uses the past 48 h of roof pressure data, covering at least one complete pressure cycle, allowing the machine learning algorithm to capture periodic variations in roof pressure data. The algorithm predicts each support’s pressure trend over the next 6 h. The specific process is illustrated in Figure 9.
For large-scale data from multiple mining faces or sensors, the software will focus on data preprocessing, utilize statistical models for preliminary analysis, and employ deep learning models to handle complex nonlinear relationships. The models will be updated in real-time to enhance the efficiency of large-scale data processing. Ultimately, the software aims to achieve efficient, real-time, and scalable data processing and predictive analysis.
3.5. User Interface Design
The platform’s user interface is designed with a simple and clear graphical layout, allowing users to observe the pressure trend of each support, upcoming pressure predictions, and alert notifications issued by the system in real time. The core principle of the user interface design is to enhance usability and intuitive information display, ensuring that on-site management personnel can quickly grasp pressure information. The system primarily consists of six main functions: stress analysis, stress inquiry, monitoring alarm, log management, organization management, and system monitoring. Figure 10 shows the user interface design.

4. Case Study
4.1. Prediction Results of the Statistical Method
Using the 15,219 coal mining face at Hongliulin Coal Mine as an example, roof pressure data from July 1 to July 31, 2024, was collected and analyzed. A total of 20 pressure events were recorded on this coal mining face, as detailed in Table 1. After removing abnormal data, the actual periodic pressure interval on the 15,219 coal mining face ranged from 12.3 to 24.25 m, with an average pressure interval of 17.15 m. Based on the statistical prediction method, the forecasted pressure interval ranged from 12.04 to 24.48 m, with an average predicted distance of 17.29 m. The interval range error was 0.26 m, and the average interval error was 0.14 m.
| Date | Predicted pressure time | Actual pressure time | Predicted location (m) | Actual location (m) | Error (m) |
|---|---|---|---|---|---|
| 2024/7/31 | 2024/7/30 9:33 | 2024/7/31 19:02 | 2564.61 | 2565.15 | 0.54 |
| 2024/7/30 | 2024/7/29 9:03 | 2024/7/30 11:00 | 2552.57 | 2552.85 | 0.28 |
| 2024/7/29 | 2024/7/28 14:14 | 2024/7/29 9:06 | 2539.34 | 2540.05 | 0.71 |
| 2024/7/27 | 2024/7/26 16:38 | 2024/7/27 23:06 | 2523.23 | 2524.2 | 0.97 |
| 2024/7/26 | 2024/7/25 7:33 | 2024/7/26 5:06 | 2506.96 | 2508.65 | 1.69 |
| 2024/7/25 | 2024/7/25 6:16 | 2024/7/25 10:11 | 2498.14 | 2499.05 | 0.91 |
| 2024/7/24 | 2024/7/23 12:33 | 2024/7/24 3:16 | 2482.62 | 2483.45 | 0.83 |
| 2024/7/22 | 2024/7/22 0:40 | 2024/7/22 22:06 | 2467.61 | 2468.05 | 0.44 |
| 2024/7/21 | 2024/7/21 9:13 | 2024/7/21 10:27 | 2449.52 | 2452.75 | 3.23 |
| 2024/7/19 | 2024/7/19 0:00 | 2024/7/19 22:06 | 2428.87 | 2429.55 | 0.68 |
| 2024/7/18 | 2024/7/17 6:30 | 2024/7/18 6:36 | 2411.32 | 2413.35 | 2.03 |
| 2024/7/16 | 2024/7/16 1:30 | 2024/7/16 6:21 | 2393.81 | 2395 | 1.19 |
| 2024/7/15 | 2024/7/13 19:00 | 2024/7/15 3:06 | 2381.45 | 2381.6 | 0.15 |
| 2024/7/13 | 2024/7/11 19:30 | 2024/7/13 2:11 | 2359.29 | 2359.55 | 0.26 |
| 2024/7/10 | 2024/7/10 18:14 | 2024/7/11 0:06 | 2335.3 | 2335.3 | 0 |
| 2024/7/8 | 2024/7/8 19:00 | 2024/7/8 19:55 | 2310.82 | 2313.35 | 2.53 |
| 2024/7/7 | 2024/7/6 21:00 | 2024/7/7 1:16 | 2292.39 | 2293.35 | 0.96 |
| 2024/7/5 | 2024/7/4 21:30 | 2024/7/5 19:34 | 2273.15 | 2276.6 | 3.45 |
| 2024/7/4 | 2024/7/2 21:30 | 2024/7/4 14:30 | 2261.25 | 2261.3 | 0.05 |
| 2024/7/1 | 2024/6/29 21:35 | 2024/7/1 7:12 | 2244.89 | 2245.65 | 0.67 |
Based on this data, we further classified and analyzed the prediction errors. Among the predictions, 10 cases had errors within the range of 0–0.8 m, accounting for 50% of the total predictions. Predictions with errors between 0.8 and 1.6 m occurred in five cases, accounting for 25% of the total. Predictions with errors greater than 1.6 m also accounted for 25%, with five cases. We consider an error less than 1.6 m, equivalent to the distance of two mining cycles, to be acceptable, reaching a satisfactory accuracy rate of 75%.
4.2. Statistical Analysis of Pressure Prediction Based on Deep Learning
Similarly, using the 15,219 coal mining face at Hongliulin Coal Mine, roof pressure data from July 1 to July 31, 2024, was analyzed. A total of 20 pressure events were recorded on this coal mining face, as detailed in Table 2. After removing abnormal data, the actual periodic pressure interval on this face ranged from 12.3 to 24.25 m, with an average distance of 17.15 m. The deep learning-based prediction gave an interval range from 12.5 to 24.05 m, with an average distance of 17.04 m. The interval range error was 0.2 m, and the average interval error was 0.11 m.
| Date | Predicted pressure time | Actual pressure time | Predicted location (m) | Actual location (m) | Error (m) |
|---|---|---|---|---|---|
| 2024/7/31 | 2024/7/31 18:44 | 2024/7/31 20:30 | 2564.55 | 2565.15 | 0.6 |
| 2024/7/30 | 2024/7/30 8:30 | 2024/7/30 13:00 | 2552.05 | 2552.85 | 0.8 |
| 2024/7/29 | 2024/7/29 8:02 | 2024/7/29 10:06 | 2538.45 | 2540.05 | 1.6 |
| 2024/7/27 | 2024/7/27 13:30 | 2024/7/27 23:06 | 2522.6 | 2524.2 | 1.6 |
| 2024/7/26 | 2024/7/26 2:17 | 2024/7/26 5:51 | 2507.5 | 2508.65 | 1.15 |
| 2024/7/25 | 2024/7/25 3:34 | 2024/7/25 10:18 | 2496.65 | 2499.05 | 2.4 |
| 2024/7/24 | 2024/7/23 22:34 | 2024/7/24 3:40 | 2483.45 | 2483.45 | 0 |
| 2024/7/22 | 2024/7/22 18:25 | 2024/7/22 22:04 | 2466.65 | 2468.05 | 1.4 |
| 2024/7/21 | 2024/7/21 9:09 | 2024/7/21 10:30 | 2452 | 2452.75 | 0.75 |
| 2024/7/19 | 2024/7/19 20:11 | 2024/7/19 22:31 | 2427.95 | 2429.55 | 1.4 |
| 2024/7/18 | 2024/7/18 5:37 | 2024/7/18 6:51 | 2412.55 | 2413.35 | 0.8 |
| 2024/7/16 | 2024/7/16 4:01 | 2024/7/16 6:15 | 2393.45 | 2395 | 1.55 |
| 2024/7/15 | 2024/7/15 2:13 | 2024/7/15 3:13 | 2380.98 | 2381.6 | 0.62 |
| 2024/7/13 | 2024/7/13 2:11 | 2024/7/13 3:22 | 2358.75 | 2359.55 | 0.8 |
| 2024/7/10 | 2024/7/10 21:11 | 2024/7/11 0:09 | 2335.25 | 2335.3 | 0.05 |
| 2024/7/8 | 2024/7/8 18:32 | 2024/7/8 19:46 | 2312.55 | 2313.35 | 0.8 |
| 2024/7/7 | 2024/7/7 0:09 | 2024/7/7 1:28 | 2292.25 | 2293.35 | 1.1 |
| 2024/7/5 | 2024/7/5 17:33 | 2024/7/5 19:42 | 2275 | 2276.6 | 1.6 |
| 2024/7/4 | 2024/7/4 8:33 | 2024/7/4 18:20 | 2258.9 | 2261.3 | 2.4 |
| 2024/7/1 | 2024/7/1 7:11 | 2024/7/1 9:10 | 2244.85 | 2245.65 | 0.8 |
From further classification of this data, we observed 10 cases with prediction errors in the range of 0–0.8 m, making up 50% of the total predictions. Predictions with errors between 0.8 and 1.6 m occurred in eight cases, making up 40%. Predictions with errors greater than 1.6 m accounted for 10%, with two cases. Predictions with errors less than 1.6 m made up 90% of the cases.
According to the statistical results, the model achieves a prediction accuracy of 85.71%, a recall rate of 90%, and an F1 score of 87.95%. The high F1 score indicates excellent model performance, demonstrating its effectiveness and suitability for rock pressure prediction in this specific scenario.
5. Discussion
The accuracy of traditional mathematical statistical prediction methods is significantly influenced by geological conditions, making it challenging to effectively predict working faces with complex geological conditions and significant variations in pressure patterns. These methods are generally only suitable for early-stage rough predictions. Although standalone machine learning algorithms have improved prediction accuracy to some extent, their time advance is limited, often requiring proximity to the pressure occurrence time for effective prediction, which may result in untimely warnings.
Therefore, a dual-level prediction method for roof pressure is proposed, which combines the aforementioned two approaches to achieve complementary advantages. This method ensures that the pressure prediction results have a certain time advance while maintaining timeliness and accuracy.
Comparing the deep learning-based predictions with the statistical method, we find that the deep learning model is more accurate, correctly predicting pressure events in most cases. Unlike the statistical model, the deep learning model forecasts pressure based on time series trends, making it less influenced by geological factors. However, its limitation is that it only predicts shortly before an event, typically 1–2 h in advance.
In contrast, the statistical model bases predictions on historical pressure data over multiple cycles. Its strength lies in its longer prediction range, as it can often predict the next event more than 6 h in advance. However, its accuracy is more affected by factors such as geological conditions, mining methods, and operational plans.
Our analysis indicates that pressure intensity significantly affects both models. Specifically, the deep learning model relies on dynamic trends in the pressure time series to identify impending events, which can become indistinct with weaker pressure intensity, challenging the model’s ability to capture and analyze subtle signals, thus impacting accuracy.
On the other hand, the statistical prediction model depends on historical event records and periodic patterns to forecast future events. However, in cases of low-intensity pressure, pressure events may be difficult to define accurately, introducing uncertainty that propagates into predictions and reduces the reliability of the historical cycle-based approach.
Comprehensive analysis of the pressure data from both approaches shows that the deep learning prediction model is highly accurate, predicting pressure events in most cases. However, the diversity of geological conditions introduces uncertainty, requiring a high level of flexibility and adaptability in the model. Mining method differences also influence the timing, intensity, and frequency of pressure events, placing higher demands on the model’s accuracy. To improve prediction accuracy, it is necessary to integrate additional metrics from the working face, ensuring the model performs well under specific conditions.
Although, the deep learning model demonstrates significant value in pressure prediction, it still has a relatively high error rate under exceptional conditions. Continuous optimization of model structure and algorithms is needed to enhance robustness and accuracy.
6. Conclusion
- 1.
This study developed a dual-level roof pressure prediction methodology integrating statistical analysis and deep learning algorithms, validated through a case study at Hongliulin Coal Mine. The accompanying software platform demonstrated effective real-world performance, enabling accurate roof pressure forecasting and providing data-driven decision support for mining safety.
- 2.
Field implementation of 15,219 working face achieved 75% prediction accuracy (< 1.6 m error) using statistical methods (6-h lead time) and 90% accuracy (< 1.6 m error) via deep learning (1–2 h lead time). The hybrid approach optimally balances early warning capability and spatial precision, significantly enhancing roof pressure risk assessment.
- 3.
Current limitations include restricted generalization across diverse geological/mining conditions and performance gaps under special scenarios. Future work should, expand training datasets with multi-mine geological and operational parameters to enhance cross-domain adaptability. Incorporate mining method-specific optimization (e.g., longwall versus room-and-pillar) into the prediction algorithm. Develop adaptive learning mechanisms to improve model robustness under dynamic mining conditions. These refinements will advance the system’s predictive intelligence, supporting safer and more efficient coal mining operations.
Conflicts of Interest
The authors declare no conflicts of interest.
Funding
This work is supported by the Natural Science Foundation of Beijing Municipality (Grant 8232056) which is gratefully acknowledged.
Open Research
Data Availability Statement
The data that support the findings of this study are available from the corresponding author upon reasonable request.


