Worst-Case Accident Analysis of Accident Tolerant Fuel in NuScale Using RELAP5/MOD3-Based Code
Abstract
Research in nuclear engineering focusses on improving the safety of light water reactors (LWRs), driven by accidents like Fukushima in 2011. The severity of this accident was a result of active cooling system failures and cladding material oxidation resulting in hydrogen explosions. To this end, efforts concentrate on the improvement of passive safety in LWRs and the development of accident tolerant fuel (ATF). Natural circulation small modular reactors (SMRs) are new reactor concepts designed around passive safety. One such SMR called the NuScale SMR was chosen for this study. This study aimed to evaluate the combination of one selected passively safe reactor system with two selected ATF cladding materials, namely FeCrAl alloy and a silicon-carbide (SiC) composite, to determine if this combination would greatly increase the safety of LWRs. The use of ATF cladding materials in the NuScale for possible mitigation of a potential worst-case scenario accident has not been evaluated. A model of the SMR was developed using ASYST 3.4 thermal–hydraulics code and validated for steady state operation and one worst-case scenario accident transient using data taken from the NuScale final safety analysis report (FSAR) and literature. Results indicated minimal impact on steady state operation when employing ATF cladding materials. FeCrAl and SiC caused minor changes in peak cladding temperature (PCT) and peak fuel centerline temperature (PFCT). The worst-case scenario accident transient involved the inadvertent opening of one reactor vent valve (RVV) with subsequent failure of the emergency core cooling system (ECCS) and decay heat removal system (DHRS). In the current model, this led to failure of the Zr-alloy cladding after 6.42 h. This coping time was increased with the use of ATF cladding, with FeCrAl and SiC providing an increase of 0.5 and 4.35 h, respectively.
1. Background
In recent years, a large focus of research in the field of nuclear engineering has been on the safety of nuclear power plants (NPPs). This focus has been driven by the high-profile nuclear accidents such as the accident at Chernobyl and more recently the accident at Fukushima, Japan.
The combination of the earthquake and tsunami eliminated both external power sources and emergency backup generators, which powers the residual heat removal systems (RHRSs). The safety systems at the Fukushima NPP failed within the first 3 days of the accident. After failure of the cooling systems, an increase in temperature within the reactor core occurred. This exposed the nuclear fuel rods to high-temperature steam, resulting in the oxidation of the Zr-alloy cladding and production of hydrogen. Further temperature increases due to decay heat resulted in the melting of the fuel. This led to hydrogen explosions which damaged the containment buildings. Further progression of the accident led to complete meltdown of the core of Unit 1 and partial meltdown of the cores of Units 2 and 3 [1].
Of all nuclear reactors in operation as of 2018, 82% are of the light water reactor (LWR) type. Of this 82%, 66% are pressurized water reactors (PWRs), and 16% are boiling water reactors (BWRs) [2]. Thus, most nuclear reactors around the world are similar in function to the reactors of the Fukushima NPP. All these reactors have a risk of failure, and efforts should be directed to improving the safety of LWRs.
To prevent accidents such as the one in Fukushima, researchers have been focusing on two specific topics. The first topic focusses on the improvement of passive safety systems and completely new reactor designs which provide passive cooling in the case of station blackout (SBO) and loss of emergency generators. Some reactor concepts rely on natural circulation for steady state operation of the reactor, making them inherently safer. The second topic focusses on the development of accident tolerant fuel (ATF). Some of the goals of using ATFs are to increase oxidation resistance, improve heat transfer from the fuel element to the coolant, and improve the structural integrity and melting point of the fuel elements.
The aim of this study is to identify a passive cooling system or a new reactor concept which enhances the passive safety in LWRs. Then, identify candidate ATF cladding materials with increased oxidation resistance and melting points. Thermal–hydraulic evaluation of the selected system with the selected ATF cladding materials is to be performed, to evaluate if this combination would increase the safety of LWRs.
2. Introduction
Zr-alloy is the most common fuel cladding material, and it is used because of its high melting point of ~2100 K and low neutron absorption properties. Zr-alloy also has high oxidation resistance at lower temperatures. However, when exposed to high-temperature steam, the oxidation resistance of the material dramatically decreases. Zr-alloy starts to oxidate in a high-temperature steam environment at 1173 K and has a failure point of 1477 K due to oxidation [3].
Chromium coating of Zr-alloy is a promising candidate for ATF cladding as it improves the oxidation resistance of Zr-alloy without changing the neutron absorption cross-section. Umretiya et al. [4] found that adhesion of the chromium to the Zr-alloy was successful and this improves wettability of the cladding which could lead to improved thermal–hydraulic performance. Lee et al. [5] showed that the method of manufacturing affects the surface characteristics of the cladding, resulting in an increase in void fraction, heat transfer coefficient (HTC), and critical heat flux (CHF), which leads to better heat transfer.
FeCrAl alloy cladding and silicon-carbide (SiC) cladding are among the most common in ATF research [6–9]. FeCrAl alloy is promising because of its high oxidation resistance at high temperatures and good thermal–hydraulic characteristics resulting in lower peak fuel centerline temperature (PFCT) and peak cladding temperature (PCT) [10]. However, the material has a large neutron absorption cross-section, low irradiation resistance and brittleness due to high chromium content making manufacturing difficult [11]. SiC fuel claddings are considered for their small neutron absorption cross-section, high melting temperature, and high oxidation resistance [11]. However, SiC is also brittle (making manufacturing difficult) and has a poor HTC which further degrades under irradiation, resulting in higher PFCT and PCT [10].
A major issue in finding ATF cladding replacement materials is the large neutron absorption cross sections found in many materials which would be otherwise suited for this purpose. Mustafa [12] investigated the safety features of the candidate ATF cladding materials SiC, FeCrAl, and SS-310. It was shown that the larger microscopic thermal neutron absorption cross-section of FeCrAl and SS-310 resulted in a decrease of the fuel cycle length by 21.3% and 26.5%, respectively, while the smaller absorption cross-section of SiC resulted in an increase in the fuel cycle length by 2.23% when compared to Zr-alloy [12].
Katoh et al. [13] evaluated the effects of irradiation on SiC/SiC composites. SiC/SiC composites are of interest due to higher irradiation resistance in comparison to other SiC composites. However, results showed a decrease in thermal conductivity in SiC/SiC composites after irradiation [13].
Yu, Chen, and Cai [3] evaluated ATF in a CPR1000 system during various accident transients. Results show that there was an insignificant change in temperature by using ATF in most cases. However, during a small break loss of coolant accident (SBLOCA) without safe injection (SI), Zr-alloy cladding would reach its failure temperature of 1477 K after 3690 s. FeCrAl cladding extended this time by 310 s or 8.4%, with a failure temperature of 1773 K, while SiC did not reach its failure temperature [3].
Gurgen and Shirvan [14] compared FeCrAl alloy cladding and Cr-coated Zr-alloy cladding with bare Zr-alloy cladding in terms of oxidation, hydrogen production, and coping time in beyond design basis accidents (BDBAs). Both ATF cladding materials showed an increase in oxidation resistance. Cr-coated Zr-alloy increased the coping time by 2.1%–40.7% in the various transients compared to bare Zr-alloy, while FeCrAl had a more significant increase of 10.3%–62.1% [14].
The two ATF cladding materials selected for this study were FeCrAl alloy and a SiC composite. These materials are among the most prominent ATF cladding materials in nuclear research. Both materials offer a large increase in oxidation resistance compared to Zr-alloy. FeCrAl has favorable thermophysical properties compared to Zr-alloy. However, FeCrAl has a large neutron absorption cross-section which negatively impacts the neutron economy of the reactor. On the other hand, SiC has a small neutron absorption cross-section and a high melting point, while having less favorable thermophysical properties.
Many safety systems have been developed to improve the safety of nuclear reactors. The goal is to remove decay heat from the reactor core in the case of a reactor shut down due to a loss of coolant accident (LOCA). In many cases, these systems are the last safety measures used to prevent core damage or meltdown. Examples of passive systems used in conventional PWR reactors are RHRSs, condensation heat exchangers, safety injection systems, accumulators, and suppression pools [15–17]. However, in recent years, a new generation of reactors have been developed that are less dependent on the abovementioned safety systems. These are new reactor concepts that are compact, modular, and designed around passive cooling systems [18–20].
Various studies evaluated the safety features of the multiapplication small light water reactor (MASLWR), a 35 MW natural circulation small modular reactor (SMR) [21, 22]. Reyes et al. [23] tested one design basis accident (DBA) and one BDBA using the MASLWR test facility at Oregon State University. Both accident scenarios involved the inadvertent opening of automatic depressurization system (ADS) valves, and it was found that actuation of the remaining valves enabled natural circulation through the containment vessel (CNV), keeping the core covered for the length of the transients [23]. Butt et al. [18] illustrated that a worst-case scenario accident transient in the MASLWR, which is the inadvertent opening of the ADS blowdown valve with subsequent failure of the ADS vent valve, resulted in the core becoming uncovered leading to a large increase in fuel temperature.
CAREM-25 is a flashing-driven natural circulation SMR, similar to the MASLWR. Marcel et al. [24] showed that flow instabilities occurred in the reactor in the lower section of the chimney during low pressure start-up transients which could be improved by increasing the system pressure. Mass flow driven by buoyancy forces and phenomena such as condensation on the steam dome and reactor structures make the reactor dynamics of the CAREM-25 and other natural circulation SMRs much different than traditional PWRs [25].
The IP100 concept is another flashing-driven natural circulation SMR like the CAREM-25. Zhao et al. [26] illustrated that the IP100 also experienced flow instabilities during low-load transients such as startup. Zhao, Peng, and Xia [27] also performed safety evaluation of the IP100 and found that the IP100 has excellent safety during a partial loss of feedwater (LOFW) accident, and during a full LOFW accident, the passive RHRS can provide adequate cooling for 9 h.
NuScale is a 50 MW natural circulation SMR like the MASLWR. This reactor has two additional safety systems compared to other SMRs, namely the emergency core cooling system (ECCS) and decay heat removal system (DHRS). Fakhraei et al. [28] evaluated the safety of NuScale during SBO scenarios, both with and without failure of the ECCS. In both cases, the reactor provided adequate decay heat removal for 3 days [28]. However, flow oscillations were observed during certain stages of the accident transient [19]. Skolik et al. [20] performed an analysis of the NuScale using RELAP5/SCDAPSIM code. A worst-case scenario accident transient was evaluated which is the inadvertent opening of a reactor vent valve (RVV) with subsequent failure of the ECCS and DHRS. This led to a reduction in the coolant level within the reactor pressure vessel (RPV) without recirculation, resulting in the core becoming uncovered and core damage occurring after 4.8 h [20].
ATFs have been applied to more traditional large LWRs to improve the safety of these reactors as illustrated in Yu, Chen, and Cai’s [3] study. Similarly, AlRaisi [29] conducted a performance evaluation of ATF in an APR1400 reactor during a short-term SBO accident transient. Jeong et al. [30] conducted a performance analysis of an OPR-1000 reactor loaded with ATF for steady state operation and a rod ejection accident. Guo et al. [31] found that ATF provided a significant increase in coping time in a generic BWR during a short-term SBO accident.
However, studies on the application of ATF in SMRs are less common. Pourrostam, Talebi, and Safarzadeh [32] performed core analysis of ATF in the SMART SMR during normal operation and a rod ejection accident. Yu et al. [33] researched the thermal–hydraulics and fuel performance of ATFs (thorium–uranium oxide and SiC) in the NuScale during extreme steam generator (SG) tube failure where results showed an increase in coping time. Furthermore, Yu et al. [34] showed that ATFs can increase safety margins of the NuScale during a rod ejection accident.
The NuScale was selected as the system to be evaluated for this study since it was the furthest along in its development among other light water SMRs, and specifications of the reactor were readily available. Research on the application of FeCrAl alloy and SiC composite ATF claddings in the NuScale is limited. Evaluation of the steady state operation of the NuScale as well as the worst-case scenario accident transient as presented by Skolik et al. [20] will be performed. The use of ATF claddings for the possible mitigation of this worst-case scenario accident is unknown. For the current study, only the cladding material will be changed to ATF materials, thus only changing the thermophysical and surface properties of the cladding. All other aspects of the model will remain the same as given by the NuScale final safety analysis report (FSAR), including the fuel (UO2), fuel rod dimensions, fuel rod pitch, fuel assembly dimensions and layout, core power, and power distribution.
3. Model
3.1. Thermal–Hydraulic Code
For this study, a single NuScale power module (NPM) is modeled using ASYST 3.4.0 (Build 03/2019) system analysis code, which is a modified RELAP5/MOD3 code [35]. Input files for ASYST 3.4 and RELAP5/MOD3 are interchangeable and RELAP5/MOD3 code manuals are used as guideline for the model development. RELAP5 is a transient, two-phase, nonequilibrium, and nonhomogeneous code that solves for mass continuity, momentum, and energy field equations for two phases. The code is used for evaluation of nuclear reactor designs and to predict the behavior of nuclear reactors during accident scenarios [19]. RELAP5 is designed to evaluate the interaction of system components rather than detailed analysis of fluid flow within components. Thus, system components are modeled as control volumes, which are essentially pipes, and connected with junctions at the inlet and outlet. The average fluid properties are calculated at the center of each control volume with fluid vector properties being calculated at junctions [36].
The model boundary in the current study surrounds a single NPM. This includes a full primary loop and CNV and a partial ultimate heat sink (UHS) pool. Only the portion of the secondary system that interacts with the primary system is required for the model. With the model boundary established, the model can be nodalised. The layout of the model developed for the NuScale can be seen in Figure 1.
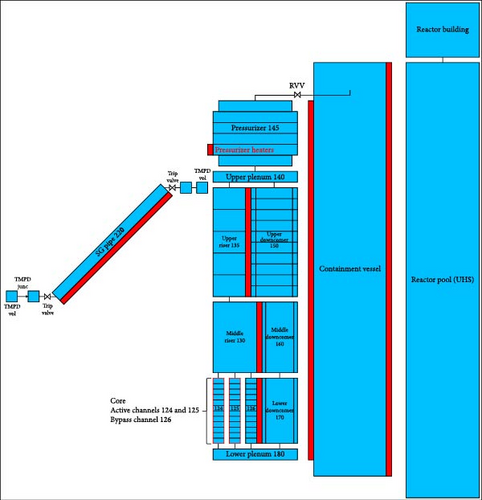
The slice nodalisation method was followed throughout the modeling process. This method involves modeling of volumes at the same elevation with the same volume length, which allows the thermal–hydraulic code to better predict natural circulation phenomena [20, 37].
3.2. NuScale Model
Specifications of the NuScale are taken from the NuScale FSAR made available by the US Nuclear Regulatory Commission (NRC), with data being further supplemented by various articles in academic literature. Steady state operation of the NuScale will be evaluated along with a worst-case scenario accident transient which is the inadvertent opening of a RVV with subsequent failure of the ECCS and DHRS. This transient is chosen as it is one of few transients which lead to failure of the cladding material and results in meltdown of the core.
3.2.1. Core
The NuScale core is made up of a total of 37 fuel assemblies. Each fuel assembly is ~2.4 m in length and has a pitch of 215 mm [38]. The assemblies are placed in a grid within the core of the reactor and are surrounded by the core barrel. Reflector blocks are located between the fuel assemblies and core barrel. Flow through the guide and instrumentation tubes and flow through the coolant channels of the reflector blocks make up the bypass flow.
Core sections of nuclear reactors are typically modeled by lumping fuel assemblies together into a series of fuel channels. El-Sahlamy et al. [39] modeled a Westinghouse reactor with a hot channel representing the single hottest fuel assembly and an average channel consisting of the remaining 192 fuel assemblies. RELAP5 pipe components were used for the fuel channels with heat structures representing fuel elements [39]. Skolik et al. [20] modeled the NuScale core with the hot channel being the central fuel assembly, three average channels having 8, 12, and 16 fuel assemblies, and one bypass channel. Fakhraei et al. [28] modeled the NuScale with a hot channel with the single hottest fuel assembly and an average channel with the remaining 36 fuel assemblies. Three bypass channels were used in the model of Fakhraei et al. [28], one for each of the two active channels representing the bypass flow through guide and instrumentation tubes, and a third representing the flow through the reflector coolant channels.
For the current study, the core was divided into two active fuel channels and a third channel which represents the core bypass flow. The two active fuel channels are the hot channel (124) consisting of the hot central fuel assembly, and the average channel (125) consisting of the remaining 36 fuel assemblies. The calculated core channel dimensions for this model can be seen in Table 1. The flow through the bypass channel (126) is the combined flow through the guide tubes and flow through the reflector cooling channels. The reflector cooling channels contribute to 4.5% of the bypass flow while the bypass flow through the guide and instrumentation tubes is 4.0% for a total bypass flow of 8.5% [40]. Each fuel channel is divided into 12 axial sections with a length of 0.2 m each. The central 10 axial nodes are connected to the active fuel, while one axial node on each end represents the tips of the fuel pins. The modeled fuel channels can be seen in Figure 1.
| Fuel channel dimensions | |||
|---|---|---|---|
| Hot channel 124 | Average channel 125 | Bypass channel 126 | |
| Number of fuel assemblies | 1 | 36 | — |
| Number of fuel rods | 264 | 9504 | — |
| Flow area (m2) | 0.0246 | 0.8851 | 0.0845 |
| Hydraulic diameter (m2) | 0.011 | 0.011 | 0.22 |
| Length (m) | 2.4 | 2.4 | 2.4 |
| Increments | 12 | 12 | 12 |
| Increment length (m) | 0.2 | 0.2 | 0.2 |
| Estimated mass flow (kg/s) | 14.5 | 522.7 | 49.9 |
| Active fuel length (m) | 2.0 | 2.0 | — |
| Number axial heat structure increments | 10 | 10 | — |
| SA factor | 52.8 | 1900.8 | — |
| Power factor | 1.091 | 0.997 | — |
| Power fraction | 0.02949 | 0.97043 | — |
| UO2 outer radius (m) | 0.00406 | 0.00406 | — |
| Gap outer radius (m) | 0.00414 | 0.00414 | — |
| Cladding outer radius (m) | 0.00475 | 0.00475 | — |
- Abbreviation: SA, surface area.
Heat structures are widely used to represent fuel elements in nuclear reactor core models [28, 39]. The power produced in the heat structure for each fuel channel is dependent on the radial and axial power distribution within the core. Determining the power distribution requires neutronic analysis. Erfaninia et al. [41] used MCNPX and CFX codes to perform neutronic–thermal–hydraulic coupling to analyze fuel channels and power distribution of the CAREM-25 SMR core. Fakhraei et al. [28] determined the power peaking factors and other neutronic parameters in the NuScale core using MCNP5. A predetermined power distribution is also commonly used in safety analysis of nuclear reactors. El-Sahlamy et al. [39] used a predetermined radial power distribution with a cosine-shaped axial power distribution, while using RELAP5 point kinetics to determine the power generation throughout the transient. Skolik et al. [20] similarly used the predetermined radial and axial power distribution of the NuScale core given by the FSAR.
In the current study, fuel elements are modeled in ASYST 3.4 using the heat structure components. The fuel element is modeled starting at the fuel centerline and moving outward. Fuel elements are divided into 10 radial nodes and 10 axial nodes. The left boundary of the heat structure represents the fuel centerline, and a symmetry or insulated boundary condition is used. The right boundary of the heat structure representing the outer surface of the cladding will be connected to the coolant channel and therefore the convective heat transfer boundary condition will be used. The surface area (SA) factor is used to compensate for the differing number of fuel pins in each fuel channel. The heat structure dimensions can be seen in Table 1.
The radial power distribution of the NuScale core at the beginning of cycle (BOC) is used in the current study as given by the FSAR [38]. The power factor of the hot channel is set to be 1.091 to coincide with the central hot channel in the study done by Skolik et al. [20]. The average channel has a power factor equal to the average of the power factors of the remaining 36 fuel assemblies. The power factor and power fraction of the hot and average channels are included in Table 1. The power produced by the core is further spread across the core in the axial direction as shown in the FSAR [38].
Besides the heat structures representing the fuel elements in the core, there also exists heat structures connecting the hot and average channels to the bypass channel. These heat structures represent the guide tube and instrumentation tube walls and allow for heat transfer from the two active channels to the bypass channel. A final heat structure exists in the core section representing the core barrel and allowing for heat transfer to the annular section of the downcomer.
3.2.2. Primary Loop
The primary loop of the NuScale is comprised of various components, all located in the RPV which includes the core, riser, upper and lower plenum, downcomer, and the pressurizer, as shown in Figure 1.
Table 2 shows a list of all components forming the primary loop with the corresponding component numbers as well as the number of volumes in each component, the length of each of the volume, and the volume flow area. The volume lengths are taken from the model by Skolik et al. [20], as this gives a more detailed description of the lengths of each section. The flow area of each volume is taken from the FSAR, either directly or calculated from given dimensions [38].
| Components | Number of volumes | Volume length (m) | Flow area (m2) |
|---|---|---|---|
| Pressurizer 145 | 1 | 0.67 | 3.828 |
| 4 | 0.525 | 5.704 | |
| 1 | 0.53 | 3.354 | |
| RPV upper plenum 140 | 1 | 0.382 | 5.704 |
| Upper riser 135 | 5 | 1.528 | 1.43 |
| Upper downcomer 150 | 10 | 0.764 | 2.9798 |
| Middle riser 130 | 1 | 2.87 | 2.313 |
| Middle downcomer 160 | 1 | 2.87 | 1.826 |
| Lower downcomer 170 | 1 | 2.4 | 1.826 |
| RPV lower plenum 180 | 1 | 0.5 | 4.719 |
- Abbreviation: RPV, reactor pressure vessel.
The pressurizer is a pipe component (145) located at the top of the RPV. The flow area is calculated from the RPV inner diameter (ID). The bottom most section of the pressurizer has a reduced flow area compared to the rest of the pressurizer due to the secondary side steam headers present in this location. The pressurizer of NuScale includes two systems for controlling pressure in the RPV, namely two heating element bundles to increase pressure and spray nozzles for decreasing pressure. The heating element bundle is represented by a heat structure connected to the second lowest volume of the pressurizer. The spray nozzles are not included in the current model as this would greatly increase the complexity of the model. The initial coolant level in the pressurizer is set to 50%.
The RPV upper plenum is modeled using a branch component (140). The upper plenum connects the riser and downcomer such that the coolant flow will be turned from the upward direction in the riser to a downward direction in the downcomer. The top of the upper plenum is connected to the pressurizer which controls the pressure in the RPV.
The upper downcomer is modeled with an annulus component (150) with a total of 10 volumes. The annulus component in ASYST 3.4 is the same as a pipe component with the exception that an annular flow regime map is used. The upper downcomer makes up the primary side of the SG. The upper downcomer flow area is determined by taking the annulus flow area and subtracting the cross-sectional area of the SG tubes. The assumption is made that all 1380 tubes of the SG intersect the cross-section of the upper downcomer.
The upper riser is a pipe component (135) with the same overall length as the upper downcomer. However, the number of volumes (nodes) was reduced to five. The node size is governed by factors such as numerical stability, run time, and spatial convergence. Numerical stability requires that the volume L/D >1. Nodes should in general be made as large as possible as this directly impacts the run time. The material Courant limit prevents the time step from exceeding the node length divided by the maximum fluid velocity. Finer nodalisation may be implemented in sections of the model where the user is interested in fluid behavior [36].
The middle riser is a pipe component (130) with one volume located directly above the core. The section of pipe extends up from the core barrel and has a small cone section at the top for transition to the upper riser. For this model, the entire middle riser section was lumped together into one large volume with an equivalent average flow area which is directly taken from the FSAR [38].
The middle and lower downcomer are both annulus components (170 and 180). The middle downcomer has the same length as the middle riser, while the lower downcomer has the same length as the core section. The lower plenum is a single volume at the bottom of the RPV and turns the direction of flow from the downward direction in the downcomer to the upward direction into the core.
3.2.3. SG Secondary Side
ASYST 3.4 does not have the capability to model a helical coil SG as found in many natural circulation SMRs. Thus, several simplifications were necessary. Mascari et al. [37] modeled the MASLWR test facility using TRACE [42], and three approaches were taken in modeling the SG. The three parallel sets of SG coils were modeled as three oblique sets of pipes, three vertical pipes, and a single vertical pipe, all having equivalent flow and heat transfer areas. All three approaches yielded similar results, with the single vertical pipe providing the best prediction of the SG outlet temperature. Hoffer et al. [43] modeled the helical coil shell and tube SG of a high-temperature gas-cooled reactor using RELAP5-3D [44]. The SG was successfully modeled as a straight pipe with equivalent flow area and hydraulic diameter, and the pipe was placed at an incline to replicate the vertical displacement of the helically wound tubes. However, a heat transfer multiplier was added and changes were made to the heated length and mass flow rate to achieve design parameters [43]. This is due to the increased heat transfer of helical coil heat exchangers compared to straight pipe heat exchangers as illustrated by Prabhanjan, Raghavan, and Rennie [45]. Skolik et al. [20] and Fakhraei et al. [19] followed a similar approach in modeling of the NuScale helical coil SG.
The NuScale SG is made up of two helical coil tube bundles with a total of 1380 tubes and average tube length of 24.2 m. The tube bundles are modeled as a single straight pipe with a length of 24.2 m. The flow area of the pipe is the combined flow area of the 1380 tubes measuring 0.232 m2, while the hydraulic diameter of the pipe is the ID of a single tube which is 14.63 mm. The pipe is divided into 10 axial nodes. The pipe is also placed at an incline to replicate the vertical displacement of the tube bundles.
A heat structure connects the SG pipe to the upper downcomer, with dimensions calculated from the design parameters given by the FSAR [46]. As with the fuel pins in the core, the SA factor is multiplied by the number of SG tubes to achieve the same heat transfer area. However, while using this SA factor, the SG did not provide adequate heat transfer leading to a low SG outlet temperature and an energy imbalance in the RPV. The SA factor had to be increased by 83.4% to achieve the design SG outlet temperatures and energy balance in the primary loop.
Feedwater to the SG pipe is provided by a time-dependent volume where the water temperature and pressure are specified as given by the FSAR [46], while a time-dependent junction controls the flow rate through the SG pipe. Two trip valves located at the inlet and outlet of the SG pipe act as SG isolation valves. In the case of an accident, these valves close to isolate the SG coils from the remainder of the secondary loop. A secondary set of valves would then open to connect the SG coils to the DHRS heat exchanger. For this study, the DHRS is set to fail and thus the DHRS is omitted from the model. The SG isolation valves are set to close from a low pressurizer pressure signal which has a setpoint of 11.03 MPa. This will occur shortly after the inadvertent opening of the RVV resulting in depressurization of the RPV. The SG isolation valves remain closed for the remainder of the transient.
3.2.4. CNV and Reactor Pool
The CNV of the NuScale is a larger pressure vessel with the RPV located inside. The CNV is located in the reactor coolant pool (UHS) and will transfer heat to the UHS in case of an accident or shutdown of an NPM. The CNV is the depressurization space for the RPV and the fluid inventory of the RPV will also be partially drained into the CNV in case of a shutdown or accident. Under normal operation, the CNV is placed under vacuum which isolates the RPV from the UHS. Flow paths between the RPV and CNV include two reactor safety valves (RSVs) and three RVVs located at the top of the RPV, as well as two reactor recirculation valves (RRVs) located in the downcomer just above the core. The operating conditions of the CNV, UHS, and reactor building are shown in Table 3, with the UHS and reactor building being at atmospheric pressure (100 kPa). It is stated that the pressure of the CNV is set to be less than 0.69 kPa during normal operating conditions [47]. However, this was increased to 5 kPa to allow for saturated liquid conditions at initialization of the current model. This reduces the vacuum in the CNV from 99.3% to 95% and is expected to have no effect on the steady state operation of the model.
| Containment system operating conditions | ||
|---|---|---|
| Internal CNV pressure | 5 | kPa |
| CNV temperature | 310 | K |
| UHS pool water volume | 15,142 | m3 |
| UHS pool water temperature | 310 | K |
| Reactor building air temperature | 300 | K |
- Abbreviations: CNV, containment vessel; UHS, ultimate heat sink.
The CNV is modeled using a pipe component with seven volumes with dimensions, as shown in Table 4. Volume lengths match the volume lengths of the downcomer in the RPV. However, certain sections are lumped together to reduce the number of volumes of the CNV. Volume flow areas are calculated from the CNV and RPV dimensions found in the FSAR [38, 47]. Heat structures exist between the RPV and CNV with dimensions of the RPV wall. Heat structures also connect the CNV to the UHS to represent the CNV wall. These heat structures only include the cylindrical sections of the RPV and CNV walls and do not include the top and bottom of the pressure vessels.
| Volume | Length (m) | Flow area (m2) |
|---|---|---|
| 1 | 0.35 | 8.43 |
| 2 | 2.9 | 2.82 |
| 3 | 2.87 | 9.12 |
| 4 | 3.82 | 8.25 |
| 5 | 3.82 | 8.25 |
| 6 | 3.682 | 8.25 |
| 7 | 4.0 | 14.69 |
The UHS and reactor building are represented by two pipe components (601 and 602), as shown in Figure 1. The dimensions of the UHS and reactor building are shown in Table 5. The UHS has the same volume lengths as the volumes of the CNV, with the addition of two volumes that extend below the CNV representing the 7.64 m space from the bottom of the CNV to the UHS floor. The flow area of the UHS for this model is one-twelfth the flow area (the total NuScale plant consists of 12 NPMs). The coolant level of the UHS pool is set to be slightly above the top of the RPV.
| UHS pipe 601 volumes | Length (m) | Flow area (m2) |
|---|---|---|
| 1 | 3.82 | 567.74 |
| 2 | 3.82 | |
| 3 | 3.25 | |
| 4 | 2.87 | |
| 5 | 3.82 | |
| 6 | 3.82 | |
| 7 | 3.667 | |
| 8 | 4.0 | |
| Reactor building pipe 602 | Length per volume (m) | Flow area (m2) |
| Four volumes | 5.0 | 567.74 |
- Abbreviation: UHS, ultimate heat sink.
The pipe representing the reactor building has a length of 20 m and is divided into four volumes, while the flow area is assumed to be the same as the UHS. The reactor building is filled with air at the start of the simulation. The UHS and reactor building are connected with a single junction.
3.2.5. RVV
The RVV included in this model forms part of the ECCS along with an additional two RVVs and two RRVs. The three RVVs are located at the top of RPV and will vent steam from the pressurizer directly into the CNV when opened. Two RRVs connect the RPV and CNV just above the core and allow for condensed coolant in the CNV to re-enter the RPV. For this study, the selected transient is initiated by the inadvertent opening of one RVV, while the ECCS is assumed to fail. Thus, the additional two RVVs and two RRVs will remain closed for the remainder of the transient. For this reason, only one RVV is included in the model with the other two RVVs and two RRVs being omitted.
The valve component connects the top face of the pressurizer to the bottom face of the seventh volume of the CNV. A trip valve component is used and the flow area is set to 0.016 m2 [20]. The trip valve is initially closed and will instantly open when the trip setpoint is reached. The flow model flags used for the valve are choking set to “on,” the homogeneous flow option is used and the full abrupt area change model is used [36].
3.2.6. Control Systems
The pressurizer heating elements are controlled by a general table linked with a logical trip. The heating elements are switched on if the RPV pressure is below 12.75 MPa. Once this setpoint is reached, the heating elements will be cycled on and off to maintain this pressure. The low-pressure signal set to 11.03 MPa is used to switch off the heating elements during the accident transient.
The model is allowed to run for 10,000 s to ensure a steady state condition. Once the simulation time goes beyond this point, a trip will initiate the transient by opening the RVV. The predetermined reactor power level will also be initiated at this point. The reactor power during steady state operation and the accident transient is controlled by a general table. Steady state power of the core was reduced from 160 to 159 MW to achieve a better energy balance in the primary loop and achieve the desired core outlet temperature and primary loop mass flow. Five seconds after initiation of the transient, the core is set to trip and the power level decreases to decay power levels. The reactor power level for the duration of the transient was taken from Skolik et al.‘s [20] study.
3.2.7. Material Properties
ASYST 3.4 requires the thermal conductivity (W/m K) and volumetric heat capacity (J/m3 K) to characterize a given material. The properties of candidate ATF cladding materials FeCrAl and SiC compared to Zr-alloy were discussed in Section 2. For Zr-alloy (Zircaloy-4), the thermal conductivity and specific heat capacity are given as functions of temperature, with the volumetric heat capacity calculated by multiplying the specific heat capacity by a constant density of 6,560 kg/m3 [48].
The FeCrAl alloy used in this study is B136Y alloy developed by Oak Ridge National Laboratory and contains 6% Al and 13% Cr as well as small quantities of Mo, Si, and Nb [14].
The surface roughness of Zr-alloy and FeCrAl are 1.61 and 4.53 µm, respectively [6].
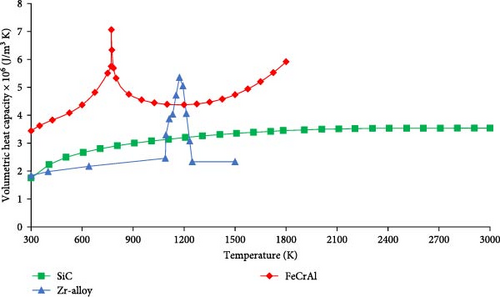
Properties of SiC are taken from the studies by Yu, Chen, and Cai [3] and Katoh et al. [13], with a constant density of 2580 kg/m3 used to calculate the volumetric heat capacity. The surface roughness of the SiC cladding is taken as the surface roughness of SiC manufactured with chemical vapor deposition (CVD) which is ~1.0 µm [49]. The thermophysical properties of the three cladding materials are shown in Figures 2 and 3.
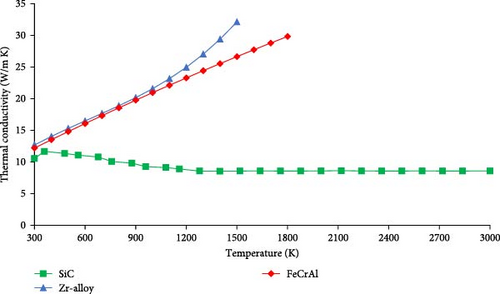
The thermal conductivity of Zr-alloy and FeCrAl is similar at lower temperatures but starts to diverge at ~900 K with Zr-alloy having a higher thermal conductivity at its failure point compared to FeCrAl. Unlike Zr-alloy and FeCrAl, the thermal conductivity of SiC decreases with an increase in temperature. A slight decrease in thermal conductivity can be seen up to a temperature of ~1300 K, from which point onward the thermal conductivity remains constant up to the failure point.
Zr-alloy has the lowest average volumetric heat capacity of the three cladding materials. The peak in the volumetric heat capacity of Zr-alloy is attributed to a phase change from alpha to beta phase at a temperature of 1139 K [50]. Even though SiC has the highest specific heat capacity, due to its low density the volumetric heat capacity is much more in line with that of Zr-alloy. FeCrAl has the highest volumetric heat capacity with a peak in the volumetric heat capacity due to a phase change from the ferromagnetic to the paramagnetic state at the Curie temperature of 771 K [14].
UO2 is used as fuel material with temperature, specific heat capacity, and density given by Popov et al. [51]. A helium gap exists between the fuel and cladding material with the thermophysical properties of helium taken from engineering equation solver (EES) [52]. The SG tubes used in the NuScale are made of SB-163 Alloy 690 (UNS N06690) [46]. The properties of Inconel Alloy 690 were used in the current study, as this is a commercially available version of the same alloy, and its thermophysical properties are easily attained. Temperature correlations for the thermal conductivity and specific heat capacity were given, with the volumetric heat capacity calculated by using a constant density of 8190 kg/m3 [53]. The material is used in the heat structure connecting the upper downcomer to the SG pipe. The majority of the RPV and large sections of the CNV are made of SA-508 low alloy steel [46, 47]. Temperature correlations are given for thermal conductivity, specific heat capacity, and density [54]. The material is used for the RPV wall, all internal structures of the RPV and the CNV wall.
3.3. Model Validation
The reference model is validated using data taken from the NuScale FSAR [38, 46, 55] and Skolik et al.’s [20] study. Data taken from Fakhraei et al.’s [28] study are also used for steady state validation. The data used for validation are all based on simulations of the NuScale SMR as there are no experimental data available for this reactor. Data gathered during the current study will be labeled with “ASYST 3.4.”
3.3.1. Steady State Operation
The main steady state parameters used to evaluate the NuScale SMR thermal–hydraulic performance are shown in Table 6 and compared with data taken from the NuScale FSAR [38, 46] and the studies done by Skolik et al. [20] and Fakhraei et al. [28]. A percentage error is also calculated for each data set compared to the data set gathered in this study. Some values are fixed as they are used as input parameters or controlled by the reactor control system. These values are the core thermal power, RPV pressurizer pressure, SG secondary inlet temperature, SG pressure, and SG feedwater flow rate. The time-dependent volume at the outlet of the SG was set to a pressure of 3.45 MPa. However, the pressure taken from the lowest volume of the SG pipe was slightly higher at 3.51 MPa due to the pressure difference over the SG.
| Parameter | ASYST 3.4 | FSAR [38, 46] | Error (%) | Skolik et al. [20] | Error (%) | Fakhraei et al. [28] | Error (%) |
|---|---|---|---|---|---|---|---|
| Core thermal power (MW)a | 159 | 160 | 0.63 | 160 | 0.63 | 158.1 | 0.57 |
| SG secondary inlet temperature (K)a | 421.87 | 421.87 | 0.00 | 422 | 0.03 | 421.9 | 0.01 |
| RPV pressurizer pressure (MPa)a | 12.75 | 12.76 | 0.12 | 12.8 | 0.43 | 12.754 | 0.07 |
| SG pressure (MPa)a | 3.51 | 3.45 | 1.79 | 3.45 | 1.79 | 3.45 | 1.79 |
| Average SG feedwater flow rate (kg/s)a | 67.07 | 67.07 | 0.00 | 70 | 4.19 | 67.2 | 0.20 |
| Core outlet temperature (K) | 586.73 | 587.04 | 0.05 | 585.1 | 0.28 | 586 | 0.12 |
| Core inlet temperature (K) | 536.24 | 531.48 | 0.90 | 531.9 | 0.82 | 535.9 | 0.06 |
| Core temperature rise (K) | 50.49 | 55.56 | 9.12 | 53.2 | 5.09 | 50.1 | 0.78 |
| SG secondary outlet temperature (K) | 579.76 | 580.04 | 0.05 | 574.79 | 0.86 | — | — |
| Average coolant flow rate (kg/s) | 587.31 | 587.15 | 0.03 | 567 | 3.58 | 590.4 | 0.52 |
- Abbreviations: RPV, reactor pressure vessel; SG, steam generator.
- aIndicates input parameters or parameters controlled by the control system.
The core outlet temperature of all four data sets agrees with each other with small errors. A larger difference can however be seen in the core inlet temperature when compared with the FSAR [38]. This leads to an error of 9.12% in the core temperature rise. The core inlet temperature found in the FSAR [38] is difficult to replicate without changing other important parameters, as many of the parameters are dependent on each other. Skolik et al. [20] were able to better replicate the core inlet temperature of the FSAR but has a lower coolant flow rate on the primary side and higher SG feedwater flow rate. The core inlet temperature and core temperature rise of the ASYST 3.4 model better aligns with the model of Fakhraei et al. [28], while having a similar coolant flow. The higher core inlet temperature of the current model is therefore acceptable.
The SG secondary outlet temperature is very similar to that of the FSAR [46], whereas the value from Skolik et al. [20] has a larger error. However, Skolik et al. [20] does reference the FSAR value for the SG outlet temperature as 574.8 K, which is much closer to the value obtained by Skolik et al. The SG outlet temperature of the model by Fakhraei et al. [28] was not provided.
3.3.2. Accident Transient
Two sets of results are used to validate the transient behavior of the current model. The selected transient is the inadvertent opening of a single RVV without use of the ECCS and DHRS. The first set of results is taken from the NuScale FSAR [55] and involves the inadvertent opening of a single RVV with successful operation of the ECCS. One RVV is opened at the start of the transient with the remaining ECCS valves opening after 3925 s. The operation of the DHRS is excluded from this transient. Thus, the transient is the same as the transient in the current study for the first 3925 s [55].
The second set of results was taken from Skolik et al. [20] study, which the model and transient in the current study are based on. The model by Skolik et al. [20] is, however, more complex than the model developed for the current study as it includes a more complex core which allows for oxidation and melting of core materials. The simulation of Skolik et al. [20] also runs for 24 h which is far past the point of failure of the cladding and fuel materials, while simulations in the current study are terminated at the point of failure of the cladding materials.
The transient sequence of events is shown in Table 7 with the ASYST 3.4 model being compared with that of the FSAR [55] and Skolik et al. [20]. Both scenarios are initiated by the opening of a single RVV. The low pressurizer pressure signal is triggered after 1 s in both ASYST 3.4 and Skolik et al. [20]. The reactor trip of ASYST 3.4 and Skolik et al. [20] both happen after 5 s, while the FSAR [55] is faster at 2.3 s. Maximum CNV pressure in ASYST 3.4 occurs much sooner than Skolik et al. [20]. However, the time of maximum CNV pressure aligns more with that of the FSAR [55]. ECCS actuation happens after 3925 s in the FSAR [55], which mitigates the accident, and the transient is terminated after 4500 s. ECCS actuation in Skolik et al. [20] fails and the accident is free to progress resulting in oxidation of the cladding starting after 4.5 h with core damage after 4.8 h. In the case of the ASYST 3.4 model, ECCS actuation is also set to fail with core damage happening after 6.42 h. This is a 1.6-h delay compared to Skolik et al. [20].
| Event | ASYST 3.4 | FSAR [55] | Skolik et al. [20] |
|---|---|---|---|
| RVV opens | 0 s | 0 s | 0 s |
| Low pressurizer pressure signal (11.03 MPa) | 1 s | — | 1 s |
| Reactor trip | 5 s | 2.3 s | 5 s |
| Maximum CNV pressure | 53 s (5.03 MPa) | 52 s | 77 s (4.18 MPa) |
| ECCS actuation | — | 3925 s | — |
| Cladding oxidation starts | — | — | 4.5 h |
| Core damage (>1477 K) | 6.41 h | — | 4.8 h |
| Simulation terminated | At cladding failure or 24 h | 4500 s | 24 h |
- Abbreviations: CNV, containment vessel; ECCS, emergency core cooling system; FASR, final safety analysis report; RVV, reactor vent valve.
Figure 4 shows the RPV and CNV pressures of ASYST 3.4 and Skolik et al. [20] for the first 500 s of the transient. The general trend of depressurization of the RPV down to 7 MPa is similar for both scenarios, whereafter the pressures diverge to meet the corresponding rise in CNV pressure. For both scenarios, the RPV and CNV pressures equalizes roughly at the point of maximum CNV pressure, which is shown in Table 7. In the case of ASYST 3.4, the CNV maximum pressure was reached earlier than that of Skolik et al. [20]. After the initial depressurization, a downward trend is observed in the RPV pressure of ASYST 3.4, and it nearly matches the RPV pressure of Skolik et al. [20] after 500 s.
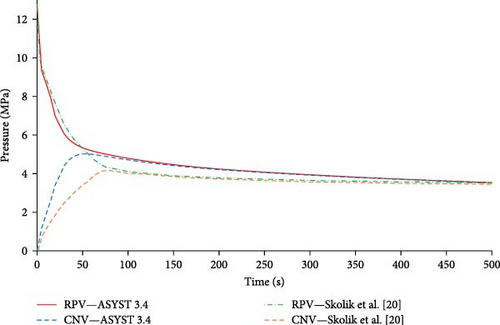
Figure 5 shows the RPV pressures for ASYST 3.4 and Skolik et al. [20] for the remainder of the ASYST 3.4 transient until termination. The downward trend of the ASYST 3.4 RPV pressure is visible with the pressure decreasing faster in the first hour compared to Skolik et al. [20]. The ASYST 3.4 pressure stabilizes after roughly 2 h where Skolik et al. [20] pressure steadily decreases. After 5 h, the pressure is 1.76 and 1.51 MPa for Skolik et al. [20] and ASYST 3.4, respectively. The pressure of Skolik et al. [20] starts to increase at 5 h most likely due to heat generated from oxidation which is not included in the ASYST 3.4 model.
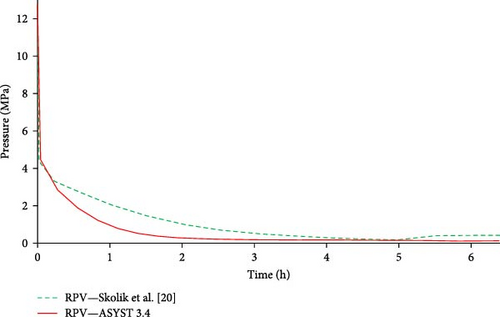
Several factors could contribute to the difference in RPV pressure between ASYST 3.4 and Skolik et al. [20] over the first few hours of the transient. The RVV in ASYST 3.4 is set to use the default choked flow model as with Skolik et al. [20]. However, it is not specified whether the homogeneous or nonhomogeneous flow model is used for the valve in Skolik et al. [20]. Other discrepancies could include parameters such as differences in RPV and CNV dimensions, pressurizer initial water level and pressure, SG feedwater parameters, and CNV parameters. Finally, a heat structure representing the RPV wall was not included in the model of Skolik et al. [20] as in the case of the ASYST 3.4 model. This could contribute to increased energy removal from the RPV resulting in lower pressures [20].
Figure 6 shows the reactor coolant system (RCS) flow for the first 1500 s of the transient. The RCS flow is the coolant flow on the primary side of the reactor model, measured in the riser section above the core. Thus, the RCS flow is the total flow through the core. The RCS flow of the FSAR [55] rapidly decreases in the first 100 s after which point a mass flow of less than 5 kg/s is maintained with occasional oscillations. Flow oscillations are a common occurrence in natural circulation SMRs during various operational and accident transient [19, 24, 26]. In contrast, the RCS flow of ASYST 3.4 is still high after 100 s (~350 kg/s) and gradually decreases to zero at ~350 s, at which point larger mass flow oscillations start to occur. These mass flow oscillations appear periodically up to 1500 s, after which point a steady mass flow of less than 2 kg/s is maintained for the remainder of the transient.
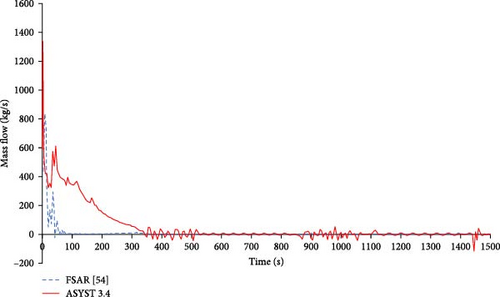
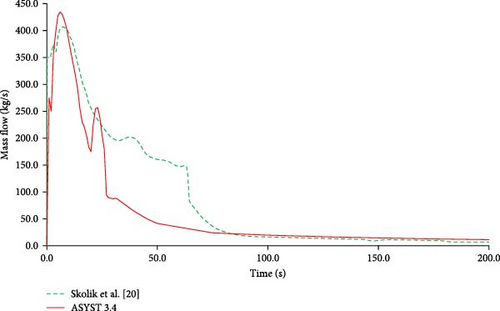
Figure 7 shows the break flow at the start of the transient. The break flow is the mass flow through the break (RVV) from the RPV to the CNV. Both scenarios exhibit an initial peak in the break flow with ASYST 3.4 having a higher peak of 427.63 kg/s but a faster decrease in break flow. Both scenarios follow a different break flow profile after the initial peak flow, but the break flow is similar after 100 s. These differences can once again be attributed to the discrepancies in the RVV flow model, system parameters and CNV dimensions [20].
Figures 8 and 9 show the RCS temperature for the first 50 and 4000 s of the transient, respectively. As seen in Figure 8, the difference in core inlet and outlet temperature is reduced as the reactor power is reduced from 160 MW to the decay power of less than 15 MW after 10 s. Isolation of the secondary side feedwater results in the decrease of heat removal from the primary loop leading to an increase of core inlet temperature. ASYST 3.4 core outlet temperature rapidly decreases while the core inlet temperature increases, and the temperatures equalize at 35 s and 546 K. The core inlet and outlet temperature of the FSAR [55] has a more gradual change and equalizes beyond 50 s. The reduction in RCS temperature shown in Figure 9 is largely due to the depressurization of the RPV during the transient. Over a period of 4000 s, the ASYST 3.4 core outlet temperature has a more significant decrease compared to that of the FSAR [55]. This downward trend is similar to the pressure response of the ASYST 3.4 RPV, as shown in Figures 4 and 5.
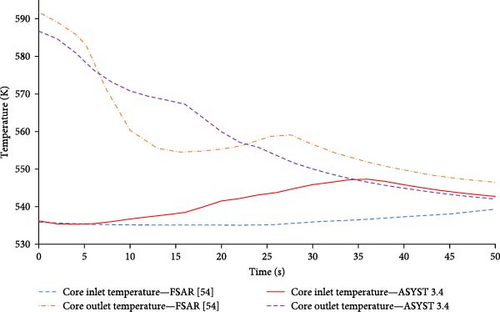
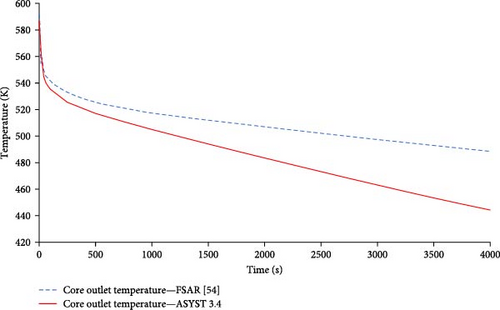
Figure 10 shows the cladding temperature for the first 500 s of the transient. The ASYST 3.4 temperature rapidly decreases in the first 20 s of the transient, after which it stabilizes. A downward trend is then observed and the temperatures of ASYST 3.4 and Skolik et al. [20] are similar after 500 s. The trend of the cladding temperature for both scenarios is very similar to the trend of the RPV pressure, as shown in Figure 4. Thus, a link can be drawn from the RPV pressure response which influences the RCS temperature and by extension the cladding temperature.

Figure 11 shows the cladding/fuel temperature for Skolik et al. [20] for 10 h and the PCT of ASYST 3.4 up to the point of cladding failure. In the case of Skolik et al. [20], the cladding temperature starts to increase after 3.5 h due to the reduction in coolant level and the core becoming uncovered. After 4.5 h, the cladding reaches a temperature of 1477 K at which point oxidation produces heat of up to 24 MW and the temperature rapidly increases. The melting point of the cladding is reached after 4.8 h at 2200 K from which point onward the maximum fuel temperature is shown. The temperature continues to increase to ~2700 K at 5.4 h and then decreases to ~1650 K after 6.3 h. However, continued oxidation of the cladding and the loss of coolable geometry results in an increase in the maximum fuel temperature to 2800 K after 7 h, and a temperature of ~2900 K is maintained for the remainder of the 24 h transient [20].
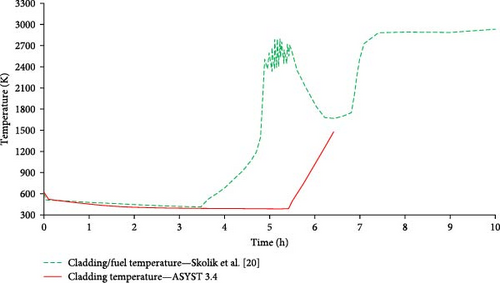
The cladding temperature of ASYST 3.4 is lower than that of Skolik et al. [20] during the first 3.5 h of the transient. This is most likely due to the differences in RPV pressure during this period resulting in lower RCS temperatures and lower cladding temperatures. The point where the cladding temperature starts to increase due to the reduction in coolant level occurs at 5.4 h. This is delayed by 1.9 h compared to Skolik et al. [20]. This difference can be traced back to the RPV pressure response as this resulted in lower RCS temperatures and a reduction in the boiloff rate of coolant in the RPV. A higher RCS flow is also maintained during the initial stages of the transient. From the point of the core becoming uncovered, the cladding temperature steadily increases until the failure point of the cladding is reached at 1477 K after 6.42 h. Oxidation of Zr-alloy starts at 1173 K with a failure point of 1477 K due to this oxidation, according to safety standards set by the NRC [3].
The model was validated for both steady state operation and a selected accident transient. Validation was carried out with data taken from the NuScale FSAR [38, 46, 55] as well as literature [20, 28]. The steady state parameters of the model in the current study agree with the steady state parameters given by the FSAR [38, 46]. The transient behavior of the model in the current study is characterized by a faster decrease in RPV pressure compared to results from the FSAR [55] and Skolik et al. [20]. This most likely leads to the lower RCS temperatures and subsequent lower cladding temperatures throughout the transient. The general behavior of the model is the same as that of Skolik et al. [20], with the coolant level in the RPV gradually decreasing until the core becomes uncovered, resulting in core damage. Thus, the model is suitable for evaluating the use of ATF cladding materials.
4. Results and Discussion
Steady state performance of the NuScale with ATF cladding was first evaluated. The current NuScale model with Zr-alloy cladding was validated for steady state operation using data from the FSAR and other articles [20, 28, 38, 46]. A worst-case scenario accident transient was also evaluated, which is the inadvertent opening of a RVV with subsequent failure of the ECCS and DHRS. This accident transient was selected as it is one of the accidents with the highest core damage frequency, even though the probability of this accident occurring is very low at ~10−11/reactor-year [20]. Two sets of data were used for validation of the transient. The first taken from the FSAR [55] is an accident transient with inadvertent opening of an ECCS valve with successful operation of the remaining ECCS valves after 3925 s. The second set of data is the worst-case scenario accident transient presented by Skolik et al. [20].
In the validated model, Zr-alloy cladding was replaced with FeCrAl and SiC cladding to compare results. Changes to the model only include the selection of another cladding material (changing the thermophysical properties) and changing the wall roughness in the fuel channels to that of the corresponding cladding material. All other aspects of the model remain the same including the fuel rod pitch, fuel diameter, and cladding thickness.
4.1. Steady State Operation
The steady state parameters of the NuScale model with ATF cladding materials can be seen in Table 8. The core power, RPV pressure, SG inlet temperature and pressure, and the SG feedwater flow rate are used as input parameters or controlled by the reactor control system.
| Parameter | Zr-alloy | FeCrAl | Change (%) | SiC | Change (%) |
|---|---|---|---|---|---|
| Core thermal power (MW) | 159.00 | 159.00 | — | 159.00 | — |
| Core outlet temperature (K) | 586.73 | 586.78 | +0.008 | 586.72 | −0.002 |
| Core inlet temperature (K) | 536.24 | 536.19 | −0.009 | 536.25 | +0.002 |
| Core temperature rise (K) | 50.49 | 50.59 | +0.190 | 50.47 | −0.040 |
| SG secondary inlet temperature (K) | 421.87 | 421.87 | — | 421.87 | — |
| SG secondary outlet temperature (K) | 579.76 | 579.75 | −0.001 | 579.76 | — |
| RPV pressurizer pressure (MPa) | 12.75 | 12.75 | — | 12.75 | — |
| Normal steam pressure (MPa) | 3.51 | 3.51 | — | 3.51 | — |
| Average coolant flow rate (kg/s) | 587.31 | 586.19 | −0.190 | 587.56 | +0.042 |
| Average SG feedwater flow rate (kg/s) | 67.07 | 67.07 | — | 67.07 | — |
| Peak cladding temperature (K) | 621.27 | 607.36 | −2.240 | 629.18 | +1.270 |
| Peak fuel centerline temperature (K) | 962.83 | 963.00 | +0.017 | 971.09 | +0.860 |
- Abbreviations: ATF, accident tolerant fuel; RPV, reactor pressure vessel; SG, steam generator.
The core inlet and outlet temperatures for all three cladding materials remain the same, with the largest change being the <0.2% increase in the core temperature rise with the FeCrAl cladding. The SG outlet temperature showed a negligible change with the use of the ATF cladding materials. Some minor changes can be seen in the coolant flow rate which is most likely due to the changes in surface roughness of the cladding materials.
The largest differences in the use of ATF cladding compared to Zr-alloy can be seen in the PCT and PFCT. The PFCT is the maximum temperature measured in the UO2 fuel which during steady state operation occurred in the fifth axial node from the bottom of the hot channel heat structure with the radial position being the left boundary of the heat structure that is the fuel centerline. The PCT is the maximum temperature measured in the cladding material which during steady state operation was also at the fifth axial node of the hot channel heat structure with the radial position being the inner wall of the cladding. These changes are due to the differences in thermophysical properties of the cladding materials. FeCrAl has a 2.24% decrease in PCT compared to Zr-alloy. While FeCrAl and Zr-alloy have a similar thermal conductivity at this temperature range, there is a large difference in the volumetric heat capacity of the two materials. The higher volumetric heat capacity of FeCrAl indicates the material requires more energy to achieve the same temperature as Zr-alloy. The energy remains the same between the two simulations and thus the PCT is lower in the case of FeCrAl which is a good result. SiC shows a 1.27% increase in the PCT compared to that of Zr-alloy. Although SiC has the highest specific heat capacity of all three cladding materials, the volumetric heat capacity is more in line with that of Zr-alloy due to the lower density of SiC compared to Zr-alloy and FeCrAl. The higher PCT is a result of the lower thermal conductivity of SiC compared to Zr-alloy, especially at high temperatures. However, SiC has the highest melting temperature of the three claddings considered.
The PFCT with FeCrAl shows a 0.017% or 0.17°C increase compared to that of Zr-alloy, which is negligible. In the case of SiC, the PFCT showed an increase of 0.86% or 8.26°C. This is due to the combination of a slight increase in volumetric heat capacity and a large decrease in thermal conductivity compared to Zr-alloy. In general, there are no significant differences in the thermal–hydraulic performance of the NuScale at steady state when substituting Zr-alloy cladding with FeCrAl or SiC cladding. The only change of importance is the increase in PFCT with the use of SiC cladding. It is unlikely that this small change in temperature would have a large effect on the operation of NuScale. However, this should be taken into consideration when performing multiphysics calculations of the NuScale core.
4.2. Accident Transient
The event timing of the accident transient with Zr-alloy cladding is shown in Table 7 (ASYST 3.4). The transient is initiated by the opening of an RVV. Depressurization of the RPV results in a low-pressure signal occurring after 1 s. The reactor trip is predetermined to occur at 5 s. Maximum CNV pressure occurs after 53 s and the RPV and CNV pressures equalize at this point. Failure of the Zr-alloy cladding occurs at 6.41 h from the start of the transient. The transient progression up to the point of failure is shown in Figures 4–11.
In general, transient results with the two ATF claddings remain the same as the transient results with Zr-alloy cladding. The transient sequence of events, shown in Table 7, is the same when substituting Zr-alloy cladding with FeCrAl or SiC cladding, except for the time and temperature at which core damage occurs. The RPV and CNV pressure, RCS temperature and cladding temperature also is the same for FeCrAl and SiC cladding compared to Zr-alloy cladding, as shown in Figures 4, 5, 8–10.
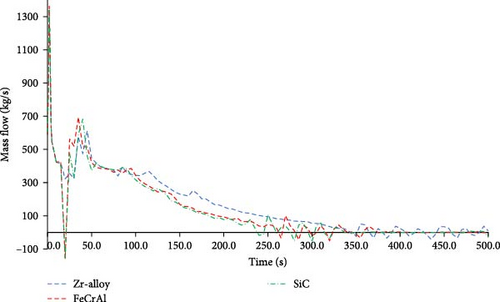
The RCS flow with the three cladding materials can be seen in Figure 12. A decrease in the RCS flow is visible at a time of 20 s for all three cladding materials. However, where the RCS flow with Zr-alloy decreases to ~320 kg/s at this point, the RCS flow turns in the negative direction down to roughly negative 156 kg/s in both cases with FeCrAl and SiC cladding. After this point, the RCS flow in the case of FeCrAl and SiC returns to a similar value than Zr-alloy and the RCS flow in all three cases follow a similar trend. The point at which the RCS flow reaches zero and flow oscillations commence is reached faster with the two ATF claddings, with FeCrAl at 260 s and SiC at 240 s compared to Zr-alloy at 350 s. The differences in RCS flow are attributed to the differences in thermophysical properties and surface roughness of the three cladding materials. FeCrAl has a higher surface roughness compared to Zr-alloy which leads to higher flow resistance. The driving force of the natural circulation could also be reduced by the high volumetric heat capacity of FeCrAl and the low thermal conductivity of SiC. The RCS flow for all three cladding materials is similar for the remainder of the transient.
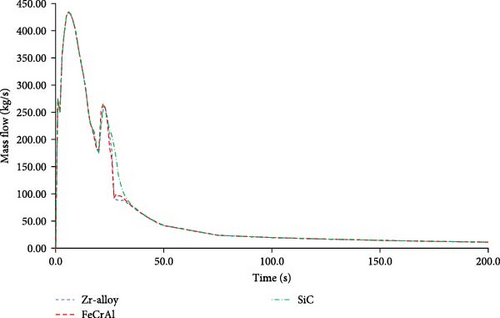
The flow through the RVV, also referred to as the break flow, for all three cladding materials can be seen in Figure 13. All three cases are nearly the same for the first 20 s at which point they start to diverge. This coincides with the large difference seen in the RCS flow at this time. However, the values converge again at ~35 s and remain the same for the remainder of the transient. Similar trends were observed in the RCS temperature and cladding temperature during this period. In the period of 20–35 s, the difference in core inlet temperature between the three cases was less than 2°, with the core outlet temperature having a difference of less than 1°. The maximum difference in cladding temperature during this period is also less than 2°. After 35 s, these values converge and remain similar for the remainder of the transient.
The maximum cladding temperature for the three cladding materials up to the point of failure is shown in Figure 14. The temperature differences between the three cladding materials during steady state operation decrease within the first 50 s of the transient, and the temperatures are the same throughout the first 5 h of the transient. The temperature increases due to the core becoming uncovered, at 5.3 h for SiC, 5.4 h for Zr-alloy, and 5.55 h for FeCrAl. The temperature increase in SiC starts earlier due to the maximum temperature occurring in the tenth axial node (topmost node) of the hot channel. As the coolant level decreases, this is the first node to become uncovered. The maximum cladding temperature of FeCrAl occurs in the eighth axial node of the hot channel.
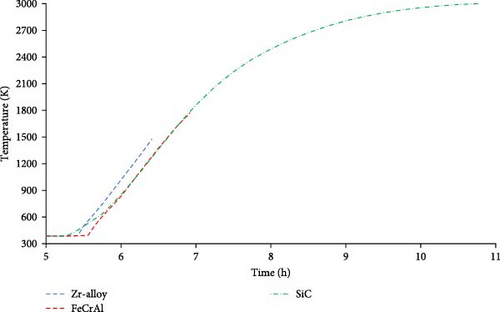
A discrepancy is seen in the maximum cladding temperature of Zr-alloy as this occurs in the eighth axial node of the average channel and not the hot channel as expected. This is most likely due to the coolant level being lower in the average channel than in the hot channel. A similar trend is seen in the maximum cladding temperature of FeCrAl, where the PCT is in the average channel during initial stages of the temperature increase. The PCT in the hot and average channels with FeCrAl intersect at 6.56 h and 1439 K, from which point onward the PCT is in the hot channel. In the case of Zr-alloy, the transient is terminated due to failure of the cladding before this intersection point is reached. A possible solution would be to add crossflow between the fuel channels to ensure that the coolant level is equal between the two channels.
The time of failure of Zr-alloy is at 6.42 h at a temperature of 1477 K. The PCT with Zr-alloy in the hot channel at this point is 1441 K. The failure point of FeCrAl cladding is 6.92 h from the start of the transient at a temperature of 1773 K. This is a 0.5-h increase in coping time compared to the point of failure of Zr-alloy. It is important to note that the failure point of FeCrAl is the melting point of this material, while the failure point of Zr-alloy is 1477 K due to oxidation. Also, the point where the temperature increases due to the core being uncovered is delayed by 0.15 h, most likely due to the differences in thermophysical properties and surface roughness of FeCrAl. In the case of SiC, the trend at which temperature increases closely follows that of FeCrAl up to the point of failure of FeCrAl. Due to the high melting point of SiC, the transient progresses past the time of failure of FeCrAl with a continued increase in cladding temperature. The failure point is reached after 10.77 h at a temperature of 3000 K. Although this temperature occurred in the tenth axial node of the hot channel, all nodes that are uncovered at this point have temperatures within 10° of the hottest node. The point of failure of SiC is delayed by 4.35 h compared to Zr-alloy which adds significant coping time for this ATF. In all cases, the core temperature remains under the melting point of UO2.
A summary of the time and temperature at which the cladding materials fail with a percentage increase in coping time can be seen in Table 9. FeCrAl showed a 7.79% increase in the coping time, which agrees with prior studies. In the study by Yu, Chen, and Cai [3], a 8.4% increase in coping time was seen when using FeCrAl, while SiC did not fail within the simulation time. Gurgen and Shirvan [14] also showed that the use of FeCrAl improved coping time by 10.3% during short-term SBO and 16.4% during long-term SBO accident transients. For the current study, SiC improved the coping time by 67.76% due to its high melting temperature.
| Cladding | Failure point (K) | Time to failure (h) | Increase (%) |
|---|---|---|---|
| Zr-alloy | 1477.0 | 6.420 | — |
| FeCrAl | 1773.0 | 6.920 | 7.79 |
| SiC | 3000.0 | 10.77 | 67.76 |
5. Conclusion
In the current study, a thermal–hydraulic system evaluation of a natural circulation SMR using ATF was conducted. The NuScale was selected for this study and evaluation was conducted on the steady state operation of the reactor as well as one worst-case scenario accident transient. The two ATF cladding materials selected for this study were FeCrAl alloy and a SiC composite. A model of the NuScale was developed using the ASYST 3.4 thermal–hydraulics code. The model was validated for steady state operation and the worst-case scenario accident transient.
Results showed that most of the steady state parameters remain the same or have negligible change when substituting Zr-alloy cladding with FeCrAl or SiC. The largest changes are seen in the PCT and PFCT. A 2.24% decrease is seen in the PCT when using FeCrAl which might be beneficial. A 1.27% increase is seen in the PCT when using SiC. Nonetheless, SiC has the highest melting temperature of all three cladding materials considered. A negligible increase in PFCT is seen with FeCrAl. An increase of 0.86% in PFCT is seen when using SiC. This remains well within the operational conditions for UO2 fuel. However, this should be taken into consideration when performing multiphysics calculations of the NuScale core with SiC cladding.
During the worst-case scenario accident transient Zr-alloy reached its failure temperature at 6.42 h from the start of the transient. The failure temperature of Zr-alloy was set to 1477 K due to oxidation. The failure temperature of FeCrAl (1773 K) was reached at a time of 6.92 h, providing an additional 0.5 h or 7.79% coping time. The failure temperature of SiC (3000 K) resulted in failure at 10.77 h, adding a significant 4.35 h or 67.76% to the coping time. SiC also has many other advantages not evaluated in the current study such as an increased oxidation resistance and a decrease in the thermal neutron absorption cross-section. It is therefore recommended to use SiC as ATF cladding in the NuScale to enhance the safety during accident scenarios.
Oxidation of Zr-alloy cladding is a large risk to the safety of LWRs in terms of hydrogen production and the addition of heat. The current model should be improved upon by adding models for oxidation and melting of fuel elements. The reactor kinetics model of ASYST 3.4 may be used in future studies to better predict the core power distribution when compared to the predetermined power profile used in this study. Based on the changes in PFCT and PCT and the differences in microscopic thermal neutron absorption cross sections of the three cladding materials, it is recommended that multiphysics calculations of the NuScale core with the selected cladding materials be performed to determine a more accurate core power distribution for each cladding material. Multiphysics calculations can also be used to perform neutronic, thermal–hydraulic, and burnup analysis.
Discrepancies were seen in the location of the PCT and PFCT. At the point of failure of Zr-alloy, the maximum temperatures were seen in the average channel and not the hot channel as expected. This is most likely due to a difference in the coolant level between the hot and average channel. A possible solution would be to add crossflow between the fuel channels. The current model could be expanded upon to evaluate a wider range of scenarios, and this may require the addition of the ECCS, DHRS, and the remainder of the secondary loop.
Nomenclature
-
- ADS:
-
- Automatic depressurization system
-
- ASYST:
-
- Adaptive system thermal–hydraulics
-
- ATF:
-
- Accident tolerant fuel
-
- BDBA:
-
- Beyond design basis accident
-
- BOC:
-
- Beginning of cycle
-
- BWR:
-
- Boiling water reactor
-
- CHF:
-
- Critical heat flux
-
- CNSS:
-
- Centre for Nuclear Safety and Security
-
- CNV:
-
- Containment vessel
-
- CVD:
-
- Chemical vapour deposition
-
- DBA:
-
- Design basis accident
-
- DHRS:
-
- Decay heat removal system
-
- ECCS:
-
- Emergency core cooling system
-
- EES:
-
- Engineering equation solver
-
- FSAR:
-
- Final safety analysis report
-
- HTC:
-
- Heat transfer coefficient
-
- ID:
-
- Inner diameter
-
- LOCA:
-
- Loss of coolant accident
-
- LOFW:
-
- Loss of feedwater
-
- LWR:
-
- Light water reactor
-
- MASLWR:
-
- Multiapplication small light water reactor
-
- NNR:
-
- National nuclear regulator
-
- NPM:
-
- NuScale power module
-
- NPP:
-
- Nuclear power plant
-
- NRC:
-
- Nuclear Regulatory Commission
-
- PCT:
-
- Peak cladding temperature
-
- PFCT:
-
- Peak fuel centerline temperature
-
- PWR:
-
- Pressurized water reactor
-
- RCS:
-
- Reactor coolant system
-
- RELAP:
-
- Reactor Excursion and Leak Analysis Program
-
- RHRS:
-
- Residual heat removal system
-
- RPV:
-
- Reactor pressure vessel
-
- RRV:
-
- Reactor recirculation valve
-
- RSV:
-
- Reactor safety valve
-
- RVV:
-
- Reactor vent valve
-
- SA:
-
- Surface area
-
- SBLOCA:
-
- Small break loss of coolant accident
-
- SBO:
-
- Station blackout
-
- SG:
-
- Steam generator
-
- SI:
-
- Safe injection
-
- SMR:
-
- Small modular reactor
-
- UHS:
-
- Ultimate heat sink.
Conflicts of Interest
The authors declare no conflicts of interest.
Funding
This work is based on research supported through financial support by the Centre for Nuclear Safety and Security (CNSS), an initiative by the National Nuclear Regulator (NNR) of South Africa dedicated to developing skills demanded by the South African nuclear sector.
Open Research
Data Availability Statement
The data supporting the findings of this study are available upon request. Interested researchers may contact Willem Zuidersma at [email protected] for access to the dataset, fostering transparency, and collaboration in research. Data sharing will adhere to ethical and legal standards to ensure participant privacy. We welcome inquiries from fellow researchers, acknowledging the importance of open access to advance scientific knowledge.


