Modifying the Surface of Twisted Tapes With a Hydrophobic Coating to Enhance Their Performance in Parabolic Trough Solar Collector
Abstract
Twisted tapes are widely recognized as an effective passive method to enhance heat transfer in parabolic trough solar collectors. However, a major drawback is the substantial pressure drop caused by the high friction between the fluid flow and the tape surface. This study introduces hydrophobic twisted tapes as a solution to reduce pressure drop while sustaining enhanced heat transfer. A variety of twisted tapes with differing widths and twist ratios were fabricated and tested experimentally under laminar and turbulent flow regimes, focusing on pressure drop, efficiency, and performance index. The results demonstrate that hydrophobic twisted tapes can elevate the performance index from below one to above one. At the flow rate of 50 Lph, the performance index of the twisted tape with a hydrophobic surface increased by 125%. It was observed that increasing the tape width and reducing the twist ratio led to higher pressure drop, improved efficiency, and a better performance index. Additionally, the study compared the performance of twisted tapes with fixed versus variable widths. Experimental findings revealed that twisted tapes with variable widths exhibit superior performance compared to those with fixed widths. At a flow rate of 50 Lph, the performance index of the variable width twisted tape with a hydrophobic surface increased by 143%.
1. Introduction
Solar energy is considered the most important source of free, clean, and renewable energy that has no limits and has no impact on the environment [1, 2]. It can be defined as the energy originating from the sun that can be converted into heat and electricity. It produced energy for billions of years, yet its utilization has garnered significant technological attention, especially in the last decade [3, 4]. The increasing energy demand, limited fossil fuels, and environmental concerns related to fossil fuel usage, such as carbon dioxide emissions, drive the heightened focus on solar energy applications [5, 6]. The solar collector is a system that converts the energy from incident solar radiation into thermal energy in solar thermal applications. There are various solar collectors, but the most popular kind of high-temperature solar collector is the parabolic solar collector [7]. The solar collector absorbs solar radiation, converts it to heat, and subsequently transfers it to the working fluid. Therefore, achieving better heat transfer to the fluid results in a higher outlet temperature and increases the collector efficiency in the power cycle [8, 9].
There are three methods to improve heat transfer in thermal systems, including solar collectors [10]. The active method, often more complex in design, involves applying external forces to enhance heat transfer within a system [11]. Surface and fluid vibration and mechanical aids, as well as suction or injection, exemplify active techniques. The passive method typically involves surface or geometric modifications to the flow channel by incorporating inserts or additional devices. In this method, no external power is used. Examples include inserts as extra components, displaced enhancement devices, coiled tubes, extended surfaces, treated and rough surfaces, and additives for fluids [12, 13]. A combined approach integrates both active and passive techniques. However, due to its complex design, the combined approach is applicable only to specific applications [14].
Twisted tape inserts are recognized as one of the applications of the passive method employed to enhance the efficiency of solar collectors. These techniques primarily involve disturbing the boundary layer and inducing a swirling flow. This condition generates increased turbulence next to the surface tube of the solar collector, consequently enhancing heat absorption from the surface of the collector tube by the fluid. The impact of turbulators on heat transfer in heat exchangers is known to vary based on their shape and geometry.
Bellos and Tzivanidis [15] examined two enhancement techniques to improve the parabolic trough solar collector performance. They applied internal fins as well as a reflecting shield and found that the former could always increase thermal efficiency, while the latter was only useful for temperatures above 550 K. Eiamsa-ard et al. [16] applied multiple twisted tape bundle inserts to intensify the heat transfer experimentally. They tested coswirl and counter-swirl strip configurations for six, four, and two pieces of tape with twist ratios of 4.0, 5.0, and 6.0. Their experimental outcomes showed that all bundles of multiple twisted tapes increased heat transfer and the best performance was six twisted tapes with a twisted ratio of 4 with a Reynolds number of 6000.
Deshmukh et al. [17] conducted an experimental study using TiN nanoparticles and twisted tapes. Their experimental data indicated that solar thermal collector efficiency was 98.66% and 71.53% with and without twisted tape, respectively. The results demonstrated that using twisted tape notably decreased the average surface temperature.
According to previous studies, the use of twisted tapes increases the pressure drop which the friction of the surface of them with the passing fluid has a significant contribution in the increased pressure drop. A superhydrophobic surface, typically composed of micro- and/or nanoscale roughness that is chemically treated to be hydrophobic, is a promising and effective way to reduce skin friction [18, 19]. Hydrophobicity is a surface physical property of materials, characterizing the tendency of a material to repel water. This phenomenon minimizes the contact surface between water and nonpolar molecules [20]. After observing the pristine cleanliness of lotus leaves in marshes, extensive research was conducted in this field. Through an examination of 300 types of leaves using an electron microscope, it was observed that surfaces appearing macroscopically smooth exhibit microscopic roughness [21]. The air trapped within the rough surface of these leaves results in water forming droplets with high contact angles, enabling them to roll off and remove dust from the leaf surface. Over the years, numerous researchers have explored the application of surface hydrophobicity modification in various power systems to investigate the impact of hydrophobic phenomena on pressure losses and heat transfer [19, 20]. For instance, experimental results by Forrest et al. [22] revealed that the critical heat transmission amount on a surface with a thin layer of nanoparticles, under similar conditions, was 100%–200% higher than that on a plain surface. The findings from those studies indicated that the phenomenon of dynamic instability was not the sole influential factor, emphasizing the crucial role of surface properties. Shi et al. [23] employed surface oxidation and a chemical method to achieve a hydrophobic surface on metal foam where the mineral foam was partially inserted into the tube, with water serving as the working fluid. Experimental findings indicated that the tube containing hydrophobic metal foam exhibited better performance in pressure losses and heat transfer compared to the metal foam without hydrophobic treatment. In an experimental study conducted by Motamedi et al. [24], it was discovered that slip at the walls decreased the influence of the increased nanofluid viscosity, resulting in an average reduction of 17% in pressure drop relative to a smooth channel. Mandev and Manay [25] conducted experiments with many microchannel heat sinks featuring a variety of surface roughness values of 3.0, 1.8, and 1.1 µm; three varying microchannel widths of 700, 500, and 300 µm; and two different heights of 300 and 450 µm. Their study concluded that increasing the surface roughness increased the Nusselt number.
By reviewing the former studies, it is evident that using the twisted tape inserts has a negative effect on the solar collector performance, as it causes more pressure drop inside the solar collector absorber tube. This article presents the idea of making the surface of the twisted tape hydrophobic. In this way, it is possible to reduce the increment of the pressure losses caused by these tapes while keeping their benefits such as promoting better working fluid mixing and the ability to generate vortices that disrupt the thermal boundary layer. Various twisted tapes with different widths and twist ratios are made and examined experimentally based on pressure drop, efficiency, and performance index in laminar and turbulent flow regimes. Also, the performance of twisted tapes with fixed and variable widths is investigated.
2. Experimental Setup
The present study evaluates the efficiency of the parabolic solar collector with twisted tapes experimentally. To reduce the pressure drop caused by the twisted tapes and improve the solar collector performance, the use of twisted tapes with a hydrophobic surface was researched. The solar collector performance with various twisted tapes was tested at six different values of flow rates of 50, 75, and 100 Lph (laminar flow) and 150, 200, and 250 Lph (turbulent flow). The inlet working fluid temperature in the solar collector was set at 30°C in all experiments. All the experiments were done during the summer and in the city of Tehran with a longitude of 51.39°E and a latitude of 35.69°N.
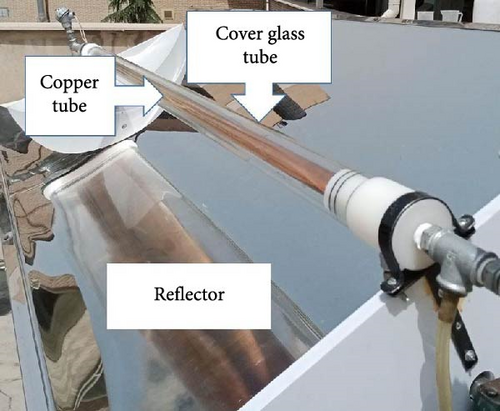
The main components of a parabolic solar collector include a reflector and an absorber tube. The reflector is made of a steel plate. The light-absorbing tube is made of copper where twisted tapes are placed in it. The solar energy is absorbed by the working fluid from the inner walls of the tube. The absorber copper tube is enclosed by a glass tube, and the air is discharged from the space between the two tubes to minimize the loss of energy to the surrounding environment and thus increase the performance of the heating system. The collector also has a medium-density fiberboard (MDF) body to increase its structural strength. Figure 1 shows the parts of a solar collector. Table 1 lists the characteristics of the collector reflector.
| Parameter | Value | Unit |
|---|---|---|
| Reflector width | 0.7 | m |
| Reflector length | 1.5 | m |
| Reflector area | 0.98 | m2 |
| Focal length | 0.175 | m |
| Edge angle | 90 | — |
| Reflection coefficient of the reflector | 0.93 | — |
| Outer diameter of the copper tube | 28 | mm |
| Thickness of the copper tube | 1 | mm |
| Outer diameter of the glass tube | 60 | mm |
| Thickness of the glass tube | 5 | mm |
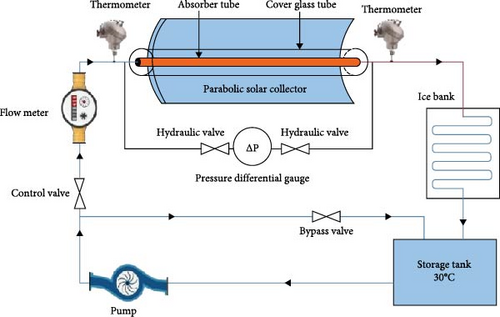
Figure 2 shows the operating cycle of a solar collector. A tank containing water with a low temperature was used to keep the inlet fluid temperature entering the solar collector system constant (30°C). The fluid in the cycle is circulated using a centrifugal pump made by Grundfos UPS2. System performance metrics are measured and recorded using a variety of measurement instruments. The solar power meter (TES model 1333R) measures the solar radiation intensity per unit area. To measure the temperature of the inlet fluid and the outlet fluid, two PT100 thermometers were positioned at the beginning and end of the absorber tube, respectively. To determine the flow rate of the working fluid in the solar collector system, a fan-type flow meter made by ZENNER with a precision of 0.001 Lph is used. The pressure difference between the outlet and the inlet fluid is also monitored with a Yokogawa differential pressure gauge. The device takes 12 V electricity and displays the pressure differential digitally.
3. Preparing Twisted Tape Inserts
Twisted tapes with different widths and twist ratios were examined. A copper plate with a thickness of 1 mm was divided into 12 tapes, each tape 1.5 m in length; nine tapes had a fixed width of 20, 16, and 12 mm; and three tapes had a variable width from 20 mm to zero. Additionally, three twisting ratios (TRs = 9, 7, and 5) were employed. Table 2 lists the variety of twisted tape models.
| Case No. | W | TR | Case No. | W | TR |
|---|---|---|---|---|---|
| Base case ∗ | — | — | Case#7 | 12 | 5 |
| Case#1 | 20 | 5 | Case#8 | 12 | 7 |
| Case#2 | 20 | 7 | Case#9 | 12 | 9 |
| Case#3 | 20 | 9 | Case#10 | Variable (20 mm to 0) | 5 |
| Case#4 | 16 | 5 | Case#11 | Variable (20 mm to 0) | 7 |
| Case#5 | 16 | 7 | Case#12 | Variable (20 mm to 0) | 9 |
| Case#6 | 16 | 9 | — | — | — |
- ∗Bare tube.
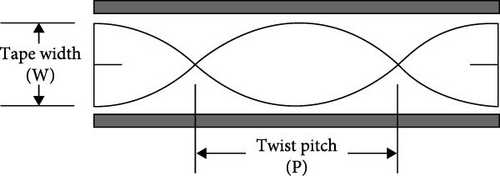
Figures 3 and 4 show a twisted tape with fixed width and variable width, respectively.


Based on the obtained results, the cases with the highest friction coefficient were identified among the fixed-width and variable-width (20 mm to zero) twisted tapes, and similar to these twisted tapes with the same parameters but with hydrophobic surfaces were prepared. The tests were repeated by these samples to determine the difference between the performance of the twisted tapes with a simple surface and the twisted tapes with a hydrophobic surface. Figure 5 shows the twisted tapes with hydrophobic surfaces.

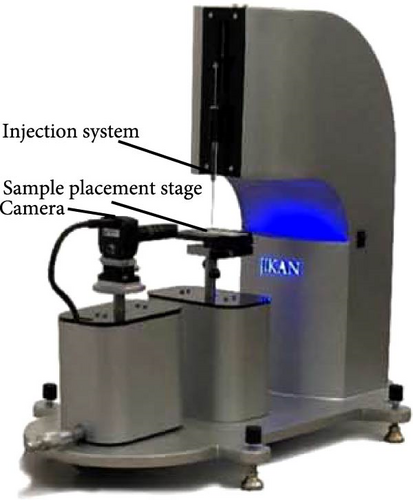
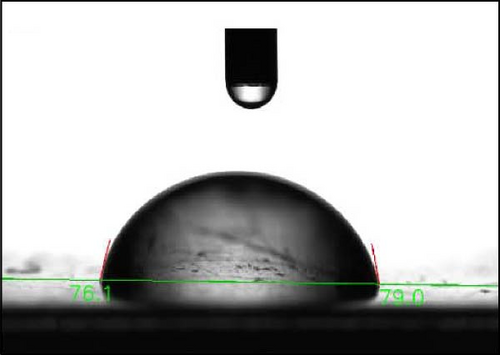
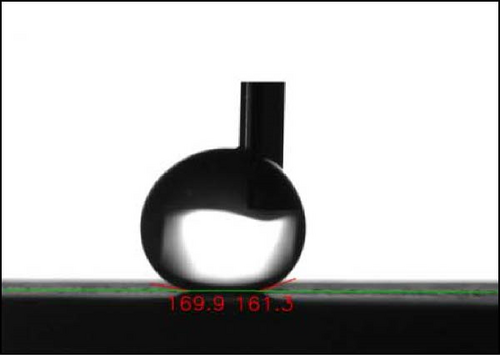
To produce hydrophobic twisted tapes, the twisted tapes were immersed in ethanol for 5 min. The twisted tapes are initially roughened by immersing them in 12 mol/L nitric acid (HNO3) for 5 s, after which they are removed without any delay. They are submerged in a solution of 0.5 mol/L ammonium persulfate (NH4)2S2O8 and 2.5 mol/L sodium hydroxide (NaOH) for 30 min after being cleaned with deionized water and allowed to dry in the air. The twisted tapes were washed with deionized water and then dried in air. After that, the twisted tape samples were stored for 2 days in hexane with a 0.5% (v/v) FAS-17 solution. The twisted tapes are finally dried in an oven set at 240°C for 3 h. A hydrophobic surface is obtained by cooling it in air. Figure 6 shows the production steps of twisted tapes with a hydrophobic surface. The device for measuring the contact angle and the contact angle between the water drop and solid surface in simple and hydrophobic treated surface of the twisted tape is shown in Figure 7. The droplet contact angle was measured with CAG-20 Jikan device. The test was carried out in the environmental conditions of 25°C, 88 kPa pressure, and 33% relative humidity. Distilled water with a density of 997 kg/m3 and a minimum droplet volume of 5 µL was used in the experiment [26].

4. Data Reduction
Ti and To represent the inlet and outlet bulk temperatures of fluid in the absorber tube, respectively, while denotes the mass flow rate of the fluid.
The working fluid is pure water. Based on the above equations, the thermal efficiency and friction coefficient can be calculated using the geometric characteristics of the collector. This involves measuring the inlet and outlet water temperatures in the absorber tube and applying the thermophysical properties of water at the average bulk temperature. Additionally, the incident normal irradiation on the collector and the flow rate must be measured experimentally
5. Uncertainty Analysis
Table 3 shows the uncertainty in the measurement parameters in these experiments.
| Parameter | Uncertainty |
|---|---|
| Temperature | ±0.1 (°C) |
| Solar irradiance | ±5 (W/m2) |
| Pressure drop | ±0.065 (Pa) |
| Length of tube | ±0.001 (m) |
| Flow rate | ±0.01 (Lph) |
According to the uncertainty of the measuring devices in Table 3, the uncertainty of collector thermal efficiency and friction coefficient is 2.9% and 2%, respectively.
6. Time Constant
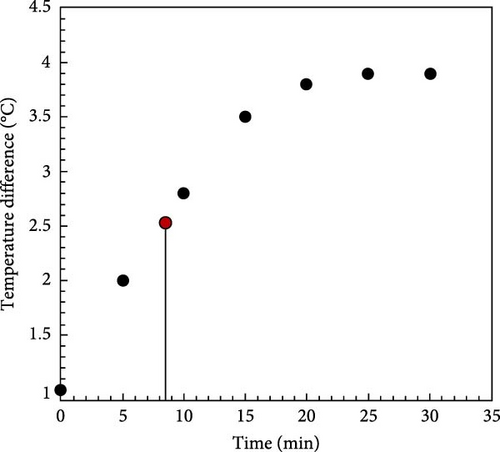
The temperature difference with time is shown in Figure 8, and the collector time constant is calculated to be around 8.5 min based on Equation (8).
7. Results and Discussion
Here, L and d represent the length and diameter of the tube, respectively, Re is the Reynolds number, ρ denotes the fluid density, and u is the average velocity of the fluid within the tube.
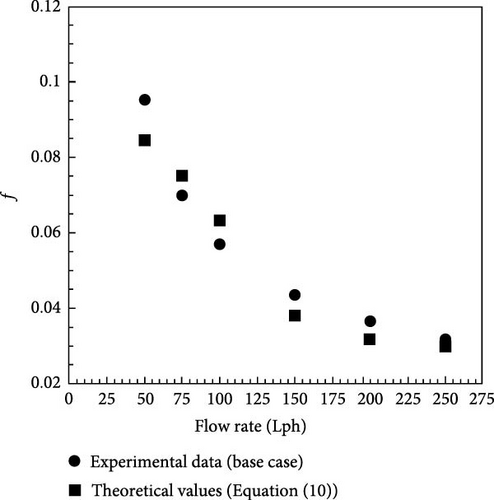
Figure 9 presents a comparison of the theoretical outcomes derived from Equation (9), with the experimental findings. The theoretical and experimental findings are fairly consistent. Also, the repeatability of the tests was checked.
7.1. Pressure Drop
Although the twisted tapes cause fluid mixing and reduce the thermal boundary layer thickness by creating vortices in the flow, they cause an increase in the pressure drop. This section examines how much different geometric shapes affect the pressure change inside the tube.
7.1.1. The Impact of the Width on the Pressure Drop
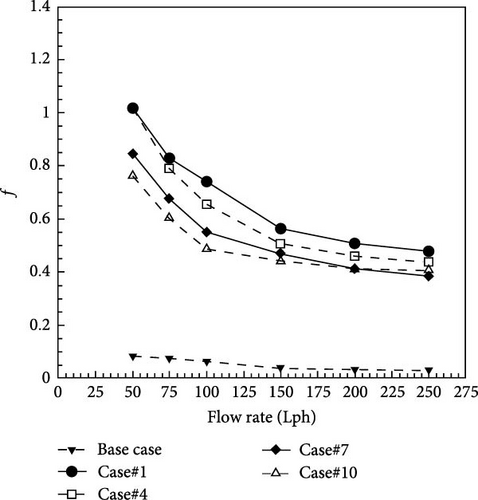
Figure 10 shows the effect of twisted tape width on the friction coefficient. According to the results, the friction coefficient significantly increases when twisted tapes are used because of the rise in pressure drop. At a flow rate of 50 Lph, Case#1 has a friction coefficient of 41.67% higher than the base case. On the other side, the friction coefficient decreases as the flow rate rises. For Case#1, increasing the flow rate from 50 to 250 Lph reduces the friction coefficient by 50%. At a flow rate of 100 Lph, for Cases#1, 4, 7, and 10, the friction coefficient was measured at 0.74, 0.65, 0.55, and 0.49, respectively, and the friction coefficient for the base case was 0.085. Moreover, at a flow rate of 250 Lph for Cases#1, 4, 7, and 10, the friction coefficient was 0.48, 0.44, 0.39, and 0.41, respectively, and the friction coefficient of the base case was 0.03. These findings confirm an increase in the friction coefficient with the widening of the twisted tape. In Cases#1, 4, 7, and 10, which have a fixed twist ratio, the pressure drop decreases as the width of the twisted tape decreases. But in Case#10, due to the variable width of the twisted tape in the flow direction, the lowest pressure drop is seen. At flow rates of 50, 75, and 100 Lph (i.e., laminar flow), by reducing the twisted tape width, the friction between the fluid and the twisted tape decreases, which results in a reduction in the friction coefficient. By increasing the flow rate to 150, 200, and 250 Lph (i.e., turbulent flow), the role of friction between the surface of the twisted tape and the fluid decreases against the pressure drop caused by the turbulent aspects of flow. Therefore, according to the results, the role of tape width in pressure drop is more vital in laminar flow than in turbulent flow.
7.1.2. The Impact of the Twist Ratios on the Pressure Drop
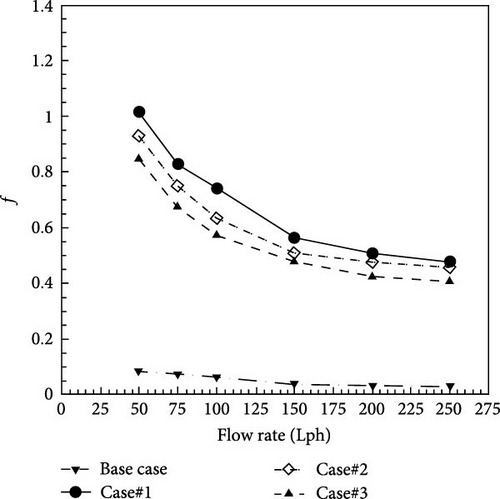
Figure 11 shows the friction coefficient for twisted tapes with varying twist ratios. The findings indicate that a lower twist ratio increases the friction coefficient. At flow rate of 50 Lph, for Cases#1, 2, and 3 with a constant width of 20 mm and twist ratio of 5, 7, and 9, the friction coefficients are 1.015, 0.93, and 0.85, respectively. Figure 11 displays that in laminar flow, the fluctuation of the friction coefficient is greater than in turbulent flow.
7.1.3. Effect of Hydrophobicity on Pressure Drop
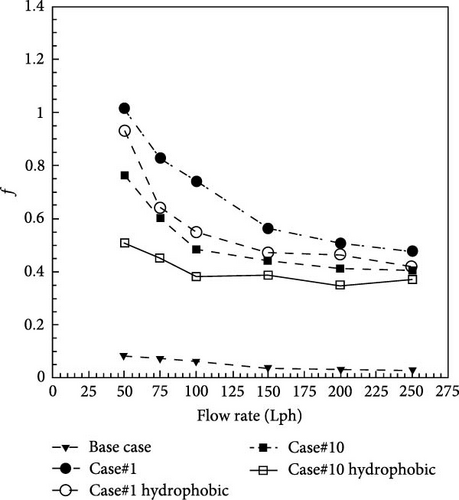
Figure 12 shows the difference in the friction coefficient between twisted tapes with a normal surface and twisted tapes with a hydrophobic surface at varying flow rates. The previous findings showed that the twist tapes with the largest width (i.e., 20 mm) and the lowest twist ratio (i.e., 5) have the maximum pressure drop (Case#1). Also, in the twisted tapes with variable width, Case#10 with a width of 20 mm and a twist ratio of 5 have the highest pressure drop. Therefore, these samples were made with the same sizes, and their surface was made hydrophobic by the previous described method. Twisted tapes with a hydrophobic surface were tested to compare the results. The results show that in Case#1, at a flow rate of 50 and 250 Lph, by using hydrophobic surfaces, the friction coefficient was reduced by 8.3% and 12%, respectively. Also, in Case#10, at a flow rate of 50 and 250 Lph, by using hydrophobic surfaces, the friction coefficient was reduced by 34.2% and 7.5%, respectively. It can be seen that the pressure drop reduction in laminar flow is more than in turbulent flow. This is because in laminar flow, the frictional pressure drop between the fluid and surfaces is dominant, and with the hydrophobicity of the twist tapes, a further decrease in pressure drop in laminar flow is observed. These results show that the use of the hydrophobic surface of the twist tapes can reduce the frictional losses between fluid and tape insert.
7.2. Collector Thermal Efficiency
This study examines the thermal efficiency of solar collectors while utilizing bare tubes and tubes with twisted tape. Thermal efficiency is defined as the ratio of the energy absorbed by the fluid to the total normal direct radiation energy incident to the collector aperture.
7.2.1. The Effect of Width on the Collector Efficiency
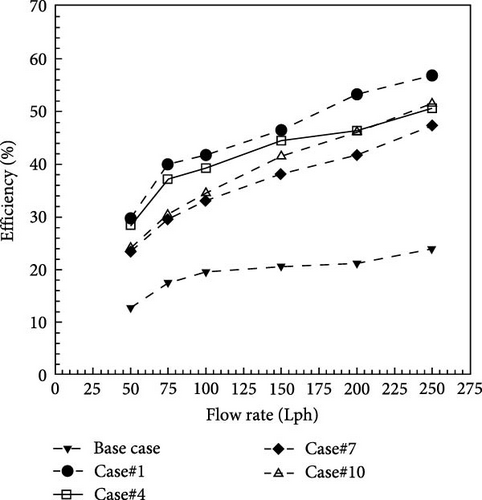
The effect of using twisted tape with different widths on solar collector efficiency is shown in Figure 13. The findings show that increasing the width of the twisted tape leads to an enhancement in the collector’s efficiency. According to Figure 13, Case#1 with the largest width has the highest efficiency in the constant twist ratio. In Figure 13, the efficiency reduces as the width of the twisted tape decreases. Also, Case#10 with variable width performs better than Case#7. Since the thickness of the thermal boundary layer is low in the entrance area of the pipe and the fluid flow is under thermal developing conditions, proper heat transfer is carried out. But along the length of the pipe, with the increase in the thickness of the thermal boundary layer, the heat transfer is reduced; therefore, by increasing the width of twisted tape (Case#10) and creating more powerful vortices, it is possible to create better performance than the twisted tape with a fixed width (Case#7). The results show that in Case#1, at a flow rate of 50 and 250 Lph, the collector efficiency was increased by 233.4% and 237.5%, respectively.
7.2.2. The Effect of the Twist Ratio on the Collector Thermal Efficiency
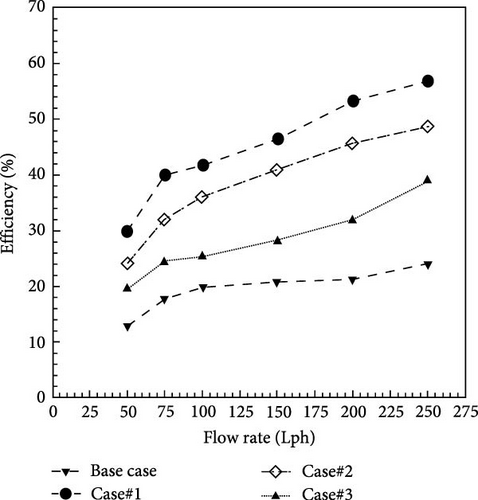
The effect of the twist ratio on solar collector efficiency is seen in Figure 14. The experimental results show that a lower twisted ratio generally improves the twisted tape performance and thus increases the efficiency of the solar collector. In twisted tapes with a fixed width, reducing the twist ratio further increases the solar collector efficiency. Experimental results show that Case#1 is more effective than Cases#2 and Cases#3, where the efficiency of each of them was equal to 29.79, 24.04, and 19.38, respectively. Also, Case#2 is more effective than Case#3. In Case#1, at a flow rate of 50, 75, 100, 150, 200, and 250 Lph, the collector efficiency was increased by 233.4%, 227.2%, 211.6%, 225.2%, 252.4%, and 237.5% compared to the base case, respectively.
7.2.3. The Effect of Hydrophobicity on the Collector Efficiency
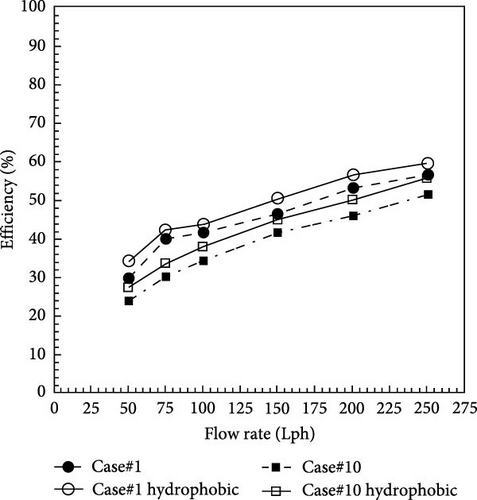
The experimental results showed that Case#1 among the twisted tapes with fixed width and Case#10 among the twisted tapes with variable width have the highest pressure drop. Therefore, these tapes were made with the same sizes, and their surface was made hydrophobic by the previously described method. After retesting the models with hydrophobic surfaces, the solar collector efficiency increases slightly. Figure 15 shows that the surface hydrophobicity of the twisted tapes could increase the efficiency of the solar collector by up to 4% in both laminar and turbulent flow regimes.
7.3. Performance Index
The performance index defined in Equation (5) can simultaneously evaluate the pressure drop and thermal energy absorbed by the fluid to choose a twisted tape with proper performance. Therefore, the proper design of the twisted tape leads to a higher performance index. Generally, the findings show that the performance index is highly affected by the width, twist ratio, flow rate, shape of the tape (fixed or variable width), and surface properties of the twisted strips. In the following, the twisted tapes are analyzed and compared according to tape width, twist ratios, and surface properties.
7.3.1. The Effect of Width on the Performance Index
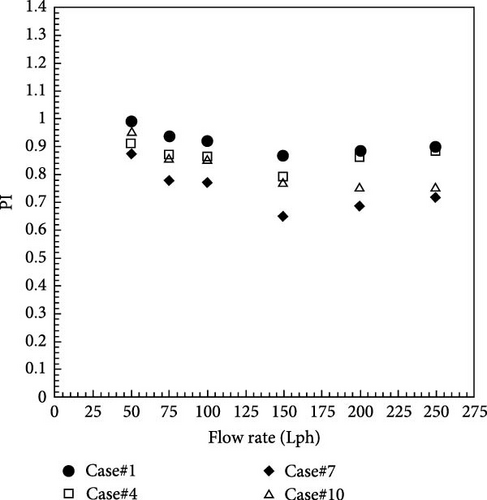
The impact of the width of the twisted tapes on the performance index was investigated by keeping the twist ratio of the twisted tapes constant. Figure 16 shows the impact of the width of the twisted tapes on the performance index. By increasing the twisted tape width, the performance index is improved. Furthermore, constant or variable tape width can have a significant effect on the performance index. The performance index of Case#10 with variable width is higher than Case#7 with fixed width. According to Figure 16, twisted tapes perform better in laminar flow than in turbulent flow. Because in the turbulent flow, the interaction between the fluid and the pipe is naturally high, and the role of using the twisted tape is less.
7.3.2. The Effect of the Twist Ratio on the Performance Index
By keeping the width of the twisted tapes constant, the effect of the twist ratio of the twisted tapes on the performance index was inspected. The twisted tapes with twist ratios of 5, 7, and 9 were employed for the experiments. According to Figure 17, it was found that the twist ratios are an important and influential factor in the solar collector performance. Thus, as the twist ratio is decreased, the performance index of the solar collector is increased. At a flow rate of 50 Lph, Case#1 has a better performance index than Case#2 and Case#3 by 1.25% and 1.4%, respectively. Also, twisted tapes have a higher performance index in laminar flow than in turbulent flow.

7.3.3. The Effect of Hydrophobicity on the Performance Index
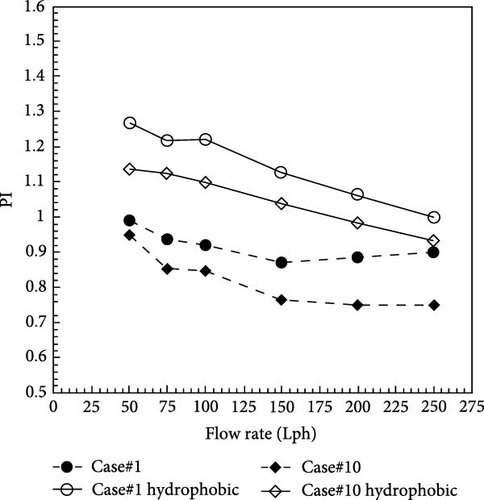
One of the challenges in the performance of solar collectors equipped with twisted tapes is the increased friction between the fluid and the surface of the twisted tapes, which leads to an increase in the pressure drop. This paper proposes hydrophobic twisted tapes to solve this challenge. To investigate the hydrophobic effect of the surface of twisted tapes on the performance index, the twisted tape with a fixed width of 20 mm and a twist ratio of 5 with the highest friction coefficient among the fixed width twisted tapes was selected. A similar twisted tape was made with the same dimensions but with a hydrophobic surface. At the flow rate of 50 Lph, the performance index of the twisted tape with a hydrophobic surface increases by 125%. Similarly, the variable width twisted tape with a twist ratio of 5 with the highest friction coefficient among the variable width twisted tapes was selected. Then a similar twisted tape was made with the same dimensions but with a hydrophobic surface. At a flow rate of 50 Lph, the performance index of the variable width twisted tape with a hydrophobic surface increases by 143%. According to Figure 18, the hydrophobicity of the surface of the twisted tape increases the performance index to more than one.
The findings of this research are in good agreement with the findings of the experimental study on the effect of the twist ratio on heat transfer [32], the impact of the width of the twisted tape on heat transfer [33], and the effect of the width of fixed and variable width twisted tapes on heat transfer [34]. However, in the current research, it was found that the use of twisted tapes with a hydrophobic surface can increase the performance index to more than one.
8. Conclusion
- •
The use of twisted tapes with a lower twist ratio leads to increased pressure drop, efficiency, and performance index in the solar collector. To mitigate the pressure drop, twisted tapes with variable width can be employed.
- •
The use of twisted tapes with a larger width results in a higher pressure drop, improved efficiency, and performance index in the solar collector. In this case, twisted tapes with a hydrophobic surface can be used to reduce the pressure drop.
- •
Twisted tapes with variable width can lead to a lower pressure drop and higher efficiency and performance index than twisted tapes with fixed width in the solar collector.
In conclusion, the use of twisted tapes with a hydrophobic surface is demonstrated to reduce pressure drop while improving the performance index of the solar collector. Based on these findings, hydrophobic twisted tapes are proposed as a promising strategy for enhancing solar collector performance. Further research is recommended to explore the second law of thermodynamics, including exergy and entropy generation analyses, in solar collectors equipped with hydrophobic twisted tapes, alongside an assessment of their environmental impact. Finally, the authors propose the potential application of surface hydrophobicity to reduce pressure drop and enhance the performance of thermal systems as a broader aspect for future research.
Nomenclature
-
- Ac:
-
- Collector area (m2)
-
- cp:
-
- Thermal capacity (J/(kg·K))
-
- Di:
-
- Inner diameter of the absorber tube (m)
-
- f:
-
- Friction factor (−)
-
- f0:
-
- Friction coefficient of the fluid without insert (−)
-
- I:
-
- Radiation intensity (W/m2)
-
- L:
-
- Length of the absorber tube (m)
-
- :
-
- Flow rate (kg/s)
-
- P:
-
- Twist pitch (m)
-
- PI:
-
- Performance index (−)
-
- Δp:
-
- Pressure drop (Pa)
-
- Q0:
-
- Heat absorbed by the working fluid without insert (W)
-
- Qu:
-
- Heat absorbed by the working fluid (W)
-
- Qs:
-
- Heat flux of the sun (W)
-
- Ti:
-
- Inlet temperature (K)
-
- To:
-
- Outlet temperature (K)
-
- Toi:
-
- Outlet temperatures at each time step (K)
-
- Tos:
-
- Steady-state outlet temperature (K)
-
- TR:
-
- Twist ratio (−)
-
- U:
-
- Uncertainty
-
- u:
-
- Fluid velocity (m/s)
-
- W:
-
- Tape width (m)
-
- ρ:
-
- Density (kg/m3)
-
- ηth:
-
- Thermal efficiency of solar collector (−).
Conflicts of Interest
The authors declare no conflicts of interest.
Author Contributions
Ali Ismail Al-Shiblawi: data curation, formal analysis, resources, validation, writing–original draft. Mohammad Mahdi Heyhat: conceptualization, methodology, resources, supervision, writing–review and editing. All authors have read and agreed to the published version of the manuscript.
Funding
This research received no external funding.
Open Research
Data Availability Statement
The data presented in this study are available in this article.


