Potential Energy Generation of Photovoltaics With Acceptable Risk at Korean Airports
Abstract
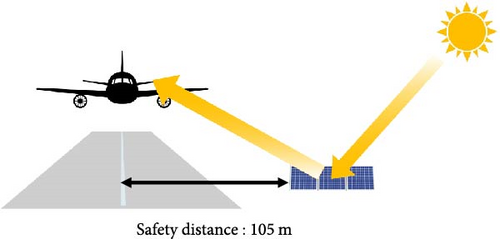
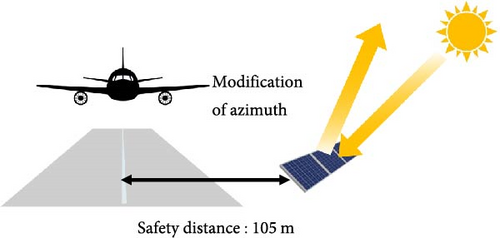
The aviation industry is adopting renewable energy sources to reduce greenhouse gas emissions. One of the strong candidates to meet the energy demand of airports with a sustainable way is photovoltaic (PV) systems. This paper systematically assesses the potential risk and energy generation capabilities of installing PV at nine Korean airports. It was found that the risk of PV, particularly concerns about glare and severity of collision accident, is lower than other renewable energy sources. These remaining safety issues of PVs can be mitigated to acceptable levels by maintaining a safe distance from aircraft routes (105 m) and rotating them to face opposite possible routes. The safety management of airport PV ensures to utilize glare-free solar energy harvesting systems throughout the year. Under this safe scenario, the estimated energy generation would be 1.78 ± 0.17 times higher than the energy demand of the airports. Notably, the surplus energy generation by PVs located at smaller airports can offset energy demand of larger international airports. The estimated levelized cost of energy for PVs with acceptable risk is 64.7 ± 0.1 $/MWh, lower than the cost of energy supplied by an external source (103.4 ± 32.7 $/MWh). These findings suggest that PV installations with acceptable risk can significantly contribute to the energy self-sufficiency and sustainability of airports in South Korea.
1. Introduction
Climate change is the most significant challenge currently facing humanity, prompting industrial sectors to prioritize the reduction of CO2 emissions. In 2022, the aviation industry accounted for only 2% of global CO2 emissions, yet its emissions have grown faster in recent decades than other types of transportation [1–3]. To combat climate change and achieve sustainability, the International Air Transport Association has set an ambitious goal of creating a carbon-free aviation industry by 2050 [4–6]. In pursuit of this objective, the aviation sector is increasingly adopting nonhydrocarbon-based fuels, such as hydrogen and electric batteries, to reduce its reliance on fossil fuels. Concurrently, airports worldwide are exploring the implementation of renewable energy sources to enhance their sustainability and self-sufficiency [7–9]. Several studies have demonstrated that photovoltaic (PV) systems, wind power, geothermal power, and hydrogen fuel can meet the energy demands of airports [10–22], which has inspired many airport authorities to aim for carbon-free operations. For instance, the Korea Airports Corporation (KAC) plans to replace fossil fuels at Korean airports with renewable energy sources by 2040.
Despite these efforts, progress toward sustainable airports has been slower than in other transportation sectors due to safety concerns. For example, renewable energy sources such as PVs are easily installed along roadsides for land transport, and offshore wind turbines can be positioned near ports for maritime transport [23–28]. The energy generated from these renewable energy sources can then be utilized to power vehicles and ships. Similarly, airports possess vast areas around their runways suitable for installing renewable energy systems. The open spaces in the airport, free from obstructions that could block sunlight and wind, are ideal for PV and wind power installations [18, 29]. In the United States, the potential energy generation from PV installation on unused airport land has been estimated to be 39 times higher than the energy consumption of the airports themselves [10]. Moreover, rooftop PVs on airport terminals and parking lots in eight Chinese provinces could sufficiently meet the energy needs of the aviation industry [7]. By 2050, airport PV is projected to become a multibillion-euro industry [30]. However, airport authorities are reluctant to install renewable energy sources onsite due to the increased risk of collisions and catastrophic accidents. PVs near airports can increase glare, posing a threat to aircraft during landing and takeoff. Furthermore, height restrictions on structures around airports limit the feasible deployment site of wind turbines. Time-varying renewable energy sources also require electrical or chemical energy storage systems [31–33], which pose a fire and explosion hazards [34–36]. Despite some pioneer works conducted risk assessments of renewable sources at a specific airport, the lack of comparison between the risk of renewable sources lags behind the installation of renewable sources [18, 29]. Consequently, many airport authorities prefer to engage in power purchase agreements to buy renewable energy from external sources rather than directly generating electricity onsite [37, 38].
Thus, quantifying the risk associated with renewable energy sources and their potential energy generation is imperative for promoting their onsite installation at airports. Accurate risk assessments will provide essential information to airport authorities, aiding in the identification of feasible renewable energy sources. Although some previous studies have suggested that carbon-free airports can be achieved with minimal risk, the lack of comprehensive nationwide studies has hindered the establishment of policy guidelines for sustainable airports [12, 39, 40]. Especially, most previous papers focused on calculating the energy generation from renewable sources at individual airports [11, 12, 17, 19]. While this approach has been helpful for designing self-sustainable individual airports, the possibility of achieving self-sustainable at a national level is still ambiguous. In contrast, national studies on renewable energy sources have not intensively accounted for safety-related issues specific to airport and flights [41]. Consequently, the results from these studies cannot be directly applied to airport cases. Moreover, a relationship between energy self-sufficiency ratio and size of airport remains unclear. Energy generation potential might vary among airports depending on their sizes, requiring different strategies to meet their energy demand through renewable sources. Approaches for small-, medium-, and large-sized airports must differ, and a general strategy should be suggested based on achievable energy generation from nonrisky renewable sources and their general energy demands. Additionally, there is still uncertainty over the tradeoff between maximizing potential energy generation and minimizing safety risk for installing renewable energy sources at airports. Despite several case studies conducted at each airport, a universal design rule for renewable energy sources, considering both safety and estimated energy generation capacity, has not been established yet.
Therefore, this study aims to conduct a systematic risk assessment for the onsite PVs at nine Korean airports. This study focuses on three main aspects: comparing the risk of PV relative to other renewable energy sources, determining the optimal installation scenario in terms of risk and potential energy generation, and analyzing the cost of energy associated with optimal safe installation scenario. The comprehensive case study at nine Korean airports shown in this work enables us to establish a strategy for realizing eco-friendly airports, which is also valid in other airports in similar latitudes. We believe that the results presented here will help to determine how much onsite PVs contribute to achieving carbon-free airports.
2. Methodology
2.1. Risk Assessment of Renewable Energy Sources in Airport
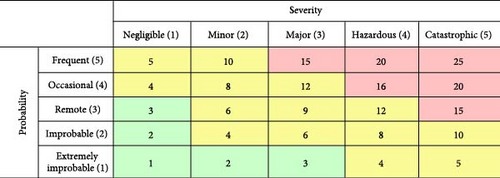
For most airports, potential renewable energy sources for onsite installation include hydrogen fuel, biomass, geothermal power, wind power, and PV [10–18]. In this study, biomass and geothermal power were excluded from consideration owing to the CO2 emissions or geographic limitations. Therefore, the risks of hydrogen fuel, wind power, and PV were compared. The International Civil Aviation Organization (ICAO) categorizes the risk to facilities and activities at airports by using five levels [41]. As given in Table 1, the probability of a risk is classified considering its frequency, ranging from extremely improbable (level 1) to frequent (level 5). Table 2 defines the severity of a risk according to the consequences of an accident, from negligible (level 1) to catastrophic (level 5). Figure 1 presents a risk assessment matrix, which combines probability and severity to evaluate risk levels. This risk assessment matrix helps to determine whether a risk is intolerable (red), tolerable but requiring risk management (yellow), or acceptable (green). It is desirable that risks associated with the onsite installation of renewable energy sources fall within the acceptable.
| Probability | Meaning | Level |
|---|---|---|
| Frequent | Likely to occur many times | 5 |
| Occasional | Likely to occur sometimes | 4 |
| Remote | Unlikely to occur, but possible | 3 |
| Improbable | Very unlikely to occur | 2 |
| Extremely improbable | Almost inconceivable that the event will occur | 1 |
- Abbreviation: ICAO, International Civil Aviation Organization.
| Severity | Meaning | Level |
|---|---|---|
| Catastrophic | Equipment destroyed/multiple deaths | 5 |
| Hazardous |
|
4 |
| Major |
|
3 |
| Minor |
|
2 |
| Negligible | Few consequences | 1 |
- Abbreviation: ICAO, International Civil Aviation Organization.
2.2. Risk Assessment and Energy Generation of Airport PV Under Three Scenarios
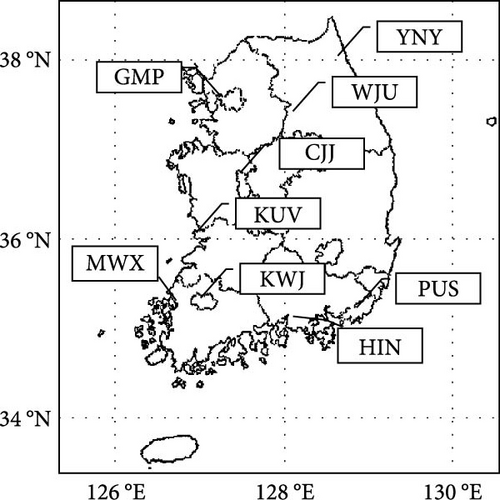
This study evaluated potential energy generation and collision risk associated with PVs at nine Korean airports: Yangyang (Yangyang International Airport [YNY]), Gimpo (Gimpo International Airport [GMP]), Wonju (Wonju Airport [WJU]), Cheongju (Cheongju International Airport [CJJ]), Gunsan (Gunsan Airport [KUV]), Gwangju (Gwangju Airport [KWJ]), Gimhae (Gimhae International Airport [PUS]), Sacheon (Sacheon Airport [HIN]), and Muan (Muan International Airport [MWX]). These airports are located between latitudes 33 and 38°N and longitudes 125 and 131°E. Figure 2a illustrates the location of these airports, and Table 3 provides their detailed information. Based on the latitudes of the airports, the elevation angle of PV was fixed at 30°. The capacity of each airport is summarized in Table 3.
| Airport | Annual capacity | Possible installation site (m2) | |||
|---|---|---|---|---|---|
| Flight | Passenger | Cargo (tons) | S1 | S2 and S3 | |
| HIN | 1490 | 189,778 | 475 | 1,560,927 | 614,269 |
| KUV | 1124 | 172,939 | 880 | 750,018 | 354,183 |
| WJU | 1379 | 205,279 | 1080 | 573,991 | 246,038 |
| KWJ | 13,277 | 2,050,378 | 9549 | 1,704,068 | 835,730 |
| YNY | 1233 | 158,848 | 1417 | 668,299 | 292,896 |
| MWX | 1484 | 233,337 | 2724 | 1,017,227 | 550,348 |
| CJJ | 22,547 | 3,695,812 | 20,724 | 1,508,539 | 595,399 |
| PUS | 82,185 | 13,694,710 | 113,703 | 1,228,470 | 552,377 |
| GMP | 134,560 | 23,424,158 | 185,570 | 616,628 | 276,956 |
- Abbreviation: PV, photovoltaic.
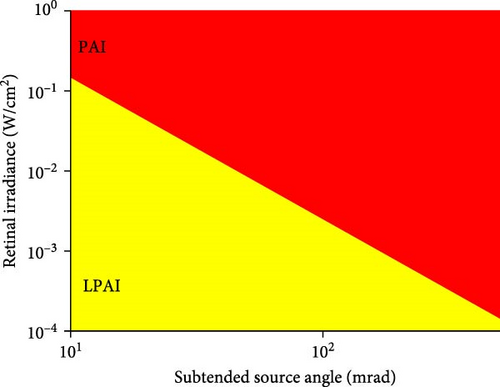
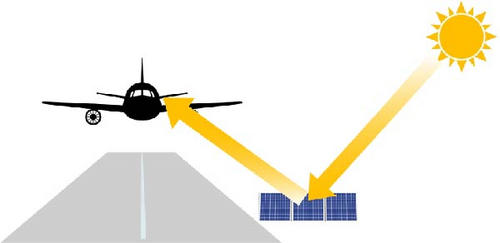
The collision risk from glare caused by onsite PV was quantified using the Solar Glare Hazard Analysis Tool (SGHAT), which interacts with a web-based map to retrieve data such as the annual solar irradiance, latitude, longitude, and altitude [12, 13, 42]. It is assumed that reflection of direct normal incident light by PVs mainly cause glare to pilots and workers near an airport. The glare from PVs was calculated in terms of the light intensity at their retina and subtended source angle of reflective surface. Glare with a weak intensity (<10−4 W/m2) or small subtended source angle (<1 mrad) would not disturb the pilots, so the collision risk would not be affected by PVs (not shown in Figure 2b). In contrast, strong intensity with a large subtended source angle would result in increased the collision risk by introducing an afterimage for pilots and ground workers, making them difficult to perceive their surroundings for 4–12 s [43, 44].
As shown in Figure 2b, the possible after image occurrence time can be categorized into two domains in the simulation program: potential after image (PAI) and low potential of after image (LPAI). If the intensity of reflected light at pilot’s retina is high and subtended angle is large at a specific time, it is defined as a PAI. Conversely, times with reduced light intensity and a small subtended angle are defined as LPAI, as indicated in Figure 2b. The PAI and LPAI occurrence times for pilots at each point of runway and flight routes were calculated for specific PVs throughout the year. This calculation was repeated for all possible PV installation sites to derive total annual glare time (TSG), defined as the sum of annual PAI and LPAI occurrence time.
Finally, the risk of airport PV due to glare was assessed for three different scenarios, as shown in Figure 2c–e. In the first scenario (S1), it was assumed that south-facing PV was installed across the entire airport except for the terminals, runway, taxiway, and aprons, to maximize daily average energy generation from PV (EPV). In the second scenario (S2), the installation direction of airport PV is maintained south-facing, but the possible installation site is limited following the ICAO’s safety regulations [45]. The safety distance of PV is 105 m from the center of the runways in the S2. This might lead to reducing EPV by limiting the possible PV installation site but contribute to safety by decreasing collision-associated risk. Adjustment in the azimuthal angle of PV is carried out in the third scenario (S3) based on our previous study results showing that modifying the azimuthal angle can greatly decrease TSG [13]. Here, it is assumed that the installation site of PV in the S3 is the same as that of the S2.
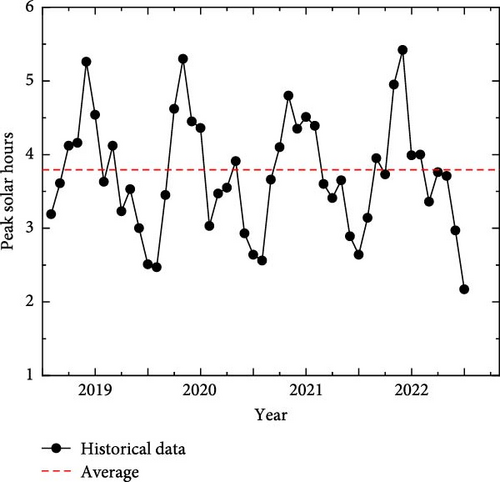
The EPV was estimated from the potential installation area at each airport and the average monthly peak solar hours of field-installed PVs (2019–2023), as shown in Figure 3a. The average annual peak solar hours of field-installed PV are 3.72 ± 0.03. Despite the large distribution of peak solar hours, its pattern has been similar for 4 years. To calculate monthly EPV, it was assumed that the monthly EPV of airport PV follows the distribution of historical data. Meanwhile, airport PV will generate more power than field-installed ones since they are almost shading free. Thus, the average annual peak solar hours were assumed as 4.0 ± 0.04 for south-facing airport PVs, and airport PV was assumed to generate 100 W/m2 [46, 47]. For instance, 100,000 m2 of south-facing airport PV would generate 40 ± 0.4 MWh of EPV ( = 100 W/m2 × 100,000 m2 × 4.0 ± 0.04 h).
2.3. Cost Analysis of the Airport PV With Acceptable Risk
3. Results and Discussion
3.1. Risk Assessment of Renewable Energy Sources in Airport
Figure 4 shows the risk of collision and fire associated with installing renewable energy sources at airports. Wind power significantly increases the collision risk to an unacceptable level. Although careful site selection can mitigate the collision risk, fragments from damaged blades can travel up to 1.6 km, potentially endangering nearby aircraft [18, 57–59]. Moreover, wind turbines might cause turbulence, interfering with flights. Consequently, both the probability and severity of collision risk for wind turbines are very high (level 5). The probability of fire risk in wind power is low (level 1) due to frequent monitoring and fire protection equipment [60, 61]. However, if a wind turbine catches a fire, extinguishing it is almost impossible due to the height of the turbine, leading to a high severity of fire risk (level 4). Thus, wind power is not recommended for onsite installation because of the overall high risk (risk assessment matrix: 29 = 5 × 5 + 1 × 4).
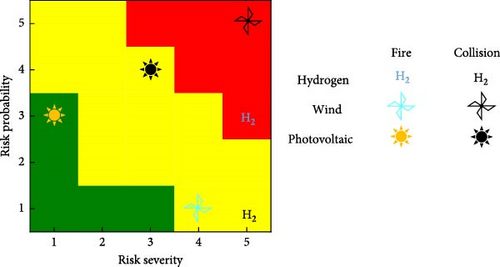
Next, hydrogen fuel cells, typically generating hydrogen offsite, can produce large amounts of electricity within a limited area without emitting CO2 [62–64]. However, they pose a high fire risk because of their low minimum ignition energy (0.018 mJ), fast burning velocity (2.7 m/s), and broad explosive concentration range (4–75 vol%) [65–68]. Accidental hydrogen leaks, being highly pressurized and invisible, would spread over large areas at a high velocity [69–71]. Although stringent safety monitoring systems decrease the probability of fire risk (level 3) for hydrogen fuel cells [72], the severity of an accident is considered catastrophic (level 5). Besides, the collision risk between aircraft and hydrogen storage tanks would have catastrophic severity (level 5) because of a massive hydrogen explosion [73, 74]. However, placing hydrogen tanks far from runways reduces the collision risk probability to extremely improbable (level 1). Considering these factors, fire-related safety issues mitigate the onsite installation of hydrogen fuel cells (risk assessment matrix: 20 = 3 × 5 + 1 × 5).
Lastly, PVs exhibit low risk compared to others. The fire risk associated with PVs is low while the collision risk primarily arises from glare affecting pilots and workers near the runway. PVs comprise low-height panels covering a large area near runways, making the risk of potential damage from direct collision relatively low. Additionally, PVs have negligible communication interference and minimal impact on the physical penetration of airspace [10, 75]. However, glare is generated over a wide area because of a refractive indices difference between air and cover glass of PV panels [76]. The glare increases the probability of the collision risk (level 4), but the severity is not so critical (level 3) because the copilot and auto-flight modes, which are not affected by a glare from PV, can help prevent accidents. Furthermore, a collision between an aircraft and a PV panel would not result in serious damage to passengers and crew due to its low height. Meanwhile, the fire risk can be suppressed by using flame-retardant components [77, 78]. Although fire-related PV issues, such as current mismatch among PV cells, poor insulation of electrical components, and abrupt changes in the current direction, may elevate its temperature and increase its fire probability (level 3), the panels mainly consist of fire-protective polymers, glasses, and silicone [79–82]. Since any fire would not actively spread out, the severity of a fire is considered negligible (level 1). Thus, on-site installed airport PV poses the lowest risk in terms of collision and fire (risk assessment matrix: 3 × 4 + 1 × 3 = 15).
The above risk assessment indicates that PVs are the most suitable renewable energy sources for onsite installation at airports. Thus, PV is preferred for achieving self-sustainable and eco-friendly energy in the airport. The remaining challenge for PV is to reduce the probability of collision risk caused by its glare to an acceptable level. Hence, this study analyzed the collision risk of PV and estimated the possible EPV under different installation scenarios.
3.2. Risk Assessment of Airport PV Under Three Scenarios
The risk assessment and possible EPV of airport PVs were conducted at nine Korean airports under three installation scenarios. For example, Figure 5 shows the PV installation areas at the YNY under the S1, S2, and S3. A runway can be used from both sides depending on the weather conditions in the YNY. The green line represents a 2-mile (3.2 km) flight path (FP) required for taking off and landing, while the yellow dashed line shows the runway and taxiway. Boxes with diagonal patterns represent PV installation areas in the S1 and S2. In those scenarios, the PV panels face southward to maximize EPV. In the S3, the PV panels face the opposite direction of the runway to reflect incident light outside the airport. Our previous work indicated that the glare from airport PV panels could be mitigated by adjusting their azimuthal angle to the opposite of possible runways and FPs without significant loss of EPV [13]. Following the previous research, the optimal azimuthal angle for airport PV is determined in the S3. For example, it is desirable PV panels installed on the east side of the runway face southeast, while PV installed on the west side of the runway face southwest. PV panels on the east side of the runway do not cause pilots to glare when the azimuthal angle is more than 45° from the south. An azimuthal angle larger than 45° would also be effective for mitigating glare from the PV panels, but it would increase EPV losses. Similarly, southwest facing PV panels installed west side of the runway lead to decreased TSG. Therefore, the optimal azimuthal angle of PVs located near the runway is 45° from the south to maximize EPV while minimizing TSG in the YNY.
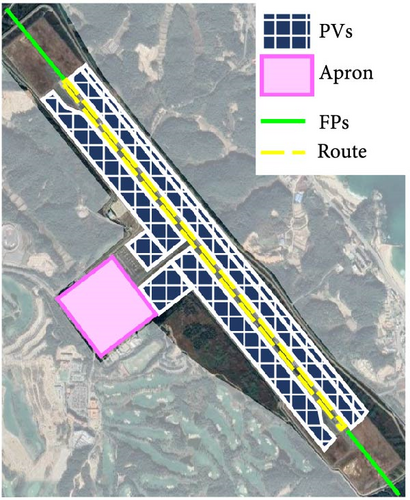
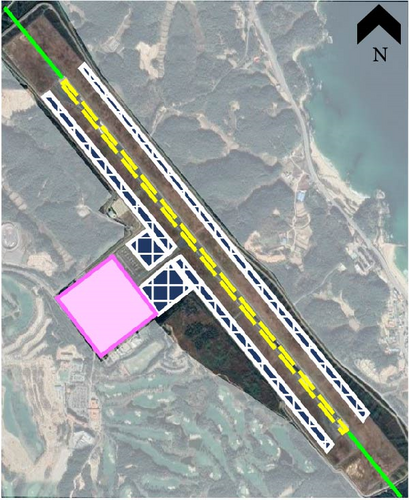
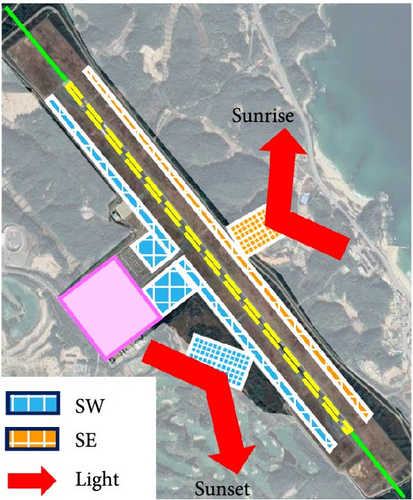
To verify the versatility of the glare reduction method, the same analysis was repeated for the other eight airports (Figures S1–S8). Additionally, it was applied to other foreign international airports located at similar latitudes: Narita International Airport (NRT) in Japan, King Khalid International Airport (RUH) in Saudi Arabia, Murcia International Airport (RMU) in Spain, and Dalaman International Airport (DLM) in Turkey (Figures S9–S14).
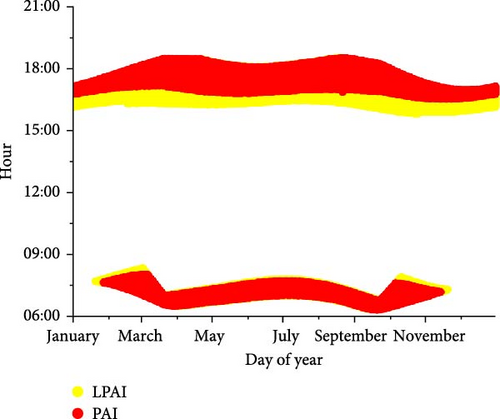
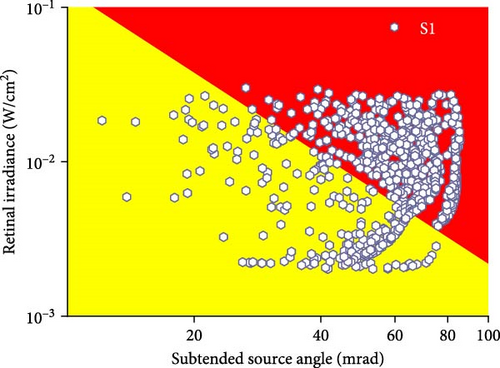
Figure 6 shows the glare analysis for airport PVs at the YNY under different scenarios. In the case of S1, TSG is estimated as 952 h. The detailed procedure to calculate the TSG is explained in Figure S15. Assuming the PV panels face southward to maximize EPV, incident light reflects from PV on the east side of the runway to potential FPs in the early morning and from the west side of the runway in the late afternoon. Thus, glare occurs in the morning and evening throughout the year, with sufficiently high intensity to provoke PAI and LPAI, as shown in Figure 6a,c. To quantify the effect of glare on the probability of collision risk, the probability of collision risk is categorized based on TSG following the European guidelines [33]. If TSG exceeds 730 h (2 h/day), the probability of collision risk is defined as occasional (level 4). The collision risk is defined as remote (level 3) when TSG lies between 365 and 730 h. For TSG below 365 h per year, the risk is improbable (level 2). When TSG is 0–30 h, the probability of collision risk is extremely improbable (level 1). Thus, for the S1, the probability of collision risk is assessed as occasional (level 4) in the YNY, as marked in Figure 6c and Table 4. Accidents during takeoff or landing would likely result in aircraft crashing into PV panels at high speed, leading to the severity of collision risk as major. Despite high energy production (267.3 MWh/day) from a vast installation area of 668,299 m2, the increased collision risk makes the S1 less favorable in the YNY.
| Airport | HIN | KUV | WJU | KWJ | YNY | MWX | CJJ | PUS | GMP |
|---|---|---|---|---|---|---|---|---|---|
| S1 | 523.8 | 223.4 | 2064.5 | 560.3 | 952.5 | 304.5 | 612.2 | 250.5 | 790.5 |
| S2 | 278.5 | 61.8 | 285.5 | 270.5 | 351 | 164.9 | 308.7 | 103.8 | 410.3 |
| S3 | 0.0 | 0.0 | 0.0 | 0.0 | 0.0 | 0.0 | 0.0 | 0.0 | 0.0 |
- Abbreviation: PV, photovoltaic.
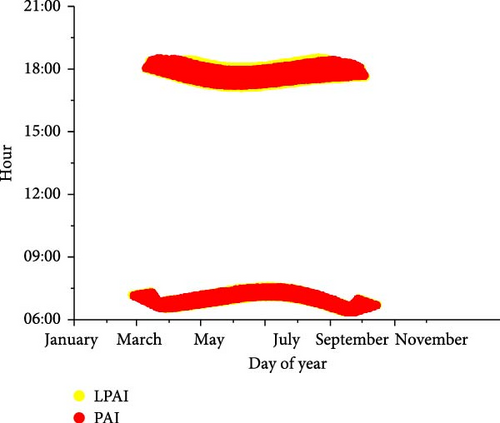
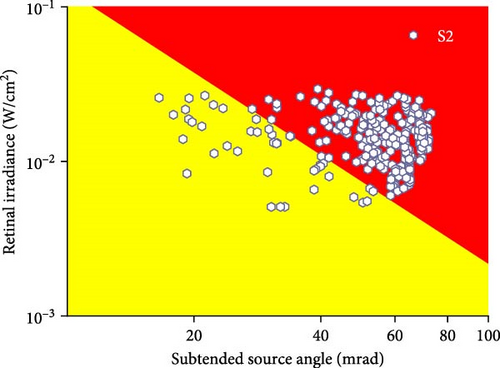
In the case of S2, the PV panels still face southward but a safety distance from the runway is maintained. The installation area is reduced to 292,896 m2 (44% of the S1), resulting in a proportionally decreased EPV (117.2 MWh/day). But, the TSG of PVs shrinks to 351 h under the S2, 63% less than the S1, as shown in Figure 6b,d. Pilots are not interfered with by PVs during the winter in the S2. Due to the small subtended angle of PV panels to pilots on the runway and FP, the TSG decreases much larger than installation sites compared to the S1 (Figure 6d). Without installation angle adjustment, the probability of collision risk is assessed as remote (level 3) in the S2. Additionally, the safety distance minimizes the risk of aircraft colliding with PV, so the severity of collision risk is assessed as minor (level 2), as shown in Figures 7 and 8. However, the collision risk remains unacceptable because the airport PV can affect pilots.

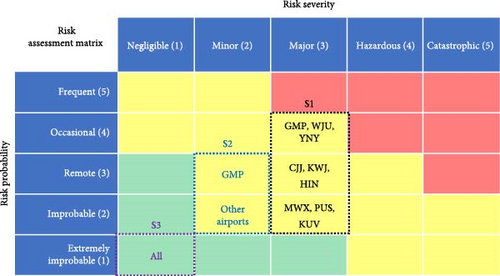
In the S3, the PV panels are rotated to minimize glare. In the morning, the incident light from the east is reflected outside the airport, avoiding disturbance to pilots and ground workers. Similarly, in the afternoon, the incident light from the west is also reflected outside the airport. Thus, TSG was reduced to 0 hr, and the probability of collision risk was assessed as extremely improbable (level 1). Despite the reduced EPV (109.9 MWh/day) caused by non-south-facing PV, the collision risk drops to the acceptable level in the S3.
TSG and EPV were also analyzed for the other eight Korean airports under the three scenarios (Figures S16–S23) and four overseas airports (Figures S24–S27). The results are shown in Figure 7 and summarized in Table 4. Like the YNY, greatly reduced the possibility and severity of collision risk observed at all airports in the case of S3, whereas the S1 increased the risk due to the high TSG. Figure 7 shows the TSG results for each airport in the different scenarios, displaying a similar trend in overseas airports (See Figure S28). Under the S1, TSG ranges from 223 to 2064 h at the airports, with the probability of collision risk assessed from improbable (level 2) to occasional (level 4) (Table 4). Due to the large subtended angle induced by the short distance between possible FPs and PVs, the TSG is extended under the S1. The reduced installation sites for safety distance lead to the decreased TSG by at least 40% at all airports under the S2. In this scenario, the probability of collision risk is reduced to improbable or remote (levels 2–3). The difference in reduction ratio among studied airports might be affected by different their layouts. Lastly, the control of the azimuthal angle of airport PVs effectively bounces off the incident light outside of the airport, thereby dropping TSG to less than 1 h at all airports and making the possibility of collision risk extremely improbable (level 1) under the S3. Figure 8 shows the revised risk assessment matrix for collision, considering glare analysis. Based on the results, the collision risk of airport PV can be diminished to an acceptable level by applying a safety distance and adjusting the azimuthal angle.
3.3. Energy Self-Sufficient Rate of Airport PVs Under Acceptable Risks
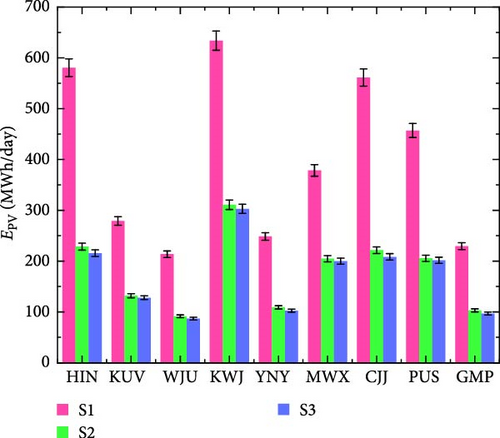
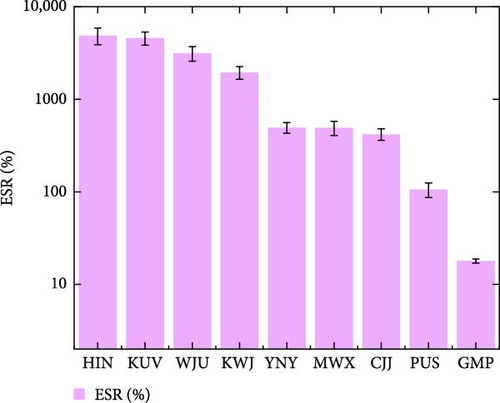
| Airport | EDemand (MWh/day) | EPV (MWh/day) | ESR under the S3 (%) | ||
|---|---|---|---|---|---|
| S1 | S2 | S3 | |||
| HIN | 4.7 | 624.4 | 245.7 | 231.9 | 4881 ± 990 |
| KUV | 3.0 | 300.0 | 141.7 | 137.6 | 4581 ± 734 |
| WJU | 3.0 | 229.6 | 98.4 | 93.5 | 3144 ± 567 |
| KWJ | 16.7 | 681.6 | 334.3 | 325.8 | 1947 ± 302 |
| YNY | 22.2 | 267.3 | 117.2 | 109.9 | 495 ± 65 |
| MWX | 43.8 | 406.9 | 220.1 | 215.0 | 491 ± 86 |
| CJJ | 53.4 | 603.4 | 238.2 | 224.0 | 420 ± 59 |
| PUS | 205.2 | 491.4 | 221.0 | 216.8 | 106 ± 19 |
| GMP | 582.2 | 246.7 | 110.8 | 104.1 | 18 ± 1 |
| SUM | 934.2 ± 89.1 | 3851.3 ± 38.5 | 1727.4 ± 17.3 | 1658.6 ± 16.6 | 178 ± 17 |
- Note: EDemands of each airport were obtained from 2019 to 2023 statistics published by the KAC.
- Abbreviations: ESR, energy self-sufficiency rate; KAC, Korea Airports Corporation.
Due to differences in airport size and PV installation areas, EPV is not uniform across the airports. Generally, a total daily average of EPV (1727.4 ± 17.2 MWh/day) in the S2 is reduced by ~50%–60% compared to that in the S1 (3851.3 ± 38.5 MWh/day) for all airports. The safety distance limits the possible installation site, leading to a sharp decrease of EPV in the S2. Most airports acquire extra space beyond safety distance for ground transportation, hangars, emergency facilities, and other purposes. These sites will be used for airport PV in the S2. However, the extra open space is very limited in most cases due to the limit of budget and existing other facilities, resulting in a sharp reduction of EPV in the case of S2. Additionally, a further reduction of EPV is expected in the S3, primarily because the rotated PV panels are not less efficient at noon, resulting in a 2%–6% reduction in EPV compared to the S2. Despite the sacrifice of efficiency, the daily average EPV remains sufficiently high for all airports to achieve an ESR of greater than 100% in the S3. The cumulative daily average EPV from all airports (1658.6 ± 16.6 MWh/day) is 1.78 ± 0.17 times higher than the total daily average EDemand (934.2 ± 89.1 MWh/day) in the S3. Thus, glare-free PV installations on the unused land of airports with safety distance enable sustainable and self-sufficient airports without increasing the collision risk.
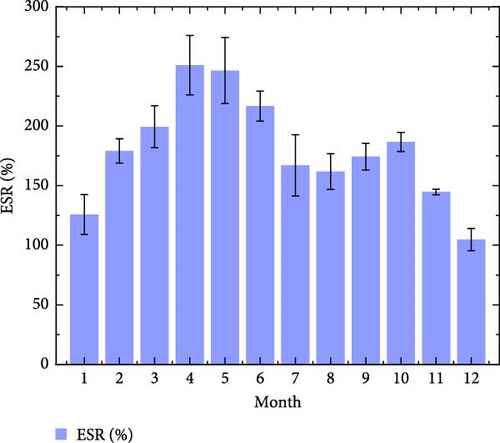
In most months, the monthly average EPV is expected to be larger than the monthly average EDemand (ESR > 100%), indicating the nine airports with PV systems under the S3 operate without external energy supply at most seasons, as shown in Figures 10 and S29–S38. As airport PV panels with fixed elevation angle (30°) will maximize the EPV in the spring (March to June) and fall (September to October), aligns with periods of naturally lower energy consumption for heating and cooling at the airport. Therefore, the ESR of airport PV from all airports is higher than 150% in this period. Conversely, the ESR is diminished in the summer due to increased EDemand for cooling and decreased EPV during monsoon season. Nevertheless, expanded daylight time compensates for increased EDemand, so the monthly ESR is above 100% in the summer. However, decreased EPV coinciding with increased EDemand for heating is very challenging for self-sustainable airports during the winter in Korean airports. Especially, in December, the average peak sun hours of field-installed PV is shorter than 2.5 h, while the heating load boosts EDemand by 20% compared to that of fall. So, the monthly ESR drops to below 100%, requiring additional electricity supply from the outside in December. Despite the risk management for airport PV systems through safety distance and adjustment of azimuthal installation of angle, the result reveals that EPV for airport PV systems is enough high to run the nine Korean airports except for December. Regarding these factors, it is necessary to establish a strategy for selling surplus electricity on the market for 11 months of the year, and to secure the deficient energy demand in December [83–86]. One of the possible solutions for securing the energy supply of airport PV systems during December is long-term storage systems, such as pumped hydro storage, gas-based storage [87], and heat transfer fluid [88].
3.4. Capacity Dependence of ESR From Airport PVs With Acceptable Risks
Another interesting factor of airport PV is the negative relationship between the capacity of the airport and its ESR under safe conditions. As shown in Figure 11, the ESR is inversely proportional to the number of passengers and cargo capacity under the S3. This is mainly attributed to the increased EDemand at large airports, rather than variation of EPV. As summarized in Table 5, the daily average EPV of each airport is in the range of 93.5–325.8 MWh/day. Since the size of each airport does not differ significantly, the variation in the EPV among the nine airports is within a factor of 3.5. On the other hand, there is a significant difference in the EDemand among the nine Korean airports. In particular, the GMP, with the highest number of passengers, consumes more than 190 times of energy compared to the KUV, which has the fewest flights (Table 3). These cause a negative relationship between the airport’s capacity and ESR.
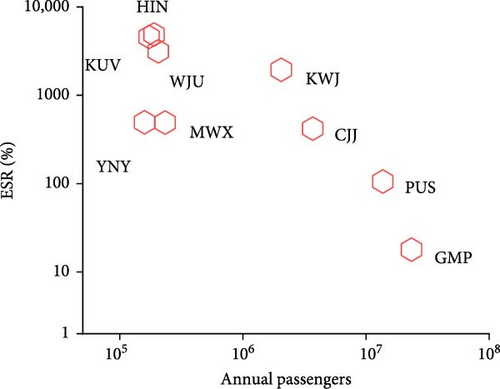
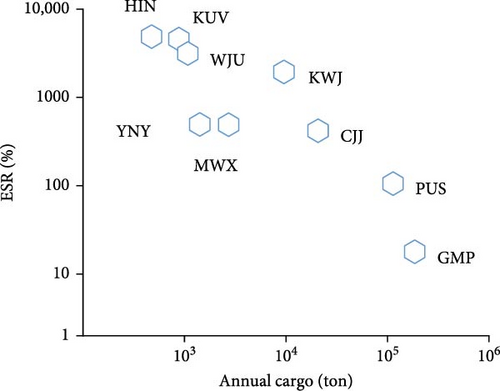
The ESR of airport PV is extremely high at small-sized-domestic airports, where the number of passengers is below one million per year. For example, EPV is 48.8 times more than EDemand at the HIN under the S3. The ESR exceeds 3000 in small-sized airports such as KUV and WJU, whose EDemand is below 4 MWh/day, as shown in Figure 12. The different layouts of runways and land use of the airports also affect the ESR of airport PV systems. For example, KWJ, HIN, CJJ, and MWX have vast areas of unused land available for airport PV installation to generate EPV of more than 200 MWh/day without addressing the safety issues (Table 5). These airports are located in rural areas, so they would have been easy to secure a large area due to low land prices at the time of the construction. Owing to the enormous installation site to increase EPV, these airports exhibit an ESR of more than 400% in the S3. Despite the lack of unused land in some airports, the ESR exceeding 400% is also observed at the YNY, KUV, and WJU in the S3 owing to their low EDemand (<25 MWh/day).
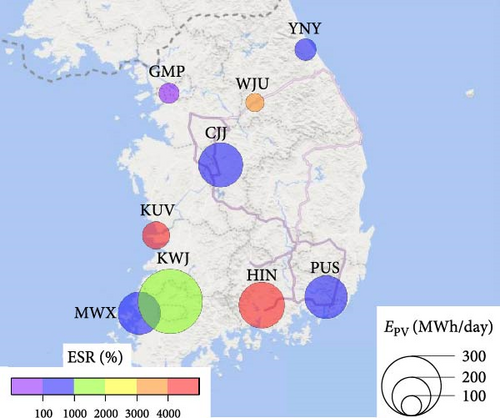
A similar tendency will be expected in other regional and domestic airports with only 1 runway located at similar latitudes. Since the length and width of the runway follow international standards, the size of most airports with only 1 runway does not vary much. Thus, the attainable EPV under safe conditions would be similar to each other. Moreover, the EDemand of an airport is primarily determined by number of passengers and outside temperature [89, 90]. Except for some airports, located in a tropical region and polar areas, the EDemand of regional and small-sized international airports are expected to be below 100 MWh/day. Consequently, the EPV would meet the energy demand of most regional and small-sized international airports. In the case of MUR and DLM, whose annual passengers were below 5 million, the ESR of airport PV under the S3 is also expected to exceed 100%, as shown in Figure S39.
In contrast, a huge EDemand lags in satisfying self-sustainable airports by PVs. GMP and PUS are the two main airports in South Korea, serving over 13 million passengers per year. Although EPV exceeds 100 MWh/day in the GMP and PUS under the S3, the high EDemand decreases the ESR and makes it difficult to operate those airports by PV alone under the S3. For the PUS, EPV is 216.8 MWh/day in the S3, bigger than its EDemand (205.2 MWh/day). So, the ESR is 105.7%. Careful management and operation of PV to minimize energy loss will be required for PUS to maintain an ESR of over 100%. For the GMP, EDemand (582.2 MWh/day) is too high to meet through EPV in any installation scenario. Under the S3, the ESR of GMP is only 17.9%. Similar trends are also observed in the large-sized overseas international airports located at similar latitudes: the NRT. The ESR of NRT is below 100%. On the other hand, the ESR of RUH might be over 100% despite increased EDemand for cooling and an increased number of passengers (over 26 million per year), as shown in Figure S39. The RUH is located in the desert with vast unused land around the runway, which is different from other large-sized international airports. However, such vast unused land is not common in large-sized airports near metropolitan cities, most of them require an external energy supply to run an airport. Thus, the desirable strategy to increase ESR in large international airports is to supply energy from the EPV of other regional airports. For instance, excessive EPV from the other eight Korean airports is sufficiently high to compensate for the shortage at GMP. The cumulative EPV from all airports was 1.78 ± 0.17 times the cumulative EDemand, so this strategy will allow South Korea to realize sustainable and self-sufficient airports.
It should be noted that additional energy could be generated by using bifacial PV and installing PV on the roofs of the terminal buildings. Moreover, advanced operating technologies, AI-based maintenance and operation, antireflection layers [91, 92], module-level power optimizers [93, 94], single-axis (elevation angle) tracking systems [95–97], and high-efficiency PV using heterojunction and tandem structured cells and modules [98–100] can further boost EPV and ESR. However, such measures have not been widely accepted in field-installed PV at the current stage, so they are not accounted for in this work. If these are included in the calculation, the self-sustainable airport with PV will be achieved using a small amount of land compared to this work.
3.5. Cost Analysis of the Airport PV With Acceptable Risk
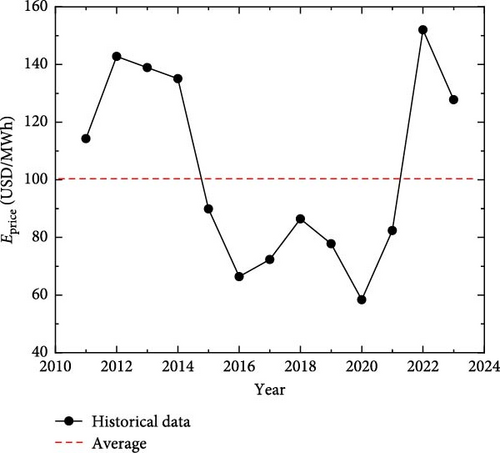
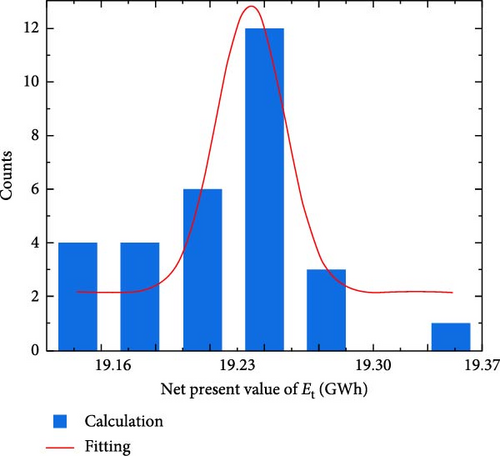
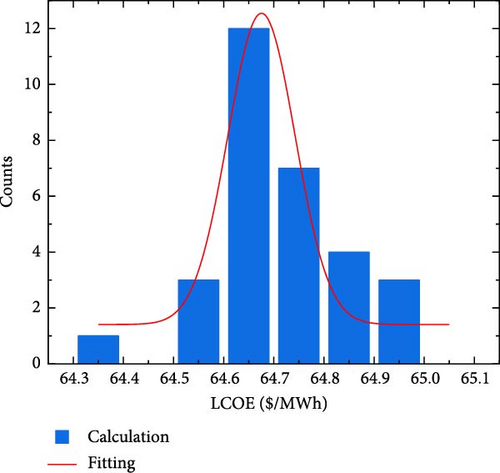
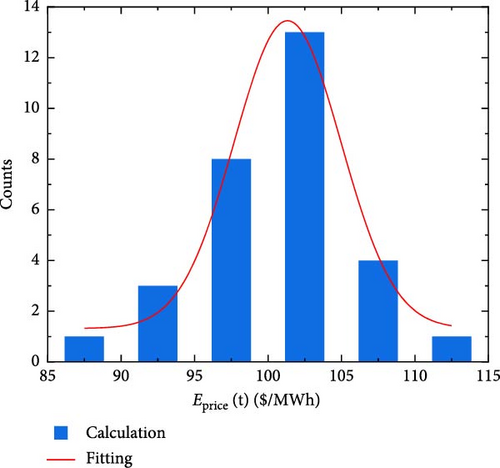
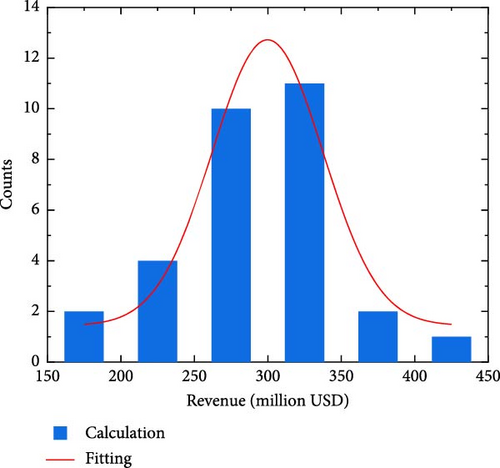
Considering the complexity of EPV and Eprice in Korea, the LCOE of airport PVs under acceptable risk conditions is calculated using a Monte Carlo simulation. For the calculation, it is assumed that the estimated annual EPV of optimized 1 MW airport PV is 1401.6 ± 14 MWh ( = 4.00 ± 0.07 h/day × 0.96 × 365 day × 1 MW) at the first year in the S3. Since the PV is rotated to minimize glare-related risk, the annual average peak sun hours is 3.84 ± 0.04 (4% lower than that of south-facing PV). The lifetime of airport PV is 25 years with a degradation rate of 0.8%/year. Throughout Equation (1), the achieved net present value of Et ( for 1 MW airport PV ranges 19.23 ± 0.04 GWh under the S3, as shown in Figure 13a. Although the deviation of peak sun hours is reflected in Et,m of airport PV at each year in the simulation, the deviation of the net present value of Et for 25 years is negligible because the variation of Et,m for each year and the case is compensated during the repeated calculation. Detailed procedure to calculate the LCOE is elucidated in the supporting information (Table S2). As the net present value of investment (It) and maintenance (Mt) for 1 MW airport PV is 1.24 million USD, the average LCOE of airport PV with acceptable risk is 64.7 ± 0.1 USD/MWh. Figure 13b is a predicted distribution of LCOE for airport PV installed at nine Korean airports with acceptable risk, whose minimum and maximum values are 64.4 and 65.0 USD/MWh. Compared to the distribution of possible EPrice, as shown in Figure 13c, the predicted LCOE is much cheaper. Consequently, it would be an economic advantage to install airport PV even in the S3. The attainable net present value of revenue from 1 MW of airport PV at Korean airports would be 699,981 ± 121,512 USD during its lifetime, calculated through Equation (3). Considering the installation capacity of airport PV (431.8 MW) at nine Korean airports under the S3, the net present value of revenue from the entire PVs would be 299.8 ± 52.4 million USD in nine Korean airports (Figure 13d) [7]. Without any subsidies, the nine Korean airports can install PVs with acceptable risk. If the advantage of replacing electricity from a coal power plant with a carbon capture system (86 g CO2-e/kWh) with PV (11.5 g CO2-e/kWh) is included, the revenue from airport PV in the S3 will increase [101, 102]. However, the seasonal, daily, and hourly variation of EPV and EDemand does not account for this calculation, due to the lack of their real-time data. For operating an airport by only airport PV, the storage system should be installed together. If further information is provided, the accurate cost for meeting the EDemand of the airport through the PV and storage system will be derived as suggested in previous works [103–106].
4. Conclusion
The risk and potential energy generation of airport PV are assessed at nine Korean airports. Our findings indicate that PV is a suitable renewable energy source for airports owing to its lower risk of collision and fire compared to other alternatives, such as wind and hydrogen. While the glare from PV panels has impeded their adoption at many airports, our analysis suggests that airport PV can pose an acceptable risk by installing at a safety distance and optimizing azimuthal angle. Although these safety measures reduce the potential energy generation, their annual average remains sufficiently high to meet the airport energy demand. Notably, excess energy generated by PVs at regional airports can offset the energy deficit at large international airports. With current technology levels, the potential energy generation of airport PV is estimated as 1.78 ± 0.17 times higher than the total energy demand at the nine Korean airports. A cost analysis demonstrates that airport PV is economically beneficial. These results suggest that airport PV contributes to sustainable and self-sufficient airports in South Korea without compromising safety.
Nomenclature
-
- CJJ:
-
- Cheongju International Airport
-
- DLM:
-
- Dalaman International Airport
-
- EDemand:
-
- Average daily energy demand of an airport
-
- EDemand-SD:
-
- Standard deviation of EDemand
-
- EPV:
-
- Daily average of the potential energy generation from photovoltaic
-
- EPV-SD:
-
- Standard deviation of EPV
-
- Eprice,m (t):
-
- Electricity price at year t in the case of m
-
- Et:
-
- Electricity generated in year t
-
- Et,m:
-
- Electricity generated at year t in the case of m
-
- ESR:
-
- Energy self-sufficiency rate
-
- ESRSD:
-
- Standard deviation of ESR
-
- Ft:
-
- Fuel cost in year t
-
- FP:
-
- Flight path
-
- GMP:
-
- Gimpo International Airport
-
- HIN:
-
- Sacheon Airport
-
- It:
-
- Investment cost in year t
-
- ICAO:
-
- International Civil Aviation Organization
-
- KAC:
-
- Korea Airports Corporation
-
- KUV:
-
- Gunsan Airport
-
- KWJ:
-
- Gwangju Airport
-
- LCOE:
-
- Levelized cost of electricity
-
- LCOEm:
-
- Levelized cost of electricity in the case of m
-
- LPAI:
-
- Low potential after image
-
- Mt:
-
- Operation and maintenance cost in year t
-
- MWX:
-
- Muan International Airport
-
- NRT:
-
- Narita International Airport
-
- PAI:
-
- Potential after image
-
- PUS:
-
- Gimhae International Airport
-
- PV:
-
- Photovoltaic
-
- RMU:
-
- Murcia International Airport
-
- RUH:
-
- King Khalid International Airport
-
- S1:
-
- Scenario 1
-
- S2:
-
- Scenario 2
-
- S3:
-
- Scenario 3
-
- SGHAT:
-
- Solar glare hazard analysis
-
- TSG:
-
- Total annual glare time
-
- WJU:
-
- Wonju Airport
-
- YNY:
-
- Yangyang International Airport.
Conflicts of Interest
The authors declare no conflicts of interest.
Funding
This work was supported by the National Research Foundation of Korea (NRF) grant funded by the Korean Government (MSIT) (2022R1A2C1092582 and RS-2024-00448806) and also supported by Korea Institute of Energy Technology Evaluation and Planning (KETEP) grant funded by the Korea Government (MOTIE) (RS-2023-00266248).
Acknowledgments
The authors express their gratitude to Sims Industries, LLC for allowing them to use the Forgesolar program. This work was supported by the National Research Foundation of Korea (NRF) grant funded by the Korean Government (MSIT) (2022R1A2C1092582 and RS-2024-00448806) and also supported by Korea Institute of Energy Technology Evaluation and Planning (KETEP) grant funded by the Korea Government (MOTIE) (RS-2023-00266248).
Supporting Information
Additional supporting information can be found online in the Supporting Information section.
Open Research
Data Availability Statement
The data that support the findings of this study are available from the corresponding author upon reasonable request.


