Integration of PV Sources and Capacitor Banks for Sustainable Energy Management in Distribution Networks Using Electric Eel Foraging Algorithm
Abstract
Electricity drives economic growth, technological advancement, and improved quality of life, but it also poses environmental pollution challenges due to reliance on traditional energy sources such as petroleum and natural gas. Distribution systems’ extensive reach makes it easier to integrate different renewable energies, particularly solar power, across different voltage levels. While integrating solar photovoltaic (PV) cells into existing traditional distribution systems may seem straightforward, studies reveal that their unchecked proliferation can lead to increased electrical losses and greater disruptions in power quality. This study introduces a coordinated methodology of PV energy systems and capacitor bank (CB) devices in electrical distribution feeders. The presented coordinated integration offers a sustainable energy solution for mitigating system losses, facilitating voltage profile enhancement as an important power quality indicator for adequate customer operation. In this regard, practical concerns include variations in power loadings, the discrete nature of CBs, and actual power production from PV sources are taken into consideration. For handling the presented coordinated integration, this paper develops the electric eel foraging-based optimization (EEFO) for energy efficiency and power quality improvement as well as environmental sustainability. The designed EEFO has been evaluated on practical Egyptian and standard IEEE distribution systems, demonstrating its effectiveness in minimizing energy losses and improving power quality. Comparative studies against reported algorithms validate EEFO’s superior performance.
1. Introduction
Long-distance electrical spread frequently results in large energy losses and reliability problems for traditional distribution networks. They also have trouble controlling peak loads and how they affect the power quality. Addressing these problems requires innovative solutions to improve reliability, efficiency, and sustainability in power distribution [1, 2]. In a number of domains, such as wind energies evaluation [3], grid-tied photovoltaic (PV) devices [4, 5] concentrating PV-thermoelectric system efficiency forecasts [6], fuel cell model [7, 8] and more, bioinspired optimization algorithms have become effective instruments. The shift toward new and modern distribution systems involves creating advanced networks that satisfy current operational, financial, and environmental demands. Such systems seek to reduce their impact on the environment, incorporate sources of clean energy, and increase efficiency. One of the biggest obstacles, meanwhile, is the high financial price of switching from traditional networks to these new ones. On the other hand, modifying, developing, and enhancing conventional distribution feeders is less economically complex. However, a significant challenge lies in the integration of new technologies into traditional systems of distribution and achieving optimal operation [9]. Balancing economic feasibility with the technical demands of modernization is essential. Addressing these challenges is crucial for the successful enhancement of traditional power distribution networks. Integrating renewable energy sources (RESs) into electrical distribution systems is a crucial technology for enhancing traditional distribution networks. This integration improves efficiency and addresses environmental issues. It plays a key role in modernizing and advancing the performance of conventional power distribution systems [10, 11]. Allocation of renewable resource units in modern distribution systems (as distributed generators [DGs]) is a critical aspect of modernizing energy infrastructure to incorporate RESs efficiently in distribution systems [12]. The need for this is due to the continuous increase in loads, where the global energy landscape has been undergoing significant changes due to population growth, urbanization, industrialization, and technological advancements [13]. As a result, there has been a notable increase in global energy demand and usage over the past few decades. As a comparison, electrical consumption worldwide increased from about 14,000 to 25,500 TWh in the last two decades. Among other renewable resources, PV installations have experienced significant growth over the past few decades due to declining costs, technological advancements, supportive government policies, and increasing awareness of climate change and RESs [14].
1.1. Literature Survey on PV Allocation in Distribution Systems
PV unit integration with distribution networks has drawn a lot of interest due to the pressing need for sustainable energy solutions. The strategic allocation of these units is critical for optimizing system performance, enhancing efficiency, and mitigating environmental impacts. This survey reviews key studies and methodologies employed in the allocation of PV units within distribution systems. Maximizing the PV hosting capacity [15], Mitigating power loss [16], enhancing the voltage profile [17], improving reliability [18], and augmenting the voltage stability limit [19] are the main objectives of PV allocation in distribution systems. A thorough analysis of the several goals, formulas, and techniques for distributing PV devices in networks of distribution is provided by Bawazir and Cetin [20]. The PV systems are usually represented via their equivalent circuits based on single [21], double [22], and triple diode models [23]. Hachemi et al. [24] introduced a modified reptile searching approach (RSA) specifically designed to optimize the integration of RESs, including PV and wind units, into distribution grids with cost minimization objective function related to electricity procurement-based wind and PV units and annual energy losses minimization. Aref et al. [25] proposed a refined analytical approach for incorporating RESs into existing power grids, considering multiple factors such as system reliability, load capacity, and economic feasibility. A genetic algorithm (GA)-based method is proposed in [26] to determine the optimal size and location of PV units, aiming to reduce system losses and enhance voltage stability. Selim et al. [27] utilized a chaotic slap swarm-based technique for optimal PV unit sizing and siting, focusing on technical objectives. In order to increase utility profit and minimize loss of energy, a combination meta-heuristic method that combines gravitational searching algorithms with phasor particle swarm optimization (PSO) has been suggested in [28] for optimally accommodating PV modules.
1.2. Literature Survey on CBs Allocation in Distribution Systems
Reactive power compensation using shunt capacitor banks (CBs) is a highly effective strategy for overcoming the challenges of conventional distribution systems and enhancing their performance, especially with increasing electricity demand [29]. Expanding the capacity of transmission and distribution systems is not always practical or cost-effective, so the installation of distributed active and/or reactive power sources near consumer locations can reduce the need for new infrastructure. The installation of CBs in a distribution system provides various technical and economic benefits, such as reducing system losses, stabilizing voltage profiles, lowering branch currents, improving power factors, and enhancing power quality, among other advantages [30]. Recently, numerous analytical and artificial intelligence techniques were employed to address the optimal CBs placement problem. Elsayed et al. [31] used the grasshopper optimization to achieve optimal allocation of fixed and switchable CBs in distribution networks, incorporating graph set theory and power loss indicator, while a hybrid GA-exchange market method has been designed for switchable CBs allocations in [32]. In [33], a GA-based method was introduced for the rating and placement of CBs in distribution systems to minimize the total planning costs, including both investing and variable costs. In [34], a discrete variant of the vortex searching technique was presented for selecting and placing fixed-step CBs, considering load distribution and network topology to identify the most effective locations to minimize energy loss costs during a 1-year operating period. A two-phase PSO-based approach was detailed in [35], where the first phase used the losses-sensitivity factor (LSF) approach to identify potential buses for shunt capacitor installation. The second phase involved implementing PSO to select the best buses and determine the optimal capacitor sizes among the candidates identified in phase one, aiming to reduce power losses and total annual costs. The past few decades have seen the use of a number of conventional algorithms and associated combinational strategies with optimization methods, such as the presentation of LSF and mine blast optimizer in [36], LSF and artificial optimization of bee colonies in [37], etc.
1.3. Literature Survey on Concurrently Allocation PV Units and CBs in Distribution Systems
Integrating PV systems and CBs is increasingly recognized as a critical strategy for enhancing power system performance. This approach addresses multiple challenges faced by modern power grids, including voltage instability, reactive power compensation, and energy efficiency [38]. PV units contribute clean, RES, helping to reduce the reliance on fossil fuels and lower GHG emissions. When combined with CBs, which stabilize voltage levels and improve reactive power support, this integration optimizes overall system performance. The coordinated use of PV units and CBs helps to mitigate voltage fluctuations, enhance voltage regulation, and increase energy efficiency. By generating electricity locally and managing reactive power demands, this strategy also alleviates grid congestion, reduces stress on transmission infrastructure, and decreases transmission losses [39, 40]. Furthermore, it improves the reliability and stability of the distribution network, ensuring a more resilient power supply [41]. The integrated deployment of PV units and CBs contributes as well to long-term environmental and economic benefits. An arithmetic optimization algorithm (AOA) was described in [38] for determining the efficient allocations of DGs and CBs for distribution performance enhancement. Shaheen et al. [42] presented Kepler optimization methods, respectively, for allocating PV static synchronous compensator (PVSTATCOM) units, which provide ancillary services to improve system stability, voltage regulation, and power quality while considering various technical and operational constraints. Ghenai and Bettayeb [43] present an optimized layout and operation of an off-grid electrical system for a college building, utilizing solar PVs and other types of DGs. The primary objective is to create a highly renewable fraction power system with low energy costs and GHG emissions, transitioning from a grid-tied fossil fuel system to a cleaner, RES solution. Efficient allocation of static VAR compensators requires identifying the optimal locations and sizes for their installation [44]. For minimizing power losses, a modified chaotic version of the searching group optimization (SGO) algorithm was introduced to tackle the joint network reconfiguration and DG problem [45]. In [46], a modified differential evolution (DE) was proposed for positioning DGs and defining the values and locations of dispatchable loads to reduce energy production costs, deeming uncertainties in loading demands, RESs, and market prices. Hu et al. [47] suggested an integrated active/reactive power optimization approach for distribution systems that have a high penetration of PV units, striving to decrease voltage fluctuations, PV real power curtailment, distribution network losses of operation, and adjustments of traditional voltage-regulating devices like on-load tap changers (OLTCs) and CBs.
1.4. Paper Contributions
The global optimum is the most desirable solution in an optimization problem, representing the optimal result. However, achieving this exact solution is not always guaranteed, and the outcome of an optimization process is uncertain. Algorithms used in optimization may fall short of delivering the exact global optimum. As a result, the solution reached through these processes is often considered quasi-optimal. This term reflects the uncertainty that the solution may or may not match the true global optimum. Consequently, optimization results are approached with caution, recognizing that they may only approximate the best possible outcome [48]. Electric eel foraging-based optimization (EEFO), introduced by Zhao et al. [48], is inspired by the intelligent group foraging behaviors of electric eels observed in nature. The algorithm simulates four primary behaviors, that are interaction, resting, hunting, and migration. An important aspect of EEFO is its inclusion of an energy factor (EF), which helps control the transition from a broader global search to a more focused local search [49]. This EF also maintains a balance between exploration and exploitation within the search space. By mimicking the adaptive behaviors of electric eels, EEFO displays different foraging patterns based on their natural characteristics.
Unlike PSO, which relies on velocity and position updates, or GA, which employs crossover and mutation, EEFO simulates the electro-location ability of electric eels. The electric field sensing mechanism enables EEFO to adaptively adjust search strategies based on environmental stimuli, enhancing its exploration and exploitation balance. EEFO integrates an adaptive foraging strategy that dynamically switches between local and global searches. It employs a field intensity-based movement model, which guides solutions toward optimal regions more efficiently than traditional PSO inertia-weight adjustments. Instead of relying on predefined velocity updates like in PSO, EEFO modifies step sizes dynamically based on the fitness landscape. This results in a more flexible and self-regulating search process, reducing the risk of premature convergence seen in GA’s genetic operators. EEFO employs a nonlinear attraction-repulsion mechanism based on the intensity of electrical signals, which prevents stagnation in local optima. This feature enhances its ability to escape suboptimal solutions, addressing one of the common drawbacks of GA’s selection pressure and PSO’s rapid convergence issues.
- -
The proposed EEFO algorithm has been developed and applied to optimize PV units and CB units within distribution systems, taking into account practical constraints and the discrete characteristics of capacitors.
- -
The algorithm effectively manages fluctuations in customer power loadings and energy production from renewable PV sources.
- -
The proposed algorithm significantly contributes to environmental sustainability by greatly reducing carbon dioxide (CO2) emissions related to conventional power sources.
- -
The performance of the proposed EEFO algorithm in the test systems is showcased through comparisons with existing methods, including northern goshawk optimization (NGO), optical microscope algorithm (OMA), and quadratic interpolation optimization (QIO).
- -
The results highlight the positive impact on energy savings and power quality while significantly reducing carbon emissions, compared to previously reported outcomes.
2. Problem Formulation of PV Units and CBs in Distribution Feeders
Countries worldwide have strived to augment their RESs within their grids [50]. This has been positively impacted by reducing harmful emissions and alleviating the load on electrical grids, thereby contributing to solutions for energy challenges. Foremost among these benefits are reducing the energy losses, enhancing the electrical system efficiencies, and improving the power quality to increase consumer satisfaction.
2.1. Objective
2.2. Control Variables Constraints of PV and CB Units
The key control variables supported by PV units and improvement CB units are the optimal placement and sizes of these PVs and CBs within the distribution system.
2.2.1. PV Units
2.2.2. CB Units
2.3. Constraints on Dependent Variables
3. Developed EEFO for PV Sources and Capacitors Optimization in Distribution Systems
The EEFO algorithm is a novel population-based technique presented by Zhao et al. [48]. This technique is influenced by the foraging patterns of electric eels, displaying an ability to adapt to alterations in the environment and shifts in the optimization landscape. This mirrors the electric eels’ capacity to modify their behaviors based on feedback from electrical signals in their surroundings. Indigenous to South America, electric eels are renowned for their capacity to discharge high voltage for stunning prey. Navigating and locating prey with their subpar eyesight involves the use of low-voltage discharge. Electric eels showcase sophisticated communication and defense mechanisms utilizing electric charges, establishing a distinctive foraging strategy. Additionally, electric eels partake in swarm-based social predation, collaborating on actions for hunting. EEFO is crafted to emulate the socially intelligent foraging behaviors observed in electric eels, drawing inspiration from their interacting, resting, hunting, and migrating behaviors. The subsequent elucidation outlines the primary phases encompassed in the EEFO algorithm.
3.1. Initialization
As shown, the first part represents the location and size of PV units, which have several design variables (2 ∗ NPV). The first NPV is related to the candidate buses to install PV systems, while the other NPV is regarding the associated sizes of the PV systems.
The second part represents the location and size of CBs, which have several design variables (2 ∗ NCP). The first NCP is regarding the candidate buses to install capacitors, while the other NCP is related the associated sizes of the capacitors.
3.2. Interacting Behavior
3.3. Resting Behavior
Per Equation (20), electric eels’ interacting conduct facilitates movements to diverse locations within the exploration-friendly search space of EEFO.
3.4. Hunting Behavior
3.5. Migrating Behavior
3.6. Dynamic Positional Adaptation in Response to Electrically Perceived Prey Movements
3.7. Transition From Exploration to Exploitation
- •
Step 1: Modifying the search solution using Equation (30) to address the discrete capacitors nature.
- •
Step 2: Installing the capacitors and PV sizes at their designated buses.
- •
Step 3: Performing a 24-h load flow analysis that considers variations in loads and power generated by the PV systems.
- •
Step 4: Verifying the operational limitations such as line flows, bus voltage, and penetration limits.
- •
Step 5: Assessing the energy losses per day utilizing Equation (1).
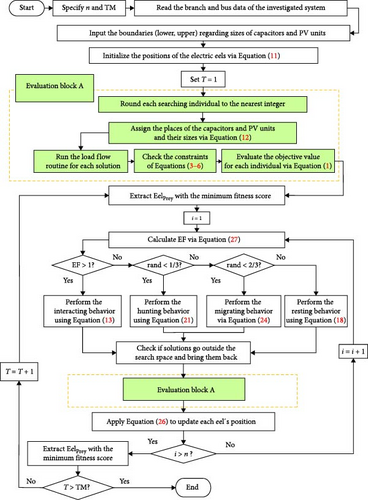
The main steps encompassed within the EEFO method are illustrated in the subsequent flowchart in Figure 1.
4. Simulation Results and Discussion
The application of modern techniques for improving distribution system performance is crucial in meeting the increasing demands for reliable and efficient power delivery. As electrical grids become more complex with the integration of RESs and growing load demands, traditional methods often fall short in managing distribution systems under these new and complex conditions. Innovative approaches, such as advanced optimization algorithms, smart grid technologies, and real-time monitoring systems, are essential for enhancing the overall efficiency and resilience of the grid. These techniques enable better management of energy flow, reduction of losses, and improved voltage regulation, ensuring that distribution systems can adapt to changing conditions and maintain high-performance standards.
Applying EEFO is proposed as an essential solution for improving distribution system performance due to its superiority and effectiveness. By mimicking the efficient foraging behavior of electric eels, EEFO can effectively identify optimal solutions for minimizing energy losses and enhancing grid reliability. Assessing the performance of this optimization technique is equally important, as it ensures that the algorithm not only improves system efficiency but also adapts to real-world challenges, making it a valuable tool for modernizing and strengthening distribution networks.
The proposed EEFO algorithm is tested on three different distribution feeders: a practical Egyptian feeder with 37 nodes [59], the IEEE standard 69-node system [60], and a practical Egyptian feeder of Qaha Nawa [39]. In the studied scenarios, the installation of capacitors is limited to a maximum size of 3600 kVAr, with a maximum of five units allowed for installation. Similarly, the PV systems are constrained to a maximum size of 1000 kW, with a maximum of five PV units permitted. The EEFO algorithm is implemented to optimize the placement and sizing of both PV units and capacitors, focusing on minimizing energy losses as the main objective function. This optimization takes into account the dynamic nature of load demands and variations in PV power generation, ensuring efficient energy management across the distribution networks.
To evaluate its performance, the proposed EEFO is compared with recent algorithms: NGO [61], OMA [62], and QIO [63]. Additionally, the EEFO is assessed against other reported techniques, incorporating the dragonfly approach (DA), augmented subtraction average approach (ASAA), subtraction average algorithm (SAA), osprey optimization approach (OOA), and coati optimization approach (COA) [64]. The evaluations involve running each algorithm 20 times, consistently using 30 search agents, and setting a maximum iteration limit of 100 for all cases.
All three algorithms, NGO, OMA, and QIO, are relatively recent contributions to the field of metaheuristic optimization. Their designs incorporate contemporary strategies aimed at improving convergence speed, avoiding local optima, and enhancing adaptability in constrained environments. By comparing the proposed EEFO against these modern algorithms, we ensure that the benchmarking is both up-to-date and reflective of the current research landscape. Each of these algorithms has demonstrated high efficiency and adaptability in solving complex engineering optimization problems. NGO is recognized for its effective balance between exploration and exploitation and its swarm-based decision mechanisms inspired by natural predatory behaviors [61]. OMA mimics the magnification process of optical microscopes to refine solution spaces at different resolutions, showing strong capability in fine-tuning near-optimal solutions [62]. QIO employs a mathematical interpolation-based approach that leverages second-order estimation for accelerating convergence with fewer search agents [63]. These algorithms have been successfully applied and validated in peer-reviewed publications, particularly in the domains of distribution systems [65]. Their inclusion in our study provides a meaningful reference point for evaluating the effectiveness of our proposed EEFO approach. Since our research focuses on optimizing PV and CB allocation in distribution systems—a highly nonlinear and constrained optimization task—it was essential to compare EEFO with algorithms that have shown competence in similar problem domains. NGO, OMA, and QIO meet this criterion, making them suitable and fair choices for performance comparison.
4.1. First Test System (37-Bus Practical Egyptian Test System)
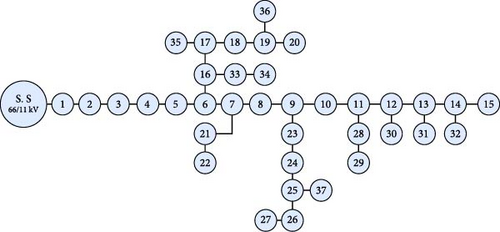
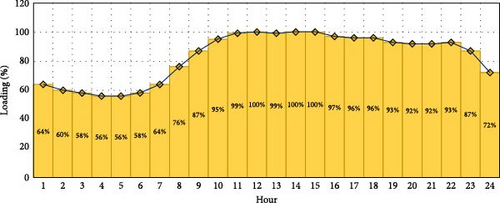
The first test system focuses on applying the proposed EEFO-based methodology to a practical, heavy-loaded, highly losses distribution system, specifically the Tala distribution feeder located in the Menoufia governorate, Egypt. This distribution system consists of 36 feeders and 37 nodes, as shown in Figure 2, with a rated voltage of 11 kV. Under nominal load conditions, the total real and reactive power demands are 4801.9 kW and 2975.9 kVAr, respectively. The operating voltages must remain within an acceptable range of (0.9–1.1) per unit (PU) to ensure system reliability, which is difficult to achieve in the normal system configuration without improvement. This practical scenario serves as the initial test case for the proposed methodology, considering the unique characteristics and constraints of an Egyptian distribution feeder. This case also accounts for hourly load variations, expressed as a percentage of the nominal load condition, as illustrated in Figure 3, allowing for a detailed examination of how the load fluctuates throughout different hours compared to the peak load condition.
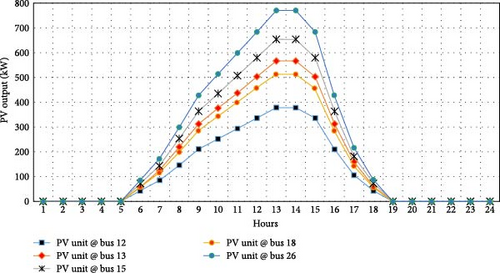
For this system, the proposed EEFO, OMA, NGO, and QIO are implemented to specify the optimal allocations of PV units and CB units, as detailed in Table 1. The EEFO algorithm identifies five buses 12, 13, 15, 18, and 26—for PV installation, with capacities of 419, 628, 726, 569, and 854 kW, respectively. For CB placement, EEFO selects five buses 4, 7, 14, 17, and 26—with capacities of 900, 2700, 200, 800, and 800 kVAr, respectively. Figure 4 illustrates the hourly variation of PV-generated power at the selected buses using the EEFO approach, highlighting the dependency of PV output on sunlight. During nighttime hours (1–5 and 19–24), all buses show zero output power of PV units, reflecting the lack of sunlight. As daylight begins around hour 5, the PV units at each bus gradually ramp up power generation, peaking at hours 13 and 14, when solar generation is at its maximum. The proposed EEFO outperforms the NGO, OMA, and QIO methods, achieving the lowest energy losses at 10,331.06 kWday—a 3.09% improvement over NGO, a 4.33% improvement over OMA, and a 1.30% improvement over QIO, which reported energy losses of 10,660.27, 10,798.92, and 10,467.19 kWday, respectively.
| Applied technique | NGO | OMA | QIO [65] | EEFO | ||||
|---|---|---|---|---|---|---|---|---|
| Size | Location | Size | Location | Size | Location | Size | Location | |
| PV units | 995 kW | Bus-9 | 704 kW | Bus-18 | 449 kW | Bus-10 | 569 kW | Bus-18 |
| 533 kW | Bus-24 | 331 kW | Bus-21 | 873 kW | Bus-11 | 628 kW | Bus-13 | |
| 10 kW | Bus-26 | 1000 kW | Bus-32 | 679 kW | Bus-17 | 419 kW | Bus-12 | |
| 923 kW | Bus-31 | 525 kW | Bus-9 | 741 kW | Bus-23 | 726 kW | Bus-15 | |
| 303 kW | Bus-6 | 507 kW | Bus-23 | 392 kW | Bus-29 | 854 kW | Bus-26 | |
| CB units | 1800 kVAr | Bus-5 | 2000 kVAr | Bus-13 | 1900 kVAr | Bus-5 | 800 kVAr | Bus-17 |
| 1700 kVAr | Bus-11 | 600 kVAr | Bus-24 | 1600 kVAr | Bus-11 | 200 kVAr | Bus-14 | |
| 900 kVAr | Bus-37 | 400 kVAr | Bus-37 | 300 kVAr | Bus-16 | 900 kVAr | Bus-4 | |
| 1000 kVAr | Bus-4 | 800 kVAr | Bus-9 | 400 kVAr | Bus-18 | 2700 kVAr | Bus-7 | |
| — | 1700 kVAr | Bus-4 | 800 kVAr | Bus-25 | 800 kVAr | Bus-26 | ||
| Daily energy losses (kWday) | 10,660.27 | 10,798.92 | 10,467.19 | 10,331.06 | ||||
Additionally, for this case, Figure 5 shows the daily energy losses (kWday) achieved using the EEFO algorithm compared to the NGO, OMA, and QIO techniques across all separate runs. Table 2 further presents various metrics, including the best, mean, worst, and standard deviation (STD) of daily energy losses for the first test system, highlighting the performance differences among the NGO, OMA, and QIO and proposed EEFO algorithms. The EEFO algorithm demonstrates superior performance, achieving the lowest average energy losses at 10,654.24 kWday, which represents a 4.71% improvement over NGO, a 9.57% improvement over OMA, and a 2.88% improvement over QIO, with energy losses of 11,181.1, 11,781.98, and 10,969.62 kWday, respectively. Even in the worst-case scenarios, EEFO continues to lead, producing the least energy losses at 10,897.88 kWday, marking a 6.19% advantage over NGO, a significant 15.25% improvement over OMA, and a 5.68% improvement over QIO, whose worst-case energy losses are 11,617.02, 12,858.74, and 11,553.93 k/day, respectively.
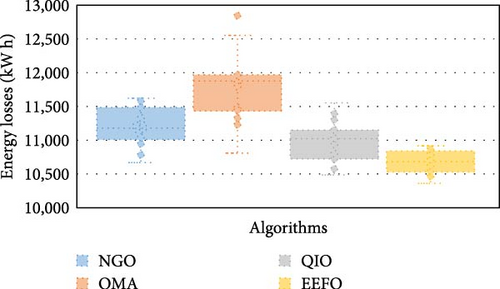
| Applied technique | NGO | OMA | QIO | EEFO | |
|---|---|---|---|---|---|
| Energy losses/day (kWday) | Best | 10,660.27 | 10,798.92 | 10,467.19 | 10,331.06 |
| Mean | 11,181.1 | 11,781.98 | 10,969.62 | 10,654.24 | |
| Worst | 11,617.02 | 12,858.74 | 11,553.93 | 10,897.88 | |
| STD | 285.1879 | 455.0851 | 287.7033 | 157.265 | |
By leveraging the optimized PV and CB units selected by the EEFO algorithm, Figure 6 presents a detailed view of hourly power losses, comparing these with the initial values in the absence of PV and CB units. Significant reductions in power losses are observed during peak PV output hours from 12 to 15. During this period, losses decrease from 1766.22, 1695.18, 1766.22, and 1766.22 kW to substantially lower values of 235.39, 214.38, 213.69, and 235.39 kW, reflecting an average reduction of 87.15%. Conversely, during nighttime hours (19–24 and 1–5), the power generated by PV units is zero. In the 19:00–24:00 period, power losses decrease significantly, ranging from 51.73% to 22.83%, due to the reactive power compensation from CB units at buses 4, 7, 14, 17, and 26, which together provide 5.4 MVAr. However, from 1 to 5, this static reactive power becomes excessive and places additional strain on the grid, as the reactive power load reaches its lowest points at hours 04:00 and 05:00, as shown in Figure 3. The daytime patterns align with expected solar power production, demonstrating the EEFO algorithm’s success in optimizing PV placement and sizing. The algorithm’s adaptability to varying daylight conditions highlights its potential for effective energy management. Despite the anomaly observed at hour 14, the overall trend underscores the algorithm’s effectiveness in capturing the dynamic nature of PV generation and provides valuable insights into the system’s response to solar radiation throughout the day.
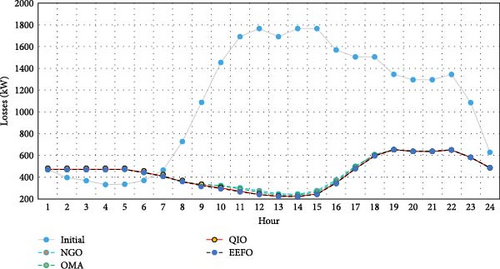
Figure 7 provides a close look at the hourly variations in minimum and maximum operating voltages within the test system, comparing performance with and without the EEFO optimization algorithm. A noticeable improvement in minimum voltage levels is evident with the application of the EEFO algorithm. Initially, the system faced issues with voltage levels frequently falling below the permitted minimum, reaching a critical low of 0.642 p.u. at hour 12. This resulted in several problems, including excessive voltage deviations, increased active power losses, poor overall system quality, and customer dissatisfaction. These issues were further aggravated by aging infrastructure, extensive network length, and high load demands, leading to ~29% power losses and 30% voltage regulation. In contrast, after implementing the proposed technique and strategically placing PV and CB units, the hourly maximum operating voltages exhibit a slight increase. This improvement is primarily due to better reactive power compensation, though the voltages remain below the maximum allowable limit of 1.1 p.u. for this aerial distribution system. This underscores the positive impact on power quality achieved through the implementation of the proposed technique-based EEFO algorithm, which not only optimizes energy losses but also significantly improves power quality, aligning with the critical goal of customer satisfaction.
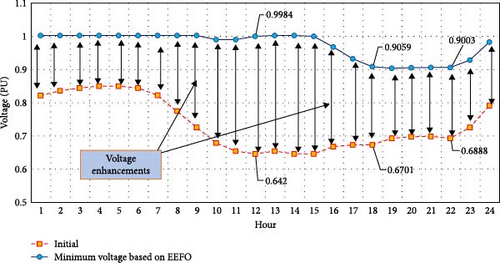
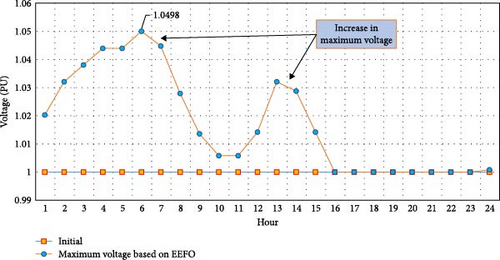
Figure 8 provides a detailed comparison of hourly grid-supplied power, contrasting the effects of the EEFO optimization technique implementation with the initial case that lacks PV and CB units. The results demonstrate a substantial reduction in supplied energy from the main grid, amounting to 37.31 MW per day. Specifically, the energy supplied decreased from 121.785 to 84.475 MW, representing a significant 30.64% decrease.
To assess the performance of the proposed technique-based EEFO algorithm, Table 3 presents a comparative study of the EEFO algorithm against other reported results for the first test system based on daily energy losses. As shown in Table 3, QIO, ASAA, DA, NGO, COA, OMA, OOA, and SAA [66] result in higher energy losses compared to the proposed technique-based EEFO algorithm. The EEFO achieves the lowest energy losses, recording 10,331.06 kWday.
| Applied algorithms | Daily energy losses (kWday) | Percentage improvement |
|---|---|---|
| EEFO | 10,331.06 | — |
| QIO | 10,467.19 | 1.30% |
| ASAA | 10,554.05 | 1.91% |
| DA | 10,653.42 | 2.01% |
| NGO | 10,660.27 | 3.09% |
| COA | 10,715.77 | 3.59% |
| OMA | 10,798.92 | 4.33% |
| OOA | 10,964.46 | 5.78% |
| SAA | 11,369.16 | 9.13% |
4.2. Second Test System (Standard IEEE 69-Distribution Test System)
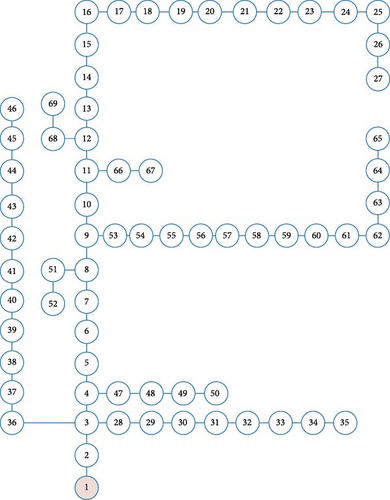
The second case explores the application of the proposed technique-based EEFO algorithm to a standard IEEE 69-bus distribution test system. This system includes 68 lines and 69 nodes, as shown in Figure 9. Under nominal load conditions, the total real and reactive power demands are 3802 kW and 2694 kVAr, respectively.
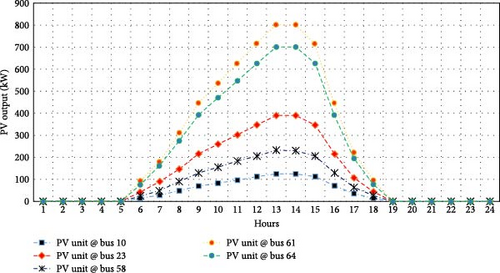
In this case, the results of the NGO, OMA, and QIO algorithms are summarized, as well as the proposed EEFO algorithm in Table 4. The EEFO approach recommends the installation of PV units at five specific buses (10, 23, 58, 61, and 64), with a size of 138 kW, 891 kW, 433 kW, 259 kW, and 780 kW, respectively. Additionally, it identifies five buses (18, 28, 50, 62, and 67) for CBs installation, with corresponding sizes of 300, 100, 400, 400, and 1200 kVAr. Figure 10 depicts the hourly output power of PV units at these selected buses under the EEFO strategy. The findings reveal that the EEFO algorithm outperforms the NGO, OMA, and QIO methods, achieving the lowest energy losses at 1343.05 kWday, improving by 0.54% over NGO, 8.54% over OMA and 0.30% over QIO.
| Applied technique | NGO | OMA | QIO | EEFO | ||||
|---|---|---|---|---|---|---|---|---|
| Size | Location | Size | Location | Size | Location | Size | Location | |
| PV units | 90 kW | Bus-13 | 509 kW | Bus-18 | 344 kW | Bus-17 | 138 kW | Bus-10 |
| 101 kW | Bus-27 | 94 kW | Bus-34 | 216 kW | Bus-23 | 891 kW | Bus-61 | |
| 940 kW | Bus-61 | 656 kW | Bus-59 | 568 kW | Bus-58 | 433 kW | Bus-23 | |
| 981 kW | Bus-63 | 609 kW | Bus-64 | 800 kW | Bus-62 | 259 kW | Bus-58 | |
| 286 kW | Bus-65 | 636 kW | Bus-65 | 604 kW | Bus-63 | 780 kW | Bus-64 | |
| CB units | 200 kVAr | Bus-5 | 200 kVAr | Bus-26 | 600 kVAr | Bus-10 | 300 kVAr | Bus-50 |
| 200 kVAr | Bus-6 | 500 kVAr | Bus-29 | 100 kVAr | Bus-19 | 100 kVAr | Bus-19 | |
| 300 kVAr | Bus-21 | 100 kVAr | Bus-33 | 200 kVAr | Bus-49 | 400 kVAr | Bus-67 | |
| 200 kVAr | Bus-60 | 200 kVAr | Bus-47 | 100 kVAr | Bus-52 | 400 kVAr | Bus-28 | |
| 900 kVAr | Bus-61 | 1400 kVAr | Bus-61 | 900 kVAr | Bus-61 | 1200 kVAr | Bus-62 | |
| Daily energy losses (kWday) | 1350.36 | 1468.48 | 1347.12 | 1343.05 | ||||
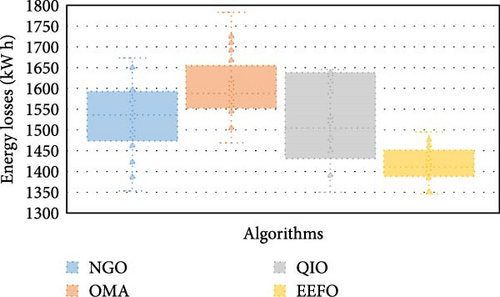
In this analysis, Figure 11 illustrates the daily energy losses (kWday) achieved by the NGO, OMA, QIO, and EEFO algorithms across multiple runs. Table 5 presents a detailed comparison of performance metrics of the NGO, OMA, QIO, and EEFO algorithms, including the statistical indicators of daily energy losses. The EEFO algorithm consistently demonstrates superior performance, with the lowest average energy losses recorded at 1414.091 kWday. This represents a 7.97% reduction in energy losses compared to NGO, an 11.78% reduction compared to OMA, and a 5.92% reduction compared to QIO, which have average daily energy losses of 1533.64, 1602.84, 1503.06, and 1533.64 kWday, respectively. Even in the worst-case scenarios, EEFO outperforms the other algorithms, achieving the lowest energy losses at 1493.681 kWday as compared with 1673.947, 1785.907, and 1646.042 for NGO, OMA, and QIO, respectively.
| Applied technique | NGO | OMA | QIO | EEFO | |
|---|---|---|---|---|---|
| Energy losses/day (kWday) | Best | 1350.359 | 1468.478 | 1347.124 | 1343.055 |
| Mean | 1533.636 | 1602.843 | 1503.061 | 1414.091 | |
| Worst | 1673.947 | 1785.907 | 1646.042 | 1493.681 | |
| STD | 91.432 | 78.136 | 101.824 | 43.064 | |
Figure 12 shows the daily energy losses using the PV and CB units selected by the proposed EEFO algorithm, compared to the initial case with no compensation. The most significant reductions in power losses occur during peak daylight hours (12–15), with an average decrease of 96.43%. Additionally, the EEFO algorithm achieves average power loss reductions of 52.63% during nighttime hours (19–24) and 29.80% during early morning hours (1–5).
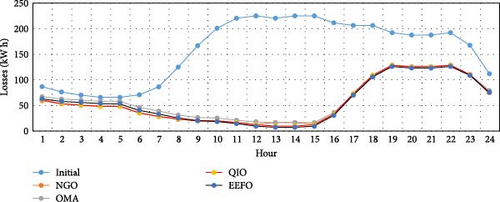
Figure 13 highlights the hourly variations in the system’s minimum and maximum operating voltages, comparing the EEFO algorithm’s performance with the initial condition. Notably, there is a significant improvement in minimum voltage levels across all operating hours. Also, the proposed technique effectively maintains the maximum voltage values within a limit of 1 p.u., ensuring good voltage regulated throughout the day hours despite varying load conditions and changes in solar irradiance. This demonstrates the positive effect of the EEFO algorithm on power quality, which is crucial for optimizing energy losses. Ultimately, the improved voltage stability aligns with the important objective of enhancing customer satisfaction.
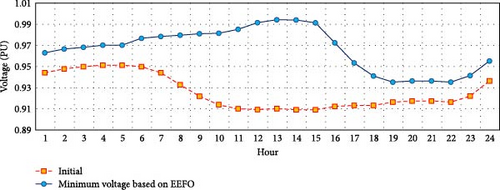
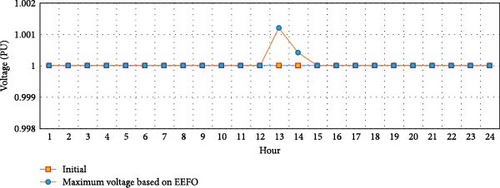
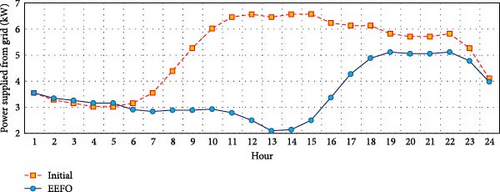
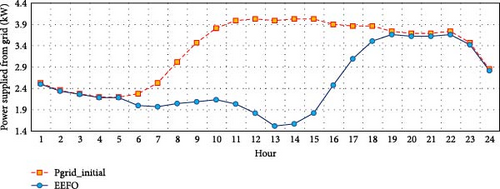
Figure 14 shows the hourly grid-supplied power for both the proposed EEFO algorithm and the initial case without any compensation. It is clear that there is a significant reduction in energy supplied, with a daily decrease of 19.198 MW. Specifically, the energy supplied drops from 79.432 to 60.234 MW, representing a substantial 24.17% reduction compared to the initial case.
To assess the performance of the proposed technique-based EEFO algorithm, Table 6 presents a comparative study of the EEFO algorithm against other reported results for the first test system based on daily energy losses. As shown in Table 6, OMA, ASAA, DA, NGO, OOA, Coati, and SAA [66] result in higher energy losses compared to the proposed technique-based EEFO algorithm. The EEFO achieves the lowest energy losses, recording 1343.055 kWday.
| Applied algorithms | Daily energy losses (kWday) | Percentage improvement |
|---|---|---|
| EEFO | 1343.055 | — |
| QIO | 1347.124 | 0.30 |
| OMA | 1350.359 | 0.54 |
| ASAA | 1359.820 | 1.23 |
| DA | 1437.589 | 6.58 |
| NGO | 1468.478 | 8.54 |
| OOA | 1662.829 | 19.23 |
| Coati | 1773.138 | 24.26 |
| SAA | 1962.269 | 31.56 |
4.3. Third Test System (Qaha Nawa Egyptian Distribution System)
The third case study analyzed in this research corresponds to a real-world distribution network located in Qaha Nawa, situated within the Qalyubia Governorate of Egypt. This feeder system, illustrated in Figure 15, is composed of 57 buses connected by 56 distribution lines, and it operates at a nominal voltage level of 11 kV. Under peak load conditions, the system experiences a total active power demand of 6.754 MW and a reactive power demand of 3.271 MVAr.
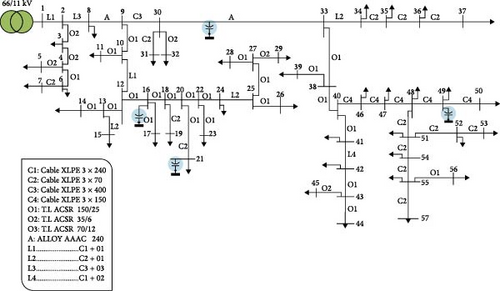
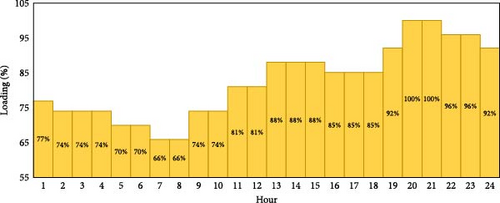
This feeder incurs real power losses of 1.781 MW, and the lowest voltage level is recorded at bus 57, reaching a minimum of 0.7439 PU, which highlights the need for voltage support and loss reduction measures. In this system, a diesel-based DG unit with a capacity of 1000 kW is connected at bus 55, as documented in prior studies [39] which operates at a unity power factor. Additionally, four CBs, each rated at 150 kVA, have been preinstalled by the Egyptian distribution system operators. These are strategically placed at nodes 16, 21, 30, and 49 to assist in reactive power compensation and voltage profile enhancement. This feeder has a distinct load pattern, as indicated by Nasef et al. [39], which is displayed in Figure 16.
In this case, Table 7 presents a comparative summary of the optimization outcomes achieved using the NGO, OMA, and QIO algorithms alongside the proposed EEFO method. According to the EEFO-based optimization, PV units are optimally allocated at buses 15, 36, 43, 49, and 52, with respective capacities of 794, 699, 786, 658, and 898 kW. Simultaneously, the algorithm recommends the deployment of CBs at buses 7, 35, 38, 39, and 47, with corresponding reactive power ratings of 400 kVAr, 1100 kVAr, 1600 kVAr, 800 kVAr, and 1100 kVAr, respectively. The simulation results clearly demonstrate that the EEFO algorithm significantly surpasses the performance of the competing techniques. It achieves the lowest total energy losses, recorded at 10,682.05 kWday, marking an improvement of 2.38% over NGO, 4.68% over OMA, and 1.14% over QIO. These outcomes affirm the superior capability of the EEFO algorithm in effectively minimizing distribution losses through the optimal coordination of PV and CB placements.
| Applied technique | NGO | OMA | QIO | EEFO | ||||
|---|---|---|---|---|---|---|---|---|
| Size | Location | Size | Location | Size | Location | Size | Location | |
| PV units | 595 kW | Bus-25 | 862 kW | Bus-28 | 535 kW | Bus-21 | 794 kW | Bus-15 |
| 698 kW | Bus-29 | 485 kW | Bus-34 | 646 kW | Bus-37 | 699 kW | Bus-36 | |
| 728 kW | Bus-31 | 930 kW | Bus-35 | 976 kW | Bus-39 | 786 kW | Bus-43 | |
| 550 kW | Bus-44 | 984 kW | Bus-53 | 614 kW | Bus-42 | 658 kW | Bus-49 | |
| 907 kW | Bus-52 | 730 kW | Bus-53 | 898 kW | Bus-52 | |||
| CB units | 2400 kVAr | Bus-33 | 500 kVAr | Bus-25 | 1000 kVAr | Bus-30 | 400 kVAr | Bus-7 |
| 800 kVAr | Bus-37 | 500 kVAr | Bus-31 | 1200 kVAr | Bus-35 | 1100 kVAr | Bus-35 | |
| 600 kVAr | Bus-46 | 1300 kVAr | Bus-34 | 1300 kVAr | Bus-40 | 1600 kVAr | Bus-38 | |
| 1000 kVAr | Bus-56 | 300 kVAr | Bus-38 | 700 kVAr | Bus-46 | 800 kVAr | Bus-39 | |
| — | 2600 kVAr | Bus-49 | 900 kVAr | Bus-48 | 1100 kVAr | Bus-47 | ||
| Daily energy losses (kWday) | 10,936.29 | 11,182.27 | 10,803.6 | 10,682.05 | ||||
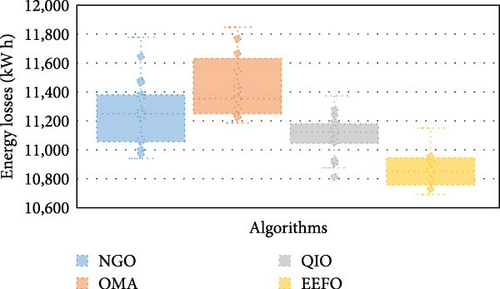
In this analysis, Figure 17 visualizes the daily energy losses (kWday) attained by the NGO, OMA, QIO, and EEFO algorithms over multiple execution runs. Complementing this, Table 8 offers a comprehensive performance comparison based on their key statistical indicators. Among the evaluated techniques, the EEFO algorithm consistently exhibits superior optimization capability, yielding the lowest average energy losses at 10,853.02 kWday. This corresponds to a reduction of 3.69% compared to NGO (11,253.61 kWday), 5.23% compared to OMA (11,420.65 kWday), and 2.27% compared to QIO (11,099.46 kWday). Even under the worst-case scenario, EEFO maintains its dominance by achieving the lowest maximum loss value of 11,147.68 kW·day, whereas the respective worst-case values for NGO, OMA, and QIO are 11,780.72, 11,854.54, and 11,372.52 kW·day. This demonstrates that EEFO outperforms its counterparts by 5.68%, 6.34%, and 2.02%, respectively, in the least favorable scenarios—affirming both the robustness and reliability of the proposed method.
| Applied technique | NGO | OMA | QIO | EEFO | |
|---|---|---|---|---|---|
| Energy losses/day (kWday) | Best | 10,936.29 | 11,182.27 | 10,803.6 | 10,682.05 |
| Mean | 11,253.61 | 11,420.65 | 11,099.46 | 10,853.02 | |
| Worst | 11,780.72 | 11,854.54 | 11,372.52 | 11,147.68 | |
| STD | 224.3689 | 208.2338 | 139.4322 | 115.1216 | |
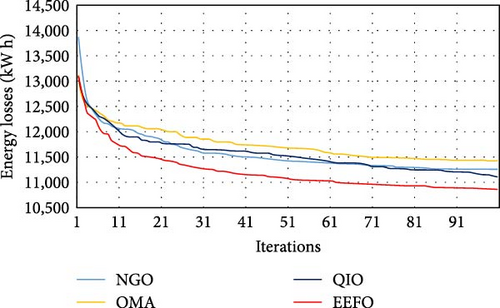
Figure 18 shows the average convergence curves of the NGO, OMA, QIO, and EEFO for the third test system. As shown, the proposed EEFO shows substantial converging behavior compared to the others.
Also, for this system, Table 9 shows the time complexity, elapsed time (s), and memory usage (MB) of the applied techniques. As shown, all algorithms face the same order of time complexity since they are applied in similar circumstances as the number of iterations is 100, the population size is 30, and the dimensionality of the problem is 20. But practical execution time varies depending on internal operations, function calls, and optimization heuristics. The EEFO is the most balanced, achieving strong performance with acceptable memory overhead. QIO is time-efficient but slightly less effective in solution quality (based on earlier results). OMA, while frugal on memory, suffers from excessive runtime. NGO performs decently on both fronts but does not outperform EEFO or QIO.
| Algorithm | Time complexity | Elapsed time (s) | Memory usage (MB) | Relative efficiency |
|---|---|---|---|---|
| EEFO | O (60,000) | 427.46 | 1861 | Best balance |
| QIO | O (60,000) | 408.26 | 1831 | Fastest but slightly less accurate |
| NGO | O (60,000) | 846.53 | 1814 | Slower, average memory |
| OMA | O (60,000) | 1054.93 | 1807 | Slowest but low memory |
Figure 19 shows the power losses in each hour using the PV and CB units selected by the proposed EEFO algorithm, compared to the initial case with no compensation. The most significant reductions in power losses occur during peak daylight hours (13–15), with an average decrease of 82.21%. Additionally, the EEFO algorithm achieves average power loss reductions of 54.44% during nighttime hours (19–24) and 32.16% during early morning hours (1–5).
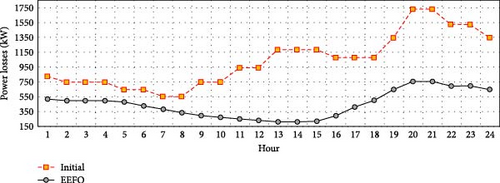
Figure 20 highlights the hourly variations in the system’s minimum operating voltages, comparing the EEFO algorithm’s performance with the initial condition. There is a significant improvement in minimum voltage levels across all operating hours, where all the violated voltages are corrected to be within the 10% permissible bound.
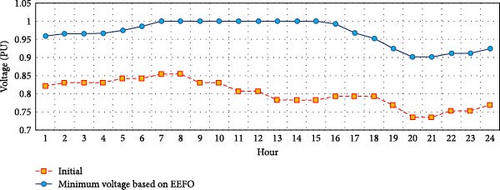
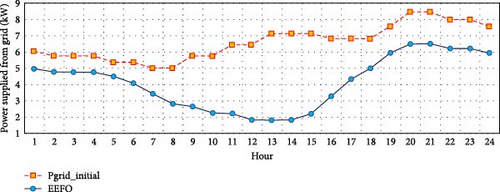
Figure 21 shows the hourly grid-supplied power for both the proposed EEFO algorithm and the initial case without any compensation. There is a significant reduction in energy supplied, with a daily decrease of 59.41 MW. Specifically, the energy supply dropped from 158.1046 to 98.693 MW.
4.4. Discussion on the Enviromental Reductions in CO2 Emissions
In the context of evaluating the environmental and operational benefits of the proposed EEFO-based technique across various electrical distribution test systems, a comprehensive analysis reveals substantial reductions in power supplied from conventional main grid sources, resulting in noteworthy environmental improvements. These benefits are further magnified when considering a long-term operational horizon, such as the typical 20-year lifecycle of PV systems.
For the 37-bus Egyptian distribution system, the implementation of the EEFO-based optimization technique results in a marked decrease in dependency on conventional power plants. This shift directly translates into a significant reduction in the energy drawn from the main grid. Specifically, the CO2 emissions, assuming a grid emission factor of 910 kgCO2 per MW of generated electricity [18], are reduced from an initial 110,824.35 to 76,872.25 kgCO2. This corresponds to a 30.64% reduction in emissions, clearly indicating the environmental advantage of the proposed strategy.
When this emission reduction is projected over the standard 20-year operational lifespan of the PV systems, the cumulative environmental savings become even more pronounced. Assuming similar daily operations, this reduction translates to an approximate lifecycle CO2 mitigation of 247.6 metric tons, emphasizing the long-term sustainability benefits. In addition to optimizing energy losses and improving grid efficiency, the EEFO algorithm thereby contributes meaningfully to climate change mitigation by substantially lowering the environmental footprint of power distribution.
In the case of the IEEE 69-bus system, the application of the EEFO-based methodology achieves similarly positive outcomes. As depicted in Figure 14, the daily energy supplied from the main grid is significantly curtailed, decreasing from 79.432 to 60.234 MW, a difference of 19.198 MW. This equates to a 24.17% reduction in grid dependency. This reduction in energy supplied from conventional sources leads to a corresponding decline in carbon emissions from 72,283.12 kgCO2 in the base case to 54,812.94 kgCO2 postoptimization. This represents an impressive 24.03% drop in CO2 emissions. Projected over 20 years, this reduction amounts to ~127.4 metric tons of CO2 avoided, reinforcing the long-term environmental value of deploying such optimized renewable integration strategies in distribution networks.
In the Qaha Nawa distribution system, the impact of EEFO-based integration is even more dramatic. As shown in Figure 21, the energy supplied by the main grid is reduced from 158.1046 to 98.693 MW, achieving a daily reduction of 59.41 MW, which corresponds to a 37.58% decrease. This significant reduction leads to a proportional decline in carbon emissions from 143,875.186 kgCO2 down to 92,380.0038 kgCO2, marking a 35.79% reduction. Over a 20-year lifespan, this translates to a cumulative lifecycle emissions reduction of ~374.9 metric tons of CO2, showcasing the exceptional environmental potential of the proposed optimization framework when applied to large-scale practical systems.
5. Conclusions
This paper introduces the EEFO algorithm as an advanced technique for enhancing the operation and performance of distribution systems. Designed to optimize the allocation of renewable PV systems and CB units, the EEFO algorithm aims to reduce energy losses within electrical distribution networks while improving power quality and significantly reducing carbon emissions. The study also addresses practical considerations, including fluctuations in customer power loadings, energy production from renewable PV sources, and the discrete characteristics of CBs. Comprehensive numerical analyses and comparisons with other algorithms, such as NGO, OMA, and QIO, demonstrate the superior performance of EEFO. The algorithm’s enhanced performance in distribution systems and its environmental benefits make it a notable advancement in optimization and sustainable energy management. Future research could explore additional applications of EEFO in various optimization contexts and further examine its environmental impacts for a more detailed evaluation.
Ethics Statement
The authors have nothing to report.
Conflicts of Interest
The authors declare no conflicts of interest.
Funding
This study is supported via funding from Prince Sattam bin Abdulaziz University project number (PSAU/2024/01/29327).
Acknowledgments
The authors extend their appreciation to Prince Sattam bin Abdulaziz University for funding this research work through the project number (PSAU/2024/01/29327).
Open Research
Data Availability Statement
The data that support the findings of this study are available from the corresponding author upon reasonable request.


