Conceptual Design of a Micro Nuclear Energy System With Integrated Heat Pipe Cooled Reactor and Molten Salt Heat Storage
Abstract
Micro nuclear energy system has the advantages of low investment and flexible deployment, which contribute to wide application prospects. However, in comparison to the large nuclear power plants, micro nuclear energy system is situated closer to users and requires higher safety performance. This paper proposes a new conceptual design of a micro nuclear energy system with high thermal inertia. It is based on a heat pipe cooled reactor and an integrated heat storage system along with a supercritical carbon dioxide (SCO2) Brayton cycle. The system can achieve 34.45% energy conversion efficiency and 1.2 MW electric power output. A heat pipe cooled reactor with uranium dioxide (UO2) fuel and sodium heat pipe was designed. It was connected by the condensation section of heat pipes to a molten salt heat storage system. The SCO2 Brayton cycle was used to ensure a compact system layout. Using a newly developed analysis platform, three transient conditions including the load reduction, reactivity insertion, and loss of heat sink were discussed. The results indicate that, with the intermediate heat storage, the micro nuclear energy system has better tolerance of the transient thermal shocks. The peak temperature in the core is reduced for all conditions. Particularly in the process of loss of heat sink, the peak temperature in the core can be reduced by more than 70 K.
1. Introduction
Nuclear energy is recognized as one of the most significant sources of clean energy globally. Compared to large reactors, small modular reactors (SMRs) offer numerous advantages, including reduced construction period and investment, and flexible deployment options [1–3]. Consequently, SMRs present a wide array of potential applications, such as seawater desalination, hydrogen production, district heating, and the provision of stable and reliable power to remote regions [4, 5].
At present, SMRs include the heat pipe cooled reactors, gas-cooled reactors, liquid metal-cooled reactors, pressurized water reactors, and molten salt reactors [6–12]. Among them, the reactors with electric power ranging from 1 to 10 MW or even lower are called microreactors. Most of microreactors can be housed in standard 20- or 40-foot containers and transported to their designated locations by land or other means [13], which show great flexibility for multipurpose application.
Micro nuclear energy systems encompass a variety of reactor types, with the heat pipe cooled reactor emerging as a notably appealing option that has undergone development both domestically and internationally. Heat pipes operate based on fundamental and reliable physical principles, including capillary action, boiling, and condensation, which contribute to their inherent safety. The utilization of heat pipes for heat removal from reactor core mitigates the risks associated with loss of coolant accidents and loss of flow incidents.
The mega power system [14], engineered by the Los Alamos National Laboratory, is based on a heat pipe cooled reactor and has 1–10 MWe power output. This reactor is linked to an open-air Brayton power conversion system, thereby enabling its integration into the existing power infrastructure. The Westinghouse Electric Company developed a new heat pipe cooled reactor system eVinci [15, 16], which has electric power output ranging from 200 to 5 MW and is compatible with low-enriched uranium microreactor cores. The MNPS-1000 represents a conceptual design based on a heat pipe cooled reactor coupled with a combined-cycle energy conversion system, developed by the China Academy of Engineering Physics and Tsinghua University [17]. This system was designed to produce 1 MW of electric power, utilizing a combined cycle approach that integrates an open-air Brayton cycle with a closed Rankine cycle to achieve the cascaded utilization of thermal energy.
Up to now, the energy conversion technologies for the micro nuclear energy systems have been primarily classified into two categories as the static conversion and the dynamic conversion. The static energy conversion is in limited use for its low conversion efficiency [18, 19]. More energy systems applied the dynamic energy conversion based on the Rankine [20], Brayton [21], or Stirling cycles [22]. Compare to other forms, the supercritical carbon dioxide (SCO2) Brayton cycle requires significantly less space [23]. The advantages of SCO2 Brayton cycle arise from the distinctive thermophysical properties of its working medium. Specifically, CO2 possesses a critical pressure of 7.38 MPa and a low critical temperature of 304.2 K, resulting in a density that is considerably higher than that of alternative gases, such as helium and nitrogen [24]. At equivalent power levels, the volume required for the SCO2 Brayton cycle is merely 1/10 of that needed for the steam Rankine cycle [25]. Furthermore, CO2 exhibits high heat transfer capabilities near its critical point. Certain configurations can achieve thermal efficiencies exceeding 40% [26, 27]. Therefore, it is evident that the advantages of the SCO2 Brayton cycle render it particularly suitable for the micro nuclear systems.
Compared to traditional large nuclear power plants, the micro nuclear energy systems are closer to the users and requires higher safety performance. However, the reactor and the energy conversion system are tightly coupled in a compact space, which causes the influence of thermal shock in the reactor core and energy conversion system must not be overlooked. Besides, most micro nuclear reactors are designed to have fast neutron spectrum, which have small negative reactivity feedback. The unexpected disturbance of the control system may result in more pronounced temperature variations, thereby posing potential risks to core damage.
Large thermal capacity and thermal inertia in a nuclear energy system has better thermal shock tolerance. For example, the pool type reactors have good safety performance due to their large thermal inertia. But it is hard to be referred for the microreactors for their compact size. New researches are paying attention to other ways to enhance the thermal inertia of nuclear energy system by using the heat storage. Westinghouse [28] developed a sensible heat energy storage system for light water reactors, which utilized the concrete for heat storage. The steam recovered during the heat storage process can be utilized either for the main steam turbine generator of the reactor or for the steam in the feed water heater. This system operates independently of the secondary loop and does not directly participate in heat exchange between the primary and secondary loop. Federal University of Santa Catarina developed a combined system of SCO2 Brayton cycle and independent heat storage [29]. During the operation, a portion of the high-temperature SCO2 fluid is diverted to the heat storage system. When additional heat is needed, the storage system heats part of the SCO2 fluid to assist in increasing the system’s output power.
This paper presents a new conceptual design of micro nuclear energy system, which is based on a heat pipe cooled reactor and an integrated heat storage system. The proposed system was designed to operate at full power of 3.5 MWt and achieve 34.4% energy conversion efficiency. Between the reactor and the secondary loop, a heat storage system was designed. Compared with the independent heat storage devices of Westinghouse and Santa Catarina Federal University, the molten salt material greatly reduces the storage volume and promotes the miniaturization of the system. Furthermore, the intermediate system significantly enhances the thermal inertia of the whole energy system, thereby making it tolerant to the thermal transients and reducing the impact of thermal shock. The enhanced inherent safety features and strong adaptability of the system can meet the requirements of new nuclear power applications.
2. Overview of the System and Analysis Models
2.1. Overview of the System
This paper seeks to integrate the heat storage into a micro nuclear energy system to enhance its thermal inertia, thereby tolerating the risk from thermal shock and improving the reactor core safety.
The operational principle of the micro nuclear energy system is illustrated in Figure 1. The system comprises three primary subsystems: the nuclear reactor system, the heat storage system, and the energy conversion system.
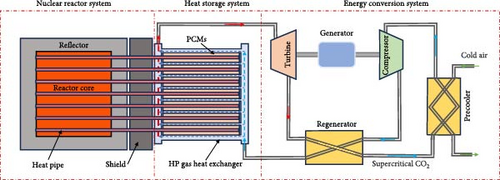
The reactor employs the high-temperature heat pipes for heat transfer, which enhances its reliability for core cooling. The heat pipes exhibit highly efficient heat transfer capabilities. The alkalis within the heat pipe evaporates at the heating section and subsequently condenses at the condensation section, utilizing capillary action for fluid migration.
The heat storage system adopts Phase Change Materials (PCMs) for their large latent heat of phase change. These PCMs are incorporated within the heat exchanger, where the heat pipe transfers the heat generated by the reactor into the PCMs. The working fluid of the secondary loop circulates through the heat exchanger, removing heat from the PCMs. During the heat transfer process from the heat pipe to the working fluid of the secondary loop, the PCMs store a portion of heat by the phase change.
The energy conversion system is based on the SCO2 Brayton cycle. Such system presents distinct advantages due to its compact configuration, reduced equipment dimensions, and elevated cycle efficiency. In this configuration, the high-pressure SCO2 is directed through a heat exchanger, where it is heated to the appropriate temperature prior to entering the turbine, thereby driving the generator to produce electric energy. The system employs the atmosphere as the ultimate heat sink.
2.2. Models in the Design and Analysis
To model and simulate the performance of the proposed system, a new simulation platform named as DAISYSYS was developed. It consists of four main modules to simulate the behavior of nuclear reactor, heat pipes, heat storage system, and energy conversion system. The point kinetics model [30] was employed in the reactor module to simulate the core cooled by heat pipes. The heat storage module was based on the one-dimensional phase change heat transfer mechanism. The components of the energy conversion system were represented by a series of lumped models. These modules were first demonstrated in this section before they were used in the following analysis.
2.2.1. Heat Pipe Module Validation
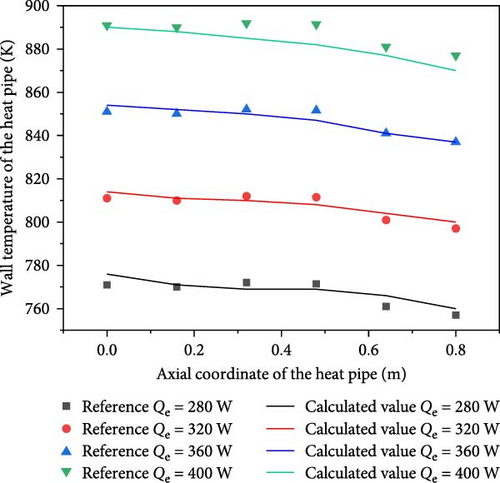
The validation of heat pipe model was performed by comparing it with Faghri’s sodium heat pipe experimental data [31]. The primary parameters of the heat pipe are detailed in Table 1. Comparison of the heat pipe wall temperature at various heating power levels are made in Figure 2. The calculated values agree well with the experimental data, with a maximum error less than 1%.
| Parameters | Value |
|---|---|
| Outer/inner wall radius (m) | 0.014–0.012 |
| Length of evaporation zone/adiabatic zone/condensation zone (m) | 0.2–0.35–0.25 |
| Heat pipe wall material/working fluid | HAYNES 233/Na |
| Heat transfer in condensation zone | Radiation + natural convection |
| Liquid absorption core permeability | 0.9875 |
2.2.2. Phase Change Heat Transfer Module Validation
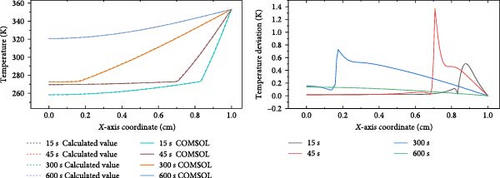
The solid–liquid phase change heat transfer module was verified against a benchmark published by the COMSOL Inc [32]. The melting process of 1 cm thick ice was simulated, which are introduced in Table 2. It is a one-dimensional case. The initial temperature of ice is 265.15 K. The boundary conditions are adiabatic on one side and fixed to 353.15 K at the other side. The transient process was simulated during 600 s as illustrated in Figure 3. The temperature distributions at 15, 45, 300, and 600 s are compared. The maximum temperature deviation is 1.4 K near the phase interface.
| Material properties | Ice (temperature: 265.15 K) |
Water (temperature: 300.15 K) |
|---|---|---|
| Density (kg/m3) | 918 | 997 |
| Constant pressure heat capacity (J/[kg·K]) | 2025 | 4179 |
| Thermal conductivity (W/[m·K]) | 2.31 | 0.613 |
| Latent heat of fusion (kJ/kg) | 333.5 | — |
2.2.3. Energy Conversion Module Verification
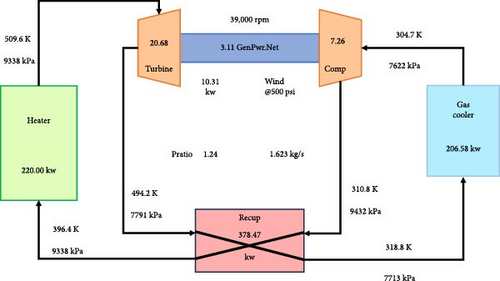
The energy conversion module was verified against the results from the Sandia Laboratory’s report [33]. The simulated system is shown in Figure 4. To validate the accuracy of the module calculations, the outlet parameters were derived from the inlet parameters and the design conditions of each component. The key parameters of the system are compared in Table 3. The results agree well with the reference results.
| Parameter name | Reference value | Calculated value | Deviation (K) |
|---|---|---|---|
| Compressor inlet temperature (K) | 304.7 | 304.7 | — |
| Compressor outlet temperature (K) | 310.8 | 310.6 | 0.2 |
| Heater inlet temperature (K) | 396.4 | 396.4 | — |
| Turbine inlet temperature (K) | 509.6 | 509.7 | 0.1 |
| Turbine outlet temperature (K) | 494.2 | 494.9 | 0.7 |
| Cooler inlet temperature (K) | 318.8 | 318.6 | 0.2 |
3. Conceptual Design of the System
3.1. The Reactor Design
A heat pipe cooled reactor was proposed in the micro nuclear energy system that providing 3.5 MWt thermal power. The reactor features a compact configuration, which includes a circular beryllium reflector surrounding the active zone. The space between the reflector layer and the active core is filled with specially shaped beryllium oxide blocks, which serve to minimize the neutron leakage from the core. The core layout is shown in Figure 5. The dark blue region in the diagram denotes the heat pipe, while the light blue region signifies the fuel rods. The dark gray area represents the silicon carbide matrix, the light gray area is beryllium oxide, and the yellow area indicates the control rods. The active zone consists of 31 fuel assemblies, with the active height of 700 and 50 mm for the upper and lower reflectors, respectively. One side of the core is the control rods and their associated drive mechanism, and the other side is the protruding heat pipes.

The fuel assembly is in a hexagonal shape, as shown in Figure 6. In a standard fuel assembly, there are 12 heat pipes and 25 fuel rods. The heat pipes are 2000 mm in length with 700 mm heating section in the active core. The control rod has a Y-shaped structure and is inserted in the central guide tube of the fuel assembly.
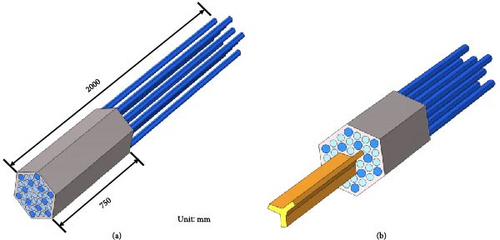
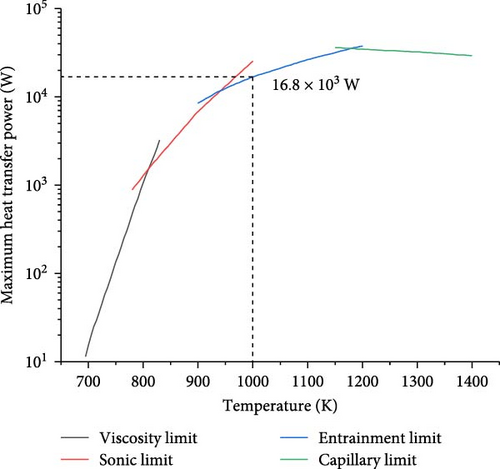
The uranium dioxide (UO2) fuel is loaded and the cladding material is stainless steel. The control rods use boron carbide (B4C) as the neutron-absorbing material. The heat pipes are sodium heat pipes. Each heat pipe has a rated power approximately 10.8 kW and a diameter of 28 mm. Sodium, serving as the working fluid for these heat pipes, exhibits good stability at high temperatures and low saturation vapor pressure [34]. The heat pipe design is based on the parameters of the wire mesh sodium heat pipe from Liu et al. [35]. In this reference, the temperature-dependent heat transfer limit analysis reveals that entrainment and capillary limits prevail above 1000 K (Figure 7). The heat transfer limit corresponding to 1000 K in the Figure 7 is 16.8 kW. In the system of this paper, the heat pipes operate above 1000 K, and the single heat pipe power (10.8 kW) remains well below the heat transfer limit. The reactor core has a total of 372 heat pipes.
3.2. The Heat Storage Exchanger Design
3.2.1. Structure of Heat Storage Exchanger
The heat storage exchanger should not only achieve high heat transfer efficiency but also possess substantial thermal capacity to ensure thermal inertia. PCMs, due to their substantial latent heat, can provide a large thermal capacity with a minimal quantity. Research has been conducted on heat pipe receivers integrated with latent heat storage in the solar space power systems, exemplifying the effective combination of PCMs and heat pipes [36].
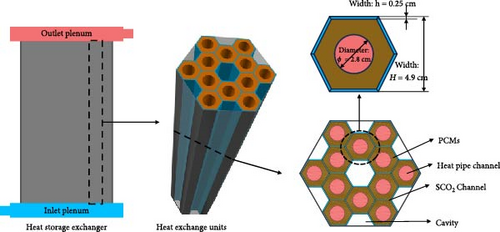
Figure 8 shows a schematic diagram of the heat storage exchanger’s structure. The heat exchanger was designed to be modular, consisting of 32 heat exchange units. Each unit is specifically tailored to align with a fuel assembly, containing 12 heat pipe channels for the heat pipes. The surfaces of heat pipe channels are coated with a layer of PCMs, while the SCO2 flow channels are situated outside the PCM. The heat exchange units are placed within a hexagonal steel shell, with each unit operating independently to prevent the leakage of the PCM. To accommodate the material expansion, cavities are reserved within each heat exchange unit. The SCO2 enters through the inlet plenum and is distributed into each channel. After being heated in the heat exchanger, it is mixed in the outlet plenum.
3.2.2. Selection of PCM
The selection of PCM is critical for the nuclear energy system. First, the melting point of PCM must align with the operational requirement, typically situated between the temperatures of the heat source and heat sink. Second, the latent heat of phase change of the PCMs should be correlates with a larger quantity of heat stored per unit mass. In addition, it is essential to consider the thermal stability, thermal conductivity, and compatibility of PCMs with other substances.
The melting points of inorganic salts typically range from 423.15 to 1173.15 K, rendering them suitable for medium to high-temperature applications. The melting point can be adjusted through the selection of varying component ratios in the mixed salts, which allows for the optimization of working temperatures or the enhancement of latent heat during phase change.
The operational temperature range for heat pipe is approximately 773.15 to 1273.15 K, while the inlet temperature of SCO2 in the heat exchangers is around 673.15 K. Table 4 lists some common mixed salts at temperatures exceeding 673.15 K. Based on the requirements of system, lithium hydroxide–lithium fluoride (LiOH–LiF; 78.7 : 21.3) was selected as the candidate heat storage material, which has the melting point of 700.15 K and the latent heat of phase change of 1163 kJ/kg.
| Material | Composition (wt%) | Phase change temperature (K) | Phase change latent heat (kJ/kg) |
|---|---|---|---|
| LiOH/LiF | 78.7/21.3 | 700.15 | 1163 |
| LiF/CaF2 | 80.5/19.5 | 1040.15 | 790 |
| LiF/MgF2 | 67/33 | 1019.15 | 947 |
| LiF/MgF2/KF | 64/30/6 | 983.15 | 782 |
| KF/LiF/NaF | 59/29/12 | 736.15 | 442 |
| MgCl2/KCl | 64/36 | 743.15 | 388 |
| MgCl2/CaCl2/KCl | 48/27/25 | 760.15 | 342 |
| CaCl2/NaCl | 67/33 | 773.15 | 281 |
| MgCl2/NaCl | 52/48 | 723.15 | 430 |
| CaCl2/MgCl2/NaCl | 21.3/38.7/40 | 702.15 | 192 |
| K2CO3/Li2CO3/Na2CO3 | 30/40/30 | 680.15 | 197 |
| K2CO3/Li2CO3/Na2CO3 | 40/50/10 | 700.15 | 146 |
3.2.3. Enhanced Heat Transfer Measure
Although inorganic salts possess a substantial latent heat of phase change, their thermal conductivity is very low. Consequently, filling a heat exchange unit with a limited quantity of inorganic salt may result in unacceptable thermal resistance. To ensure that the heat exchanger maintains adequate heat exchange capacity, it is essential to implement appropriate heat transfer enhancement strategies. Currently, three primary methods for enhancing heat transfer in PCMs have been identified [37]: (1) increasing the temperature difference for heat transfer, (2) augmenting the contact area, and (3) improving the heat transfer coefficient of the material. In this system, the temperature difference for heat transfer is constrained by the reactor and the SCO2 cycle, thereby allowing minimal flexibility for temperature adjustment. The second method can be implemented by incorporating fins into the heat exchanger. But it is too hard to realize for the manufacturing limitation of heat pipe wall. Finally, incorporating a metal foam skeleton into the PCMs was adopted to enhance the heat transfer.
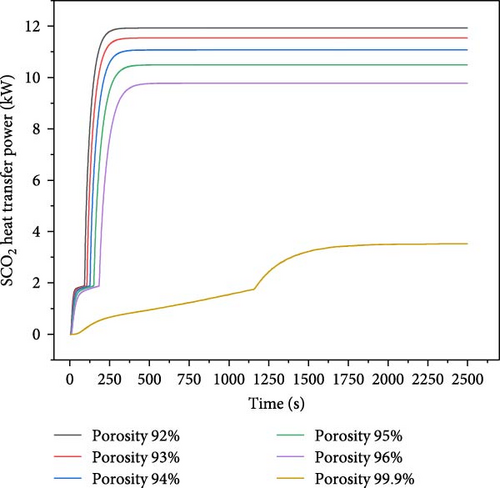
By designing metal foam with varying porosities, distinct heat exchange capabilities can be achieved. Using the model illustrated in Figure 9, numerical analysis was performed. The central gray area comprises a copper foam skeleton and the inorganic salt LiOH–LiF. The outer section is the SCO2 flow channel. The inlet temperature of the SCO2 is 700.15 K, with the mass flow rate of 0.024 kg/s, and the inner wall of the heat storage unit is maintained at 972 K. Initially, the overall temperature of the heat storage unit is uniformly at 700.15 K. Different processes of achieving thermal balance were analyzed for various porosities of foam copper.
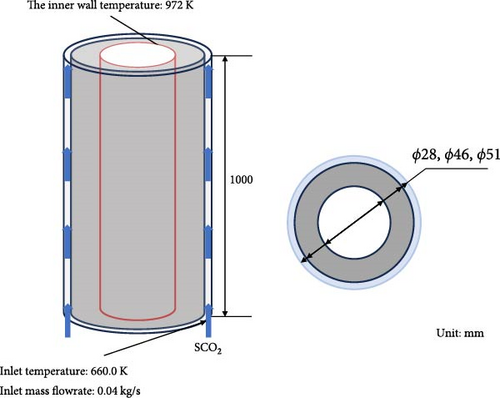
Figure 10 and Table 5 show the variation in heat transfer power of foam copper at different porosity levels. At approximately 2 kW, the heat transfer power curve exhibits a notable inflection point. This phenomenon is attributed to the phase change of LiOH–LiF during the heating process, which entails the absorption of a substantial amount of heat, thereby delaying the increase in the heat transfer power of SCO2. Once the LiOH–LiF surpasses the phase change process, the heat transfer power of SCO2 continues to rise until thermal balance is attained. The main goal in choosing copper foam porosity is to ensure the heat exchanger meets the required heat transfer power (10.8 kW per heat pipe) between the heat pipe and supercritical CO2. Heat transfer power curves show that only porosities of 92%, 93%, and 94% achieve steady-state heat transfer powers above 10.8 kW. Furthermore, as indicated in Table 5, the lower the porosity is, the higher the overall equivalent thermal conductivity of the molten salt and foam copper becomes, leading to the shorter time to reach thermal balance, the greater heat transfer power at thermal balance, and the higher outlet temperature of the SCO2 fluid. However, the decrease of porosity also means the decrease of molten salt proportion, which will reduce the maximum heat storage capacity and the thermal inertia of the system. In summary, a copper foam porosity range of 92%–94% achieves the required 10.8 kW heat transfer power without significant loss of thermal storage capability.
| Porosity (%) | Equivalent thermal conductivity (W/[m·K]) |
Heat transfer power W at heat balance (kW) | SCO2 outlet temperature at heat balance (K) | Time to reach heat balance (s) |
|---|---|---|---|---|
| 92 | 12.53 | 11.93 | 883.9 | 432 |
| 93 | 11.13 | 11.54 | 877.0 | 468 |
| 94 | 9.73 | 11.07 | 868.7 | 511 |
| 95 | 8.33 | 10.50 | 858.5 | 567 |
| 96 | 6.94 | 9.78 | 845.6 | 640 |
|
1.35 | 3.53 | 730.3 | 2190 |
3.3. The Energy Conversion System Design
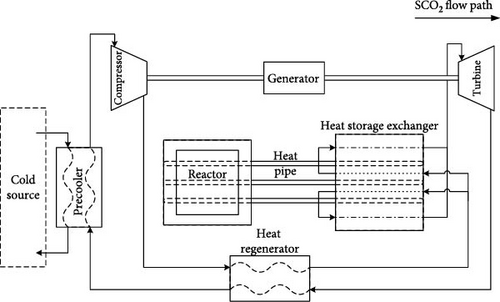
The energy conversion system employs the SCO2 Brayton cycle to ensure the small size and high efficiency. The configuration of the system is shown in Figure 11. The cycle comprises the heat storage exchanger, a turbine, a compressor, a generator, a heat regenerator, a precooler, a fan, and the associated piping. To achieve a more compact arrangement, the turbine, compressor, and generator were designed as an integrated unit, sharing a common shaft. The printed circuit heat exchanger (PCHE) was used for heat regenerator [38]. The precooler utilized air as the external cooling medium, with a fan facilitating the airflow to cool the SCO2 fluid.

Table 6 and Figure 12 show the results of loop parameters under the operational condition at rated power. In the loop, the maximum pressure is 20 MPa at the compressor outlet. The highest outlet temperature of the heat storage heat exchanger is 838.9 K. Both the minimum temperature and pressure are observed at the compressor inlet, which are 308.15 K and 7.6 MPa, respectively. The final energy conversion efficiency reaches 34.45%.

| Parameters | Value | Parameters | Value |
|---|---|---|---|
| Heat source power (MW) | 3.5 | Shaft mechanical efficiency (%) | 98.0 |
| Electric power (MW) | 1.2 | Turbine efficiency (%) | 0.87 |
| Loop flow (kg/s) | 14.88 | Motor efficiency | 98.0 |
| System efficiency | 34.45 | Compressor efficiency (%) | 0.8 |
| Shaft speed (r/min) | 15,000 | — | — |
4. Evaluation of the System Performance
The most significant feature of the new micro nuclear energy system is the integration of heat storage with a heat pipe nuclear reactor. The heat storage component increases the thermal inertia of the energy system, thereby contributing to the safety benefits in the thermal transients.
By incorporating heat storage materials within the heat exchanger, the increased thermal inertia diminishes the correlation between the reactor and the energy conversion system. For the reactor, thermal fluctuations originating from the energy conversion system exert a reduced impact on the core. Conversely, the thermal shock imposed on the energy conversion system from the core will also be mitigated. Additionally, the heat storage system provides a temporary safety margin during the loss of heat sink.
4.1. Thermal Balance in the Steady State
Figure 13 illustrates the complete flow chart of the system. Table 7 presents the major design parameters. The dynamic parameters and feedback coefficients of the reactor, obtained by using the SARAX code system [39], are shown in Tables 8 and 9, respectively. For heat pipe reactors, studies [40, 41] indicate the temperature reactivity feedback mechanisms of the working fluid involve two aspects: (1) the metallic vapor state within the internal space and (2) the liquid pool height variation at the heat pipe bottom. The combined effect of these two mechanisms results in a near-zero void coefficient induced by working fluid evaporation. During the conceptual design phase of the system in this paper, the influence of working fluid evaporation in heat pipes was provisionally neglected. The reactivity changes induced by the Doppler effect and thermal expansion are the primary focus of this study. Besides the proposed system, a parallel system was established with an only difference of removing the heat storage materials. This approach allows for a comparative analysis of the system performances with and without heat storage. The operating parameters in steady state are detailed in Table 10.
| Parameters | Description | Parameters | Description |
|---|---|---|---|
| Reactor power (MWt) | 3.5 | Heat storage materials | LiOH–LiF |
| System electric power (MWe) | 1.2 | Working temperature of PCMs (K) | 600–1000 |
| Energy conversion efficiency (%) | 34.4 | Number of heat pipes | 372 |
| Energy conversion system | Closed Brayton cycle | Fuel type/fuel | Rod/UO2 |
| Energy conversion system working fluid | SCO2 | Reactivity control | Y-shaped control rod |
| Neutron generation time (s) | Total delayed neutron fraction | Delayed neutron fraction | Precursor nuclear decay constant | ||
|---|---|---|---|---|---|
| i | Value | i | Value | ||
| 3.064111 × 10⁻⁶ | 6.381699 × 10⁻³ | 1 | 1.976049 × 10⁻⁴ | 1 | 1.249039 × 10⁻² |
| 2 | 1.048277 × 10⁻³ | 2 | 3.178383 × 10⁻² | ||
| 3 | 1.017265 × 10⁻³ | 3 | 1.095456 × 10⁻¹ | ||
| 4 | 2.940490 × 10⁻³ | 4 | 3.177587 × 10⁻¹ | ||
| 5 | 8.737246 × 10⁻⁴ | 5 | 1.351784 × 100 | ||
| 6 | 3.043370 × 10⁻⁴ | 6 | 8.689198 × 100 | ||
| Feedback type | Value |
|---|---|
| Doppler coefficient (pcm/K) | −0.0254 |
| Coefficient of expansion (pcm/K) | −0.4076 |
| Total temperature reactivity coefficient (pcm/K) | −0.433 |
| System node | With heat storage | Without heat storage | ||
|---|---|---|---|---|
Temperature (K) |
Pressure (MPa) |
Temperature (K) |
Pressure (MPa) |
|
| Heat exchanger outlet | 838.9 | 19.64 | 903.1 | 19.64 |
| Turbine outlet | 731.6 | 7.75 | 797.5 | 8.25 |
| Regenerator high-temperature side outlet | 396.4 | 7.67 | 390.5 | 8.17 |
| Precooler outlet | 308.2 | 7.60 | 308.2 | 7.60 |
| Compressor outlet | 383.9 | 20.0 | 383.9 | 20.0 |
| Regenerator low-temperature side outlet | 660.0 | 19.84 | 731.9 | 19.84 |
Table 11 shows the difference between the control parameters of the two system components. Notably, both systems (with and without thermal storage) are designed for the same heat pipe reactor, with consistent core conditions being maintained as a prerequisite. There is no molten salt thermal resistance in the heat exchanger without heat storage. According to the relationship that the heat transfer is equal to the temperature difference divided by the thermal resistance, the temperature difference between the core of the nonheat storage system and the SCO2 of the secondary loop is lower than that of the heat storage system. Since the core temperature has been determined at the time of design, the SCO2 temperature in the heat exchanger in the nonheat storage system needs to be higher. In the secondary loop, the steady-state flow rate is predetermined. Additionally, the precooler is assumed to operate ideally, maintaining constant outlet temperature and pressure. Both the nonheat storage and heat storage systems employ identical compressors, ensuring consistent compressor outlet parameters. For the nonheat storage system, achieving a higher SCO2 temperature at the heat exchanger inlet necessitates increased heat recovery by the regenerator. The turbine outlet connects to the regenerator’s hot side. To balance heat exchanger power with reactor core power, iterative adjustments to regenerator and turbine parameters are necessary. These adjustments ultimately define the secondary loop parameters for the nonheat storage system.
| Control parameters | With heat storage | Without heat storage |
|---|---|---|
| Loop flow (kg/s) | 14.88 | 14.88 |
| Compressor: efficiency/expansion ration | 0.80/2.632 | 0.80/2.632 |
| Regenerator: heat transfer coefficient-area product (W/K) | 1.36 × 10⁵ | 1.95 × 10⁵ |
| Turbine: efficiency/expansion ration | 0.87/0.395 | 0.87/0.420 |
4.2. System Performance in the Load Reduction Transient
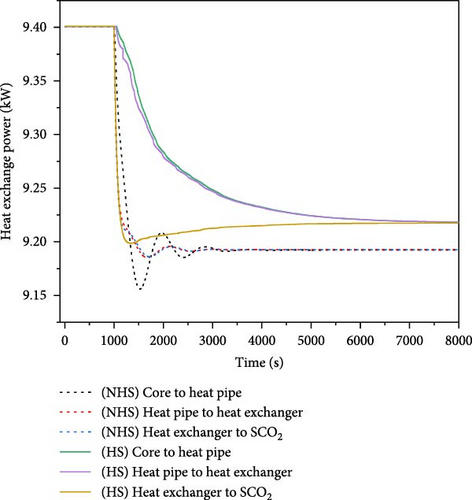
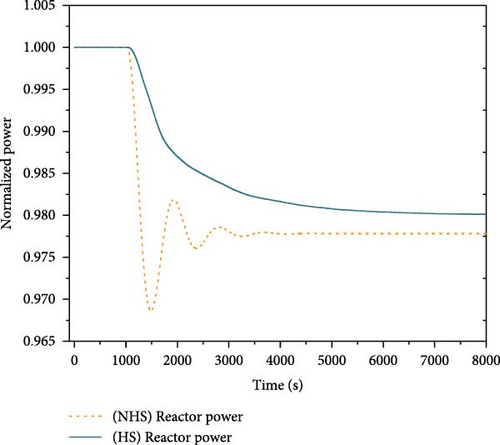
During the operation of nuclear energy systems, load disturbance is a prevalent transient case, especially for the microsystem. Given the tight coupling between the energy conversion system and the reactor, load disturbance can affect the stable operation of the reactor core. This case simulated the system behavior under a load reduction condition. This condition considered a 10% step decrease in load at 1000 s during the 100% full power operation. The responses of key parameters of the system were analyzed during 8000 s, with the results presented in Figure 14. For simplification, the term “HS” in the figure denotes heat storage, whereas “NHS” means the absence of heat storage.
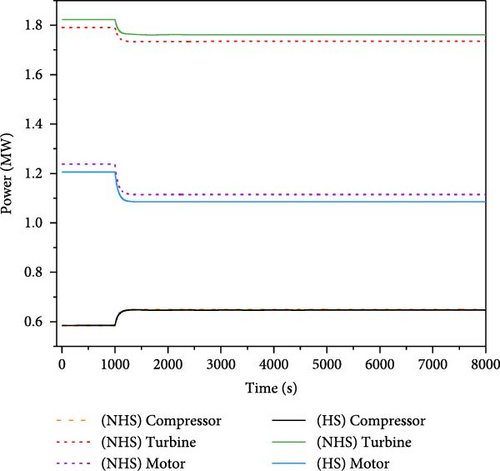
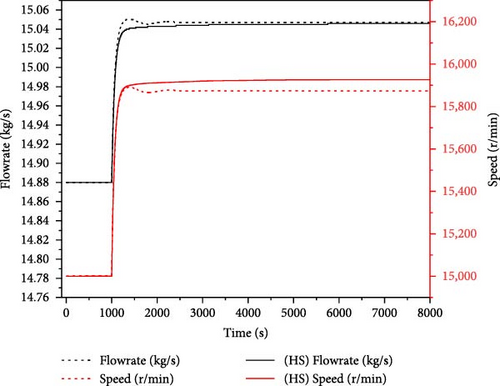

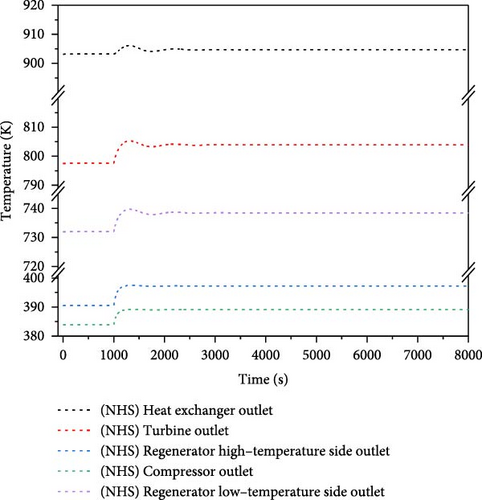

As illustrated in Figure 14a–c, a sudden decrease in load results in the imbalance of the spindle torque, which causes a rapid increase in the shaft speed. The increase in the shaft speed subsequently leads to an elevation in flow rate. At this juncture, the spindle speed observed in the absence of heat storage is marginally higher than that observed with heat storage after stabilization. This phenomenon can be attributed to the substantial heat capacity of the heat storage system. The rate of temperature change in the heat storage is slower following the alteration in the flow rate of SCO2, which results in a variation in the amount of heat transferred from the heat storage to the SCO2. Consequently, this discrepancy affects the work output of the turbine and the loads produced by the compressor and generator, leading to the differences in the final shaft speed and flow rate between the scenarios with and without heat storage.
As in Figure 14d–g, variations of the heat removed by the secondary loop result in corresponding fluctuations in both the temperature and power output of the core. In the absence of heat storage, a reduction of heat extracted by the secondary loop leads to the heat accumulation in the core, which subsequently raises the fuel temperature. The increase in temperature induces negative reactivity, resulting in the decrease of core power. The core power and temperature oscillate down and eventually reaches new equilibrium at 97.7% of the initial power, while the core temperature exhibits fluctuations within a range of 2.5 K. Conversely, when heat storage is implemented, the influence of the secondary loop on the core is alleviated, allowing for the gradual decrease in core power without significant oscillations, which ultimately stabilizes at 98% of the initial power, with the core temperature fluctuating within a negligible range of 0.3 K. The load reduction process induces substantial variations in the shaft speed, but the outlet temperature of each equipment in the secondary loop changes little.
4.3. System Performance in the Reactivity Insertion Transient
Reactivity insertion transients arise from the uncontrolled withdrawal of control rods or other factors that introduce positive reactivity. This case simulated the transient with 50 pcm positive reactivity insertion at 1000 s during the 100% full power operation. The simulated results of the system during 4500 s are presented in Figure 15.
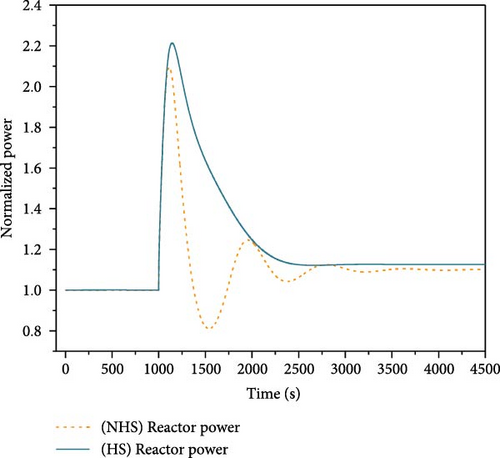
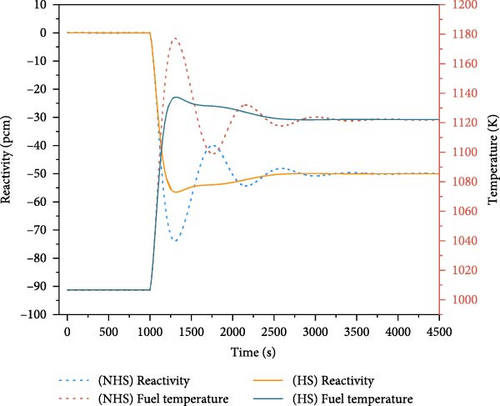
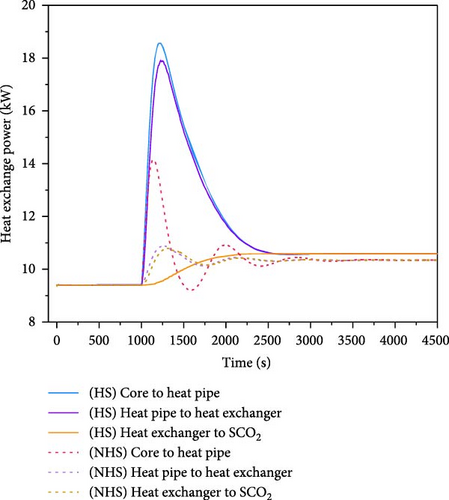
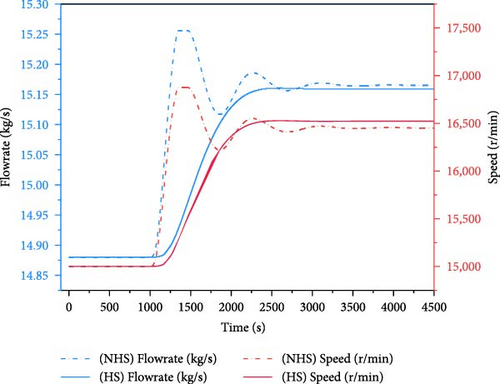
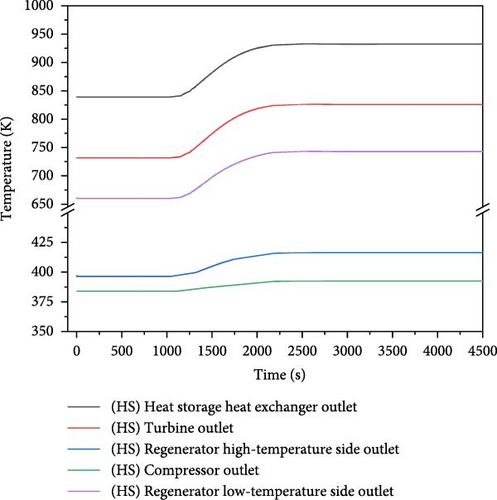
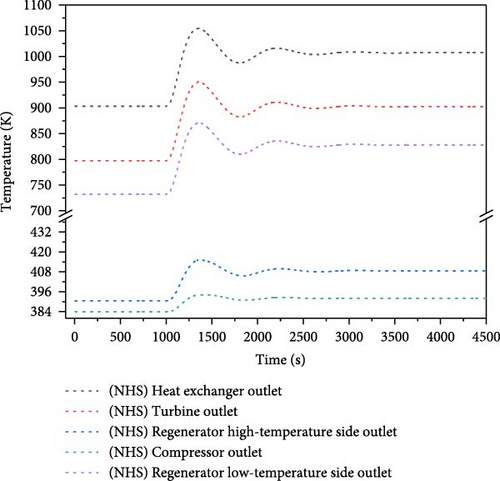
Figure 15a,b illustrate the variations of core power, reactivity feedback, and fuel temperature. In the absence of heat storage, the core power experiences a rapid increase, which subsequently leads to the elevation of fuel temperature and the introduction of negative feedback to the core. When the negative feedback surpasses the introduced positive reactivity, the core power begins to decline, resulting in a fluctuating reduction in core power throughout the process. This process stabilizes at approximately 110% full power around 3500 s, with a peak power of 210% full power. The initial core temperature is 1006 K, while the peak temperature reaches 1179 K. The temperature increased by 173 K. When the heat storage is implemented, the core power also increases and then gradually decrease, achieving a maximum power of 221% full power. The peak temperature is 1138 K and the final temperature increases by only 132 K. The power fluctuation is mitigated. This phenomenon can be attributed to the substantial heat capacity of the heat storage system, which effectively absorbs the thermal shocks from the core. This assertion is further supported by the changes in the heat exchange power depicted in Figure 15c.
Figure 15d–f show the variation of parameters for each equipment within the system. The precooler effectively maintains the compressor inlet temperature at 308.2 K, resulting in an increase in the outlet temperature of the heat storage exchanger throughout the entire process. It subsequently enhances the turbine output power, which leads to a rise in the spindle speed and an increase in the loop flow rate, accompanied by a slight elevation in the compressor outlet temperature. Without the heat storage, the parameters of each equipment in the secondary loop exhibit significant oscillations and fluctuations, although these parameters gradually stabilize over time. When the heat storage is incorporated, each parameter changes more gently and without oscillations, thereby mitigating the impact on the secondary loop equipment.
4.4. System Performance in the Loss of Heat Sink Transient
The loss of heat sink transient occurs due to a failure in the secondary or tertiary loop, which results in inadequate cooling of the reactor core. The reduction of cooling capacity leads to the rapid increase of temperature in the core, thereby increasing the damage risk of the core. This case simulated a scenario in which a fault in the energy conversion system happened. It caused a rupture at the interface of SCO2 pipeline, leading to a loss of normal heat exchange capability in the heat exchanger. In this condition, the surface of heat exchanger was treated as an adiabatic boundary at 1000 s during the 100% full power operation. Then, the energy conversion system stopped working. The process was simulated during 5000 s, with the results presented in Figure 16.
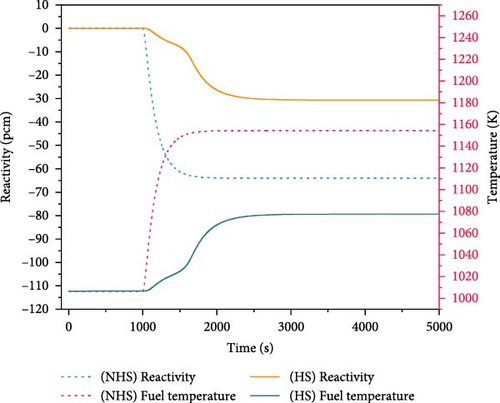
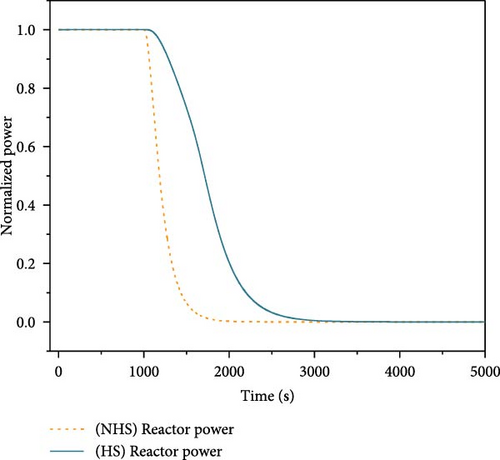
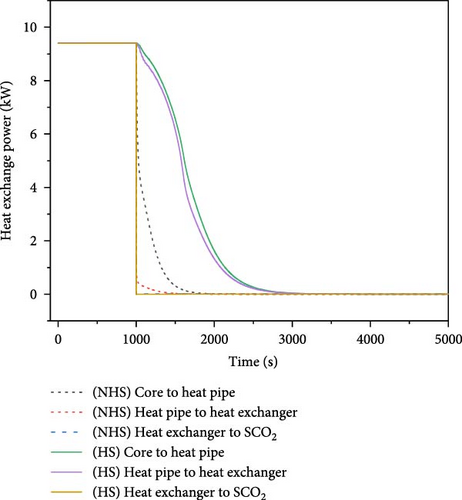
Figure 16a illustrates the variations of core temperature and reactivity feedback. Figure 16b displays the changes of core power, and Figure 16c shows the changes of heat exchange power. In the absence of heat storage, the temperature increases rapidly due to the loss of heat sink. However, the temperature increase introduces negative reactivity into the core and results in the gradual decrease of core power. Without the heat storage, the temperature rises from 1006 to 1150 K during 500 s. Conversely, when the heat storage works, the PCMs in the heat exchange units serves as a temporary heat sink, enabling it to absorb a portion of heat released from the core. This mechanism significantly delays the rise of temperature. The temperature rises from 1006 to 1078 K during over 1500 s.
5. Conclusion
- 1.
The UO2 fueled reactor is cooled by 372 sodium heat pipes with 3.5 MW thermal power. The closed SCO2 Brayton cycle is utilized with an energy conversion efficiency of 34.45%, which ensures the system has the electric power of more than 1 MW.
- 2.
The heat storage exchanger employs a modular design, comprising 32 heat exchange units. Each unit is matched with a corresponding fuel assembly. LiOH–LiF serves as the heat storage material, with an approximate mass of 0.7 tons.
- 1.
For the case of step reduction of load (10% full power), the fluctuation in the core temperature was diminished to 1/8 of the one observed in the traditional design without heat storage.
- 2.
In the transient with 50 pcm positive reactivity insertion, the peak temperature in the core could be diminished by 40 K. The thermal shock experienced by the equipment in the loop was also alleviated.
- 3.
In the accident of loss of heat sink, the heat storage system could significantly mitigate the rate of temperature increase in the reactor core, achieving a temperature reduction of more than 70 K.
Conflicts of Interest
The authors declare no conflicts of interest.
Author Contributions
Dong Huang: methodology, software, investigation, writing – original draft. Fanchen Li: validation, investigation, writing – review and editing. Youqi Zheng: conceptualization, writing – review and editing, supervision, project administration.
Funding
This study was funded by the National Natural Science Foundation of China (Grant U2167205).
Acknowledgments
This work was supported by the National Natural Science Foundation of China (Grant U2167205).
Open Research
Data Availability Statement
The datasets generated during and/or analyzed during the current study are available from the corresponding author upon reasonable request. Requests for access to these data should be made to [email protected].


