Open-Circuit Fault Detection Strategy in Grid-Tied NPC Inverters Using Distorted Current and Model Predictive Control
Abstract
Investigating and addressing fault detection is crucial for advancing the reliability, performance, and cost-effectiveness of grid-connected inverter systems, thereby contributing to the stability and efficiency of modern power grids. This study introduces a novel approach for detecting and classifying open-circuit faults (OCFs) in three-level neutral point clamped (3-L-NPC) inverters connected to the grid. The proposed algorithm swiftly identifies faulty switches and clamping diodes using distorted current signals and model predictive control (MPC), eliminating the need for additional hardware or complex computations. By addressing the challenge of identifying the specific switch under grid-connected conditions, the proposed method achieves faster detection and identification of all switches and clamping diodes in less than one fundamental period which is very good compared with recent studies and considering that no extra sensors are used. Furthermore, this work demonstrates the efficacy of MPC in tolerating OCFs in clamping diodes, showcasing its potential to enhance system resilience and performance. The proposed strategy significantly improves the reliability of 3-L-NPC inverters by ensuring prompt and accurate fault detection and classification. Both experimental and simulation results confirm the efficacy of the suggested fault detection and identification approach, emphasizing its practical applicability in real-world grid-tied inverter systems.
1. Introduction
In recent years, the integration of grid-tied neutral point clamped (NPC) inverters into renewable energy systems has gained significant attention due to their efficiency and reliability [1–3]. These inverters are crucial for converting direct current (DC) from renewable sources like solar panels into alternating current (AC) suitable for the electrical grid [4, 5]. However, the operation of NPC inverters can be compromised by faults, which can affect both their performance and the stability of the power grid. Consequently, robust fault detection strategies are essential to ensure the continuous and safe operation of these inverters. Traditional fault detection methods for NPC inverters often rely on standard diagnostic techniques, which may not be sufficient in the face of complex fault scenarios [6–8]. As grid-connected systems become more sophisticated, there is an increasing need for advanced strategies that can address various types of faults with higher accuracy [9]. Recent advancements have highlighted the potential of using distorted current signals as a diagnostic tool. Distorted currents, resulting from operational anomalies or faults, can provide critical insights into the condition of the inverter, thus enabling more precise fault detection.
Incorporating model predictive control (MPC) into the fault detection strategy offers a promising approach to enhance the reliability of NPC inverters. MPC is known for its capability to predict future system behavior and adjust control actions accordingly [10–12]. By integrating MPC with distorted current data, it is possible to develop a dynamic and adaptive fault detection system that not only identifies faults but also anticipates their progression. This combination enables a proactive approach to fault management, minimizing downtime, and improving the overall efficiency of the inverter system. The proposed strategy focuses on leveraging the strengths of both distorted current signals and MPC to create a comprehensive fault detection framework. By combining these elements, the strategy aims to achieve higher fault detection accuracy and reliability. This approach is expected to contribute significantly to the advancement of fault management in grid-tied NPC inverters, ultimately enhancing the stability and efficiency of renewable energy systems. Through ongoing research and development, this strategy could set a new standard for fault detection and management in modern inverter technologies [13–17].
Wei et al. [18] introduced a parallel OCF (open-circuit fault) diagnosis method (POFDM) for cascaded full-bridge NPC inverters (CFNPCIs) using MPC. It detects faults by monitoring abnormal capacitor voltage changes across eight IGBTs in each submodule. The method counts changes and identifies faulty switches based on these counts. The POFDM handles single and multiple faults, with validation via experimental prototypes. Xu et al. [19] presented a reduced-order observer-based approach for diagnosing open-switch and current sensor faults in grid-tied NPC inverters. It transforms sensor faults into a generalized state vector and decouples faults using matrix transformations. A reduced-order observer estimates phase currents and faults accurately, and an adaptive threshold diagnosis algorithm identifies fault types and locations. Experimental results confirm the robustness and effectiveness of the proposed diagnosis strategy. Smith et al. [20] addressed the challenges posed by unbalanced voltages in distribution networks due to increased renewable energy sources and large loads. It proposes a control algorithm for 3-L (three-level) inverters to manage ripples in control signals and enhance fault ride-through capability. The algorithm allows for balanced current output or ripple-suppressed active power output, improving voltage balance with enhanced neutral point current prediction, validated through simulations, and experiments.
The work in [21] explores a control scheme for single-phase grid-connected inverters using finite control set–MPC (FCS-MPC). The scheme controls active and reactive power from distributed energy resources, including photovoltaics and battery storage, with low-voltage ride-through capability during voltage sag. It employs three orthogonal signal generation methods to create virtual components for power computation, demonstrating quick response, and effective grid support through simulation. Long et al. [22] examined fault-tolerance control (FTC) methods for T-type 3-L converters, focusing on MPC applications. It introduces sequential MPC and predictive tolerance control methods that balance neutral point voltage and track grid current. These methods enhance control flexibility by reducing calculation loops and improving fault management. Performance is validated through simulations and experiments, showing benefits in balancing NP voltage and reducing harmonic distortion. Chen and He [23] proposed an OCF diagnosis method for 3-L-NPC rectifiers using a fault injection strategy. It improves traditional phase-to-phase voltage residual calculations by quantifying residuals based on current levels. Faults are detected using normalized residuals derived from existing sensors. A fault injection strategy helps distinguish between inner and outer switch faults and avoid misdiagnoses, with experiments confirming the method’s accuracy and robustness.
Further, Li et al. [24] introduced an adaptive FCS-MPC method for three-phase inverters connected to distorted grids with fewer voltage sensors. It uses a composite observer consisting of a phase detection module and time-varying observers to identify grid voltages and their harmonics. The simplified FCS-MPC scheme in the natural coordinate system enhances current tracking performance, and simulations and experiments demonstrate its effectiveness under distorted grid conditions. Li et al. [25] addressed parameter inaccuracies in model-based control by employing a time-varying parameter observer for real-time system parameter identification. A new controller, based on these accurate parameters, enhances the adaptability of FCS-MPC. Simulations and tests on a Packed-U-Cells grid-connected inverter system show the adaptive method’s reliability, maintaining operation even under fault conditions, demonstrating its robustness and effectiveness. In the following, Chen and He [26] proposed a method for diagnosing OCFs in 3-L-NPC rectifiers by comparing actual and reference voltages without complex calculations or additional hardware. It integrates FTC to improve fault location accuracy and differentiate between outer- and inner-switch faults. The method avoids amplifying fault consequences and extends to multiple-switch faults, validated through experiments to confirm its efficiency and resource-saving benefits.
Work in [27] discusses the application of MPC in current-source converters (CSCs) to manage filter resonance and parameter mismatches. A dual-disturbance observer estimates capacitor voltage references and input disturbances to improve grid-current tracking. The MPC scheme, evaluated by increasing the prediction horizon, shows that grid-current feedback alone can effectively control CSCs, simplifying design and reducing parameter mismatch effects. Experimental results confirm the scheme’s effectiveness and practical benefits. Laib et al. [28] presented a control scheme for large-scale grid-connected PV systems featuring two conversion stages: DC/DC converters for PV arrays and a 5-L-NPC inverter. It introduces FS-MPC for maximizing power from each PV array and controlling the NPC inverter. The scheme ensures rapid maximum power point tracking, DC-link voltage balance, and high grid-current quality. Results from simulations and experiments demonstrate superior performance compared to conventional methods. Research work in [29] explores intelligent predictive multiobjective control (IPMOC) for enhancing power quality and reliability in grid-tied multilevel converters. It combines MPC with artificial neural networks for dynamic adjustment of weighting factors and power references. The IPMOC reduces harmonics, and switching transitions, and suppresses common-mode voltage. Tested on a three-phase NPC converter using dSPACE 1202 and MATLAB, the IPMOC proved effective in real-time power management and harmonic mitigation. Manikandan and Singh [30] proposed a rapid fault identification method for MLIs using estimated phase voltages and an average cost function. The technique simplifies fault diagnostics and is robust against false alarms, providing efficient fault switch localization in an NPC-based induction motor drive system. Implemented in MATLAB/Simulink, the method was validated in real-time with a 3.7 kW motor drive, showing fault diagnostics within 4.2–15.2 ms.
Lim, Goh, and Lee [31] introduced a near-optimal FCS model-predictive grid-current control for VSIs with actively damped LCL filters. It benefits from a constant-frequency PWM, avoids common simplifications by considering third-order effects, and operates effectively near critical frequencies. By utilizing the entire hexagonal vector space, it maximizes dc-bus usage. Simulations and experiments confirm its viability for grid-current control with PWM-VSIs. Research work in [32] is presented as a unified OCF diagnosis method for all semiconductor devices in 3-L-NPC converters. It calculates residuals from mismatches between actual and estimated current paths, detecting faults in IGBTs, clamping, and freewheeling diodes using only existing current measurements. The method locates faults within milliseconds and is integrated into the model’s predictive current control. Experimental and hardware-in-the-loop (HIL) tests validate its effectiveness and robustness across different scenarios. Further, Ramirez et al. [33] addressed the challenge of high computation time in MPC for modular multilevel converters (MMCs). It proposes a fast method to quickly identify the optimal voltage vector among many options, significantly reducing computation time. The method simplifies MPC implementation in microcontrollers by discarding duration times and modulating the reference vector using SVM. It ensures fast dynamic response, low current THD, and compatibility with existing MMC control algorithms. Finally, Makhamreh et al. [34] proposed a Lyapunov-based MPC for a PUC7 grid-connected inverter. This controller simplifies design by eliminating gain coefficients and reducing switching frequency, which lowers switching losses. It is based on a cost function derived from the Lyapunov control theory. Simulations and experiments on a PUC7 prototype show high disturbance rejection, robustness to parameter mismatches, and a quick dynamic response, making it suitable for grid-tied applications. A comparison of the methods discussed in the literature review, as presented in Section 1, is shown in Table 1.
| Reference | Technical aspects | Control structure | Type of system | Advantages | Disadvantages |
|---|---|---|---|---|---|
| [17] | Voltage source inverter, LCL filters | MPC | Inverter | Near-optimal control, simplified cost function, good for distorted grids | Requires multiple sensors, computationally intensive |
| [18] | Parameter inaccuracies, real-time identification | Adaptive control | PUC inverter | Enhances adaptability, ensures continuous operation under faults | Complex parameter estimation, may not cover all faults |
| [19] | OCF detection | Fault-tolerant control | 3-L-NPC rectifiers | Simple, fast fault location, minimal impact on performance | Limited to specific faults, may not handle all scenarios |
| [20] | Multivariable feedback, resonance suppression | MPC with dual-disturbance observer | CSC | Improved tracking under mismatches, simplifies design | High computation time, complex feedback management |
| [21] | Two-stage conversion, FS-MPC for PV | FS-MPC | Grid-connected PV system | Enhances power harvesting, balances DC-link voltages | Requires multiple controllers, complex design |
| [35] | Intelligent predictive control, harmonic mitigation | IPMOC with neural networks | Multilevel converters | Enhances efficiency, reduces harmonics, adaptive | Requires extensive training, may be complex to implement |
| [23] | Fault identification, phase voltage estimation | Residual-based method | Multi-level inverter | Fast fault detection, robust against false alarms | Limited to specific faults, relies on existing current measurements |
| [24] | Adaptive FCS-MPC, simplified cost function | Adaptive FCS-MPC | Voltage source inverters with LCL filters | Reduces sensor requirements, effective under distorted grids | Limited to specific grid conditions, complex observer design |
| [25] | Real-time parameter identification | Adaptive MPC | PUC inverter | Enhances control adaptability, fault tolerance | Complexity in parameter estimation, may not cover all system variations |
| [26] | OCF diagnosis, FTC | Fault-tolerant diagnosis | NPC rectifiers | Quick fault location, minimal fault impact | Limited to specific faults, requires accurate reference voltage |
| [27] | Second-order resonance, grid-current tracking | MPC with dual-disturbance observer | CSC | Simplified design, effective tracking under mismatches | High computation time, complex feedback management |
| [28] | Multistage PV conversion, FS-MPC | FS-MPC for PV and inverter | Grid-connected PV system | Optimizes power extraction, ensures voltage balance | Complex controller design, multiple stages |
| [29] | Intelligent MPC, real-time harmonic mitigation | IPMOC with neural networks | Multilevel converters | Improves power quality, adaptive control | Requires neural network training, complex implementation |
| [30] | Rapid fault identification, phase voltage estimation | Fault identification method | NPC-based induction motor drive | Quick and accurate fault diagnostics, resource-efficient | Limited to specific faults, requires accurate phase voltage estimates |
| [31] | NOP-MPGCC, LCL filter design | Near-optimal FCS-MPC | Voltage source inverters | Simplified control, efficient under critical frequencies | Requires detailed theoretical derivation, may be complex |
| [32] | Unified fault diagnosis for all semiconductors | Residual-based method | 3-L-NPC converters | Fast fault detection, integrates with MPC | Limited to open-circuit faults, depends on existing measurements |
| [33] | Fast MPC for large vector sets | Fast MPC | MMC | Reduces computation time, compatible with MMC | May not handle all scenarios, complex vector modulation |
| [34] | Lyapunov-based MPC, reduced switching frequency | Lyapunov-based MPC | PUC7 inverter | Simplifies design, reduces switching losses | May not be suitable for all inverter types, complex implementation |
- Abbreviations: CSC, current-source converter; MPC, model predictive control; NPC, neutral point clamped.
- •
Introduces a new approach for detecting and classifying OCFs in 3-L-NPC inverters using distorted current signals and MPC, enabling rapid fault identification without additional hardware.
- •
Achieves detection and identification of faulty switches and clamping diodes in less than one fundamental period, significantly faster than existing methods, thus enhancing the reliability and performance of grid-tied inverters.
- •
Demonstrates the effectiveness of MPC in tolerating OCFs in clamping diodes, showing its potential to improve system resilience and manage faults without complex computations.
- •
Both simulation results and HIL experiments confirm the efficacy and reliability of the proposed fault detection method, highlighting its practical applicability in grid-connected inverter systems.
The paper is organized as follows. In Section 2, the control strategy is presented. Section 3 introduces the behavior of the case study under OCF scenarios. In Section 4, the fault detection and localization methods are proposed. Simulation and performance verification under parameter drift and unbalanced grid conditions are presented in Section 5. Experimental results are discussed in Section 6. Finally, the conclusion is given in Section 7.
2. MPC Strategy for the Grid-Tied 3-L-NPC Inverter
2.1. Finite Set MPC
According to Choi et al. [40], there are several possibilities for Vα,β(k) when calculating the predictions of iα, iβ for different three-phase voltage levels. As seen in Figure 2, where the three-phase output voltage changes by just a single level at each phase during every sampling period, the 27 voltage vectors have 19 fundamental space vectors. Consequently, one of the adjoining states of the current step voltage set is the next step optimal voltage state.
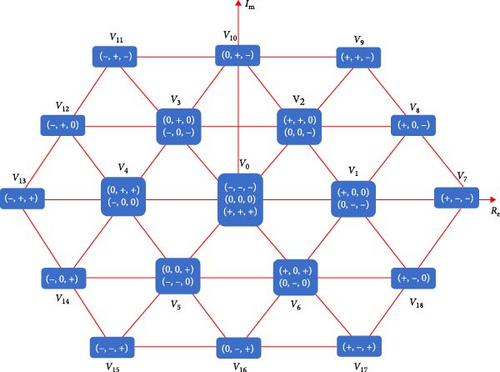
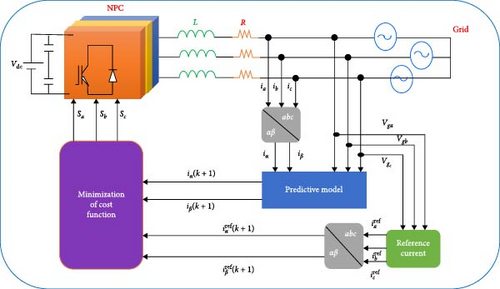
Figure 3 represents the block diagram of the control system for the NPC inverter. The control strategy involves gathering grid voltage values (vga, vgb, vgc) and output current values (ia, ib, ic) at moment k before initiating control. Employing αβ coordinate transformation results in iα and iβ. Subsequently, MPC is trained using these transformed values. Once the model attains a predefined level of precision in approximating the inverter system, it predicts all anticipated values of , which correspond to various voltage vectors at moment k + 1. Based on the difference between the reference value of , and the predicted values of , , the optimization controller selects the set of voltage vectors that minimize the evaluation function as the optimal voltage vector. For the next inverter sampling period, the switching state that corresponds to the optimal voltage vector is applied.
3. Grid-Tied NPC Inverter Under OC Fault Condition
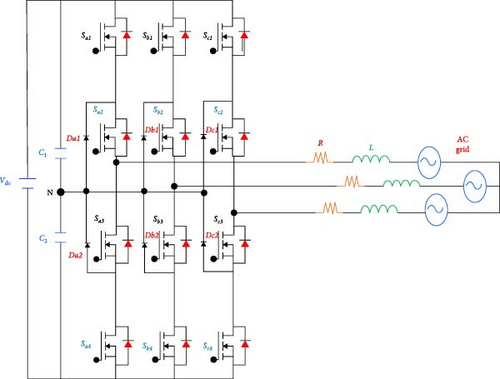
In this section, a comprehensive analysis of the grid-tied NPC inverter is undertaken considering the open-switch faults in phase a. A MATLAB/Simulink model of the inverter shown in Figure 1 is used to evaluate the effectiveness of the suggested technique. Relevant system parameters are summarized in Table 2. Two types of faults are considered, type-A fault in which switches are set to be open circuit and type B fault which considers one of the clamping diodes to be faulty.
| Parameters | Value | Unit |
|---|---|---|
| DC-link voltage (Vdc) | 400 | V |
| Capacitor (C1, C2) | 300 | µF |
| Filter inductance (L) | 5 | mH |
| Filter resistance (R) | 5 | Ω |
| Grid voltage (vg) | 120 | Vrms |
| Sampling frequency | 60 | kHz |
3.1. Type-A Fault
3.1.1. OCF in Sa1
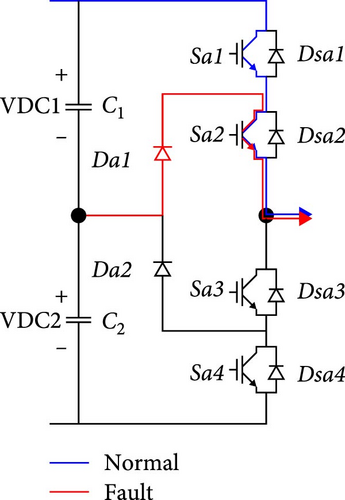
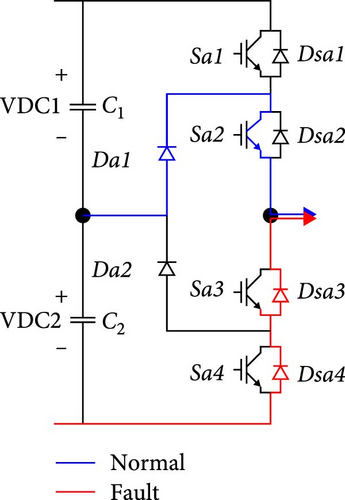
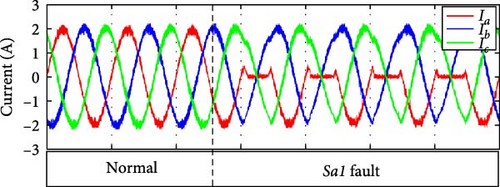
An illustration of normal current flow is presented in Figure 4a. Positive current flows via Sa1 and Sa2 in normal working conditions with switching state P. When an OCF occurs in Sa1, state O is still possible while state P becomes impossible. If a positive current is present, the fault is directed through Da1 and Sa2 until the current decreases to zero. Subsequently, Da1 becomes reverse-biased because of the positive grid voltage, resulting in a complete cessation of positive current flow in the affected phase. This condition is illustrated in Figure 5a.
3.1.2. OCF in Sa2
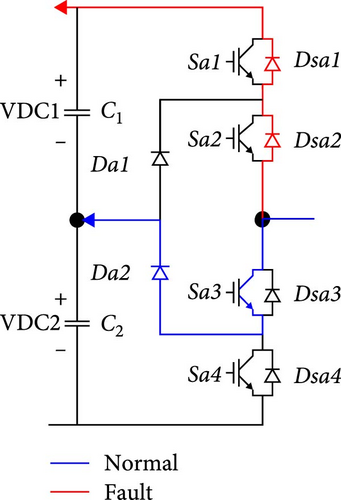
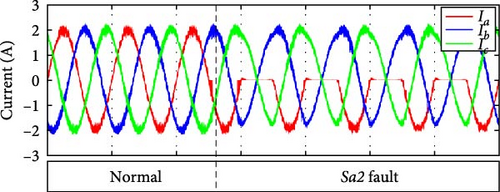
Under normal operating conditions, a positive current flow through Da1 and Sa2 when the inverter is in switching state O, as illustrated in Figure 4b. However, an open circuit in Sa2 prevents the system from operating in either switching state P or O. Consequently, current can only flow through Dsa3 and Dsa4. If this fault occurs while positive current is present, it is redirected through Dsa3 and Dsa4 until it dissipates. Subsequently, the positive grid voltage causes Dsa3 and Dsa4 to become reverse-biased, ceasing current flow in the affected phase, as illustrated in Figure 5b. The resulting output waveform distortions are identical to those observed during a Sa1 fault.
3.1.3. OCF in Sa3
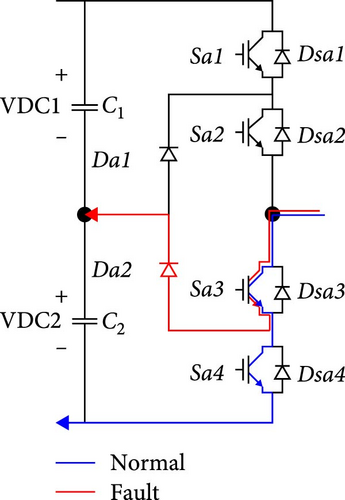
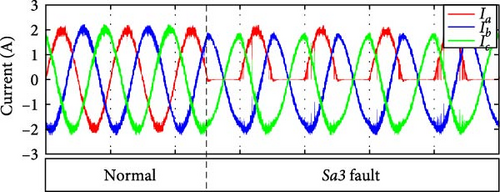
The study here is quite similar to the preceding case, with the exception of current direction. In state O, the current typically flows via Sa3 and Da2 in a negative direction. However, as Figure 4d shows, it passes via Sa3 and Sa4 in state N. An open circuit in Sa3 during negative current flow will redirect the current through Dsa1 and Dsa2 until it dissipates, as illustrated in Figure 4c. Due to the negative grid voltage, Dsa1 and Dsa2 function as a barrier once it reaches zero. Negative current stops because both switching states O and N become impossible, as shown in Figure 5c.
3.1.4. OCF in Sa4
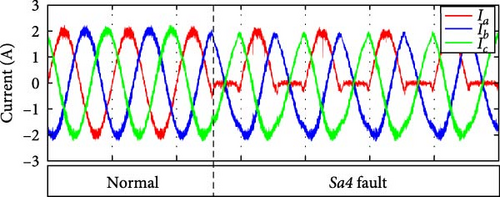
An open circuit in Sa4 prevents the inverter from operating in state N, while it can operate in state O. The current is directed through Dsa1 and Dsa2 until it dissipates when Sa4 becomes faulty during negative current. However, even after reaching zero, the circuit is not completed. This is due to the fact that the negative grid voltage has reverse-biased Da2, Dsa1, and Dsa2. As a result, the negative phase current in the faulted phase stops, as shown in Figure 5d. Under these circumstances, the output distortions match the outputs that are seen when the Sa3 fault is present.
3.2. Type-B Fault
3.2.1. OCF in Da1
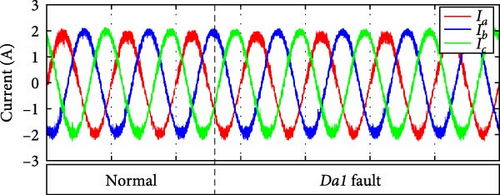
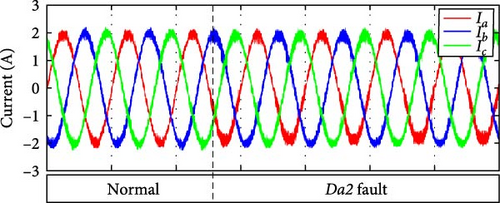
When there’s an OCF in Da1, state P is on, while state O is not. In normal conditions, the positive current flows through Da1 and Sa2 for the O switching state. In Figure 4b, when there is a fault in Da1, the output is connected to the negative DC-link via Dsa3 and Dsa4. This is because there is a positive current that the P state is producing. As a result, the output pole voltage becomes −Vdc/2, causing a distortion in the positive phase current, as shown in Figure 6a. In this case, the current distortion is significantly lower than what is seen when switches malfunction. However, it is important to note that, considering the use of MPC in circuit regulation, the fault can be tolerated to some extent.
3.2.2. OCF in Da2
In the case of a Da2 fault, the current passes through Dsa1 and Dsa2 for the O state, carrying a negative current, as illustrated in Figure 4c. As a result, Vdc/2 is the output pole voltage. As seen in Figure 6b, this led to a minor distortion of the negative phase current.
3.3. OCF Effect on the DC-Link Balance
Capacitor balance is achieved using Equation (14), where λ = 0.1. As illustrated in Figure 7a, the proposed algorithm achieved voltage balance. Under Sa1 OCF, the voltage across capacitor VDC1 exceeds that of VDC2 due to positive current distortion. The same for Sa2 fault as seen in Figure 7b,c. In Sa3 fault, switching states O and N are unattainable, preventing negative current flow. Consequently, VDC2 voltage surpasses VDC1 voltage, as illustrated in Figure 7d. Under Sa4 fault circumstances, the absence of negative phase current causes VDC2 voltage to become greater than VDC1 voltage, as shown in Figure 7e.


4. Fault Detection and Localization
4.1. Fault Identification Using MPC
Each phase is divided into two categories. For example, group 1 in phase a consists of the two top switches, Sa1 and Sa2, and the diode Da1. Group 2 consists of the two bottom switches, Sa3 and Sa4, and the diode Da2.
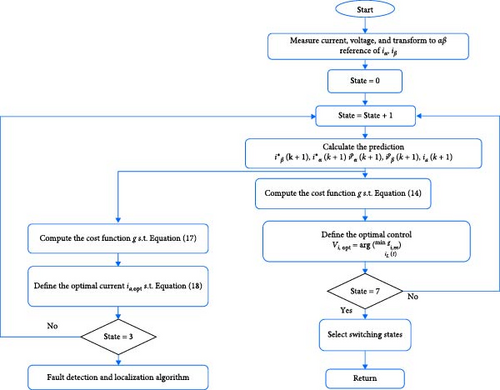
The predicted average current calculated using Equation (19) is shown in Figure 9 with multiple faults. The faults in the simulations are set to occur 0.05 s after the beginning of the first cycle. The faulty group is identified based on the findings.


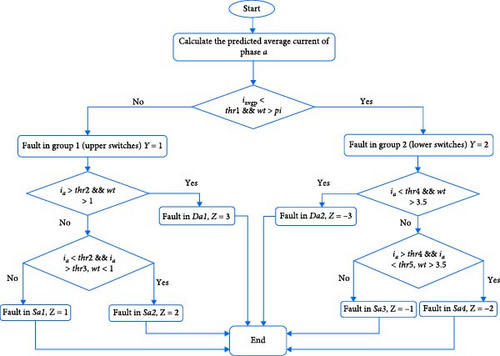
The predicted average current for group 2, Sa3, Sa4, and Da2, became negative at the moment of the fault, but for group 1, Sa1, Sa2, and Da1, it became negative after half a cycle of the fault occurrence. Based on these differences, the detection algorithm thresholds are set to distinguish between the two types of faults.
4.2. Identifying the Faulty Switch
To identify the exact location of the fault, the phase current results under each fault is used. As seen in Figure 5, the current under the faults Sa1 and Sa2 appears the same, but there is a slight difference in the signal at the beginning of the fault and the same is true for Sa3 and Sa4. Based on that slight difference in current, the thresholds are set to locate the fault precisely. Because of the model prediction’s influence on tolerating the fault, there is a very slight shift in current for Da1 and Da2 results, but it is also detectable.
In order to simplify the understanding of the results, we set two fault signal indicators Y and Z, as explained in Table 3. The flowchart in Figure 10 explains the algorithm used to localize the faulty group and switch. In this work, a trial-and-error method is used to define the thresholds. To identify the faulty group, the predicted average current is first calculated using Equation (19). Then, the results are compared to thr1 when ωt > pi. Finally, the current is compared to the remaining threshold in the corresponding time interval to determine the exact faulty switch or clamping diode. The results will be generated as signals Y and Z, as previously explained.
| Fault signal | Faulty switch | |
|---|---|---|
| Y | Z | |
| 0 | 0 | No fault |
| 1 | 1 | Sa1 |
| 1 | 2 | Sa2 |
| 1 | 3 | Da1 |
| 2 | −1 | Sa3 |
| 2 | −2 | Sa4 |
| 2 | −3 | Da2 |
5. Simulation Results
5.1. Fault Detection and Identification
5.1.1. The Faulty Group
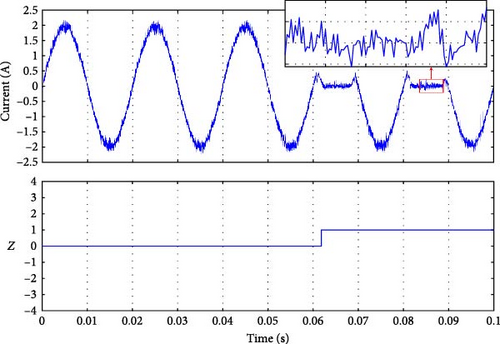
As seen in Figure 11b–d, the fault signal Y was set to detect the faulty group. At time 0.05 s, when the fault occurred, the magnitude of Y indicated the presence of a fault condition in group 1 (Sa1 or Sa2 or Da1). The only difference between the three results is the detection time. Similarly, for the fault in group 2, as shown in Figure 11e–g, the magnitude of Y was 2, corresponding to the fault in this group. The detection time listed in Table 4 is calculated by differentiating the actual moment of the fault occurrence (when the current reaches the faulty switch) [41–45], and the moment we conducted the fault t = 0.05 s.


| Y | Detection time (ms) | Z | Detection time (ms) | Faulty switch |
|---|---|---|---|---|
| 0 | 0 | 0 | 0 | No fault |
| 1 | 2 | 1 | 2 | Sa1 |
| 1 | 0 | 2 | 0 | Sa2 |
| 1 | 20 | 3 | 20 | Da1 |
| 2 | 0 | −1 | 0 | Sa3 |
| 2 | 0 | −2 | 0 | Sa4 |
| 2 | 10 | −3 | 10 | Da2 |
5.1.2. The Faulty Switch and Clamping Diode
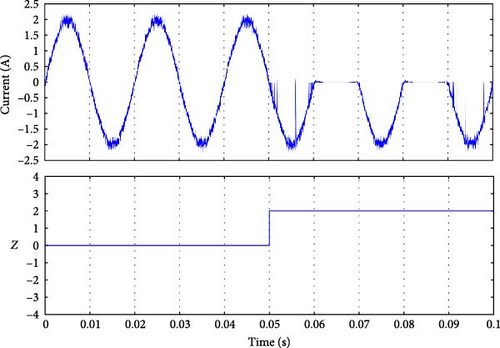
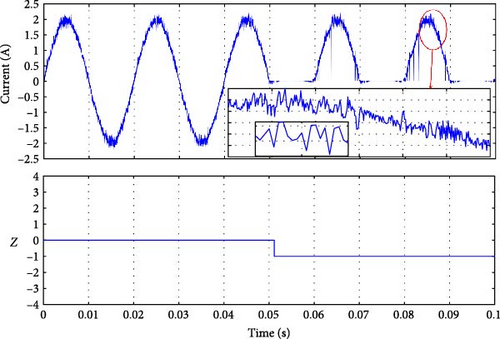
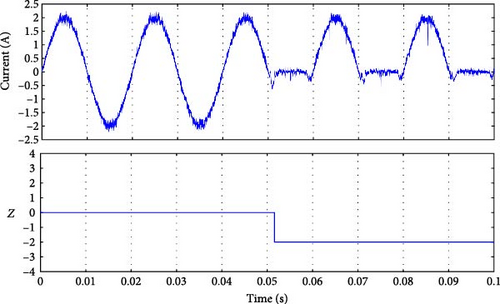
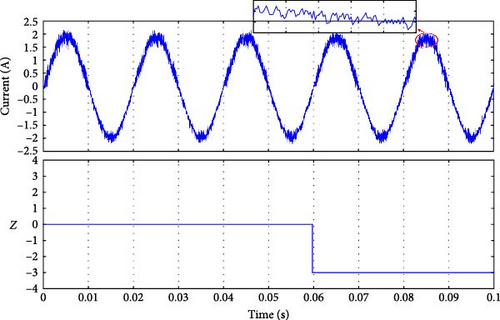
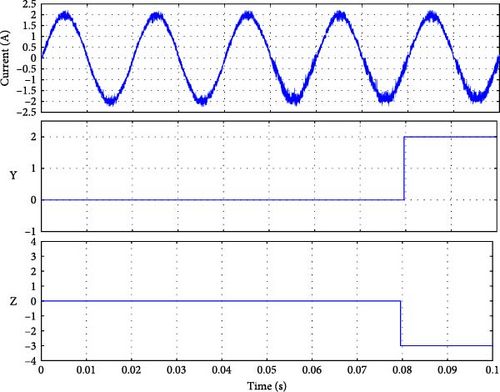
All of the fault signals were identified, as shown in Figure 12. Each fault corresponds to a unique Z value, the fault occurred at moment 0.05 s, the detection time varies, and the results are listed in Table 4. Further, Table 4 indicates that the faults in Sa3, Sa2, and Sa4 were detected simultaneously at the same moment when the fault happened (see Figure 12b–d). However, for Sa1, the fault was spotted after a few milliseconds because of the fault occurrence on the current, as shown in Figure 12a. The faults for Da1 and Da2 took longer to be identified, but it was still less than a cycle for Da2, and one cycle for Da1. Nevertheless, because the MPC tolerated the error, it will not affect the system.
5.2. Verification of Performance Analysis Under Parameter Drift and Unbalanced Grid Conditions
In order to confirm the efficacy of our system, several simulations under different conditions were performed. The faults were intentionally introduced on switches Sa1 and diode Da2 to test the detection algorithm. These components were selected randomly to verify the fault detection strategy’s generality.
5.2.1. Parameter Drift Analysis
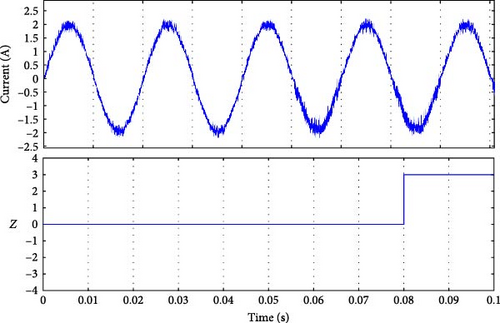
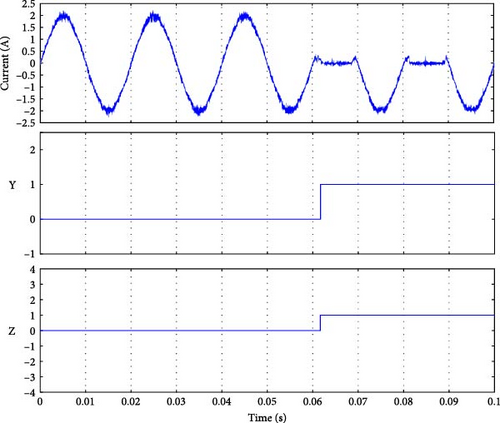
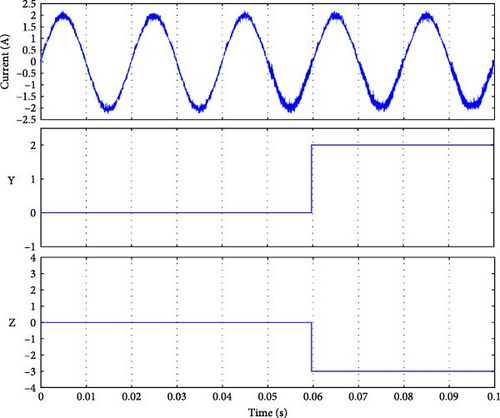
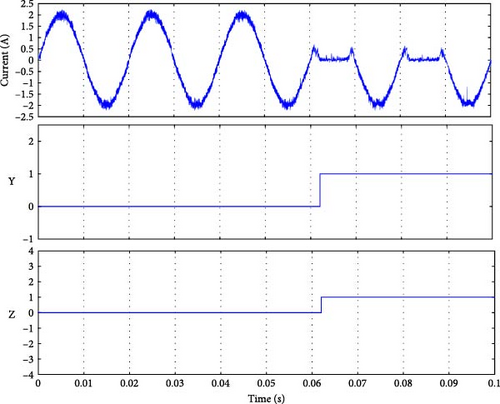
To verify the system under parameter drift, two scenarios were executed, the first is increasing the filter inductance by 20% and the second is reducing the filter resistance by 20%, then the fault in Sa1 and Da2 was conducted at t = 0.05 s. Figures 13 and 14 show the results of both scenarios, respectively. The fault detection time is mentioned in Table 5. As seen in the results, the detection and the localization of the faults are presented by Y and Z parameters, and the detection time is in a few milliseconds as expected, which confirms the robustness of the detection algorithm under these conditions.
| Case | Detection time (ms) | |
|---|---|---|
| Sa1 | Da2 | |
| L increase by 20% | 02 | 10 |
| R decrease by 20% | 02 | 30 |
| Va drops by 30% | 04 | 30 |
| Va drops by 80% | 10 | 50 |
5.2.2. Grid Voltage Distortion Analysis
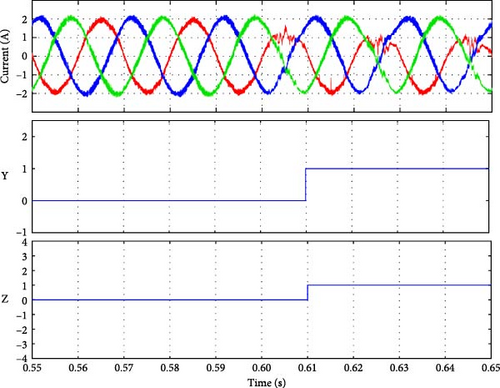
To evaluate the system’s behavior under distorted grid conditions, two scenarios were tested: a mild voltage sag with a 30% reduction in phase-a voltage, as shown in Figure 15a, and a more severe voltage drop of 80% test in phase a is performed, as shown in Figure 16a. The fault in both Sa1 and Da2 was conducted at t = 0.6 s, which is in the interval of the voltage drop. In the case of a 30% voltage drop, the resulting output current is shown in Figure 15b. This voltage reduction did not affect the behavior of the output current, thanks to the robust regulation provided by the MPC. The results following the presence of faults in Sa1 and Da2 are presented in Figure 17, with the corresponding fault detection times summarized in Table 5. As observed, the fault detection algorithm performed as expected, successfully detecting and identifying the faults within a few milliseconds, meeting the desired performance criteria.
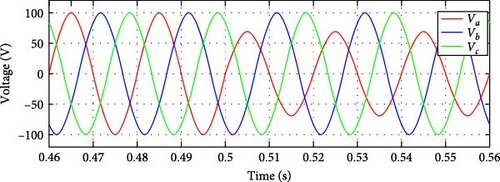
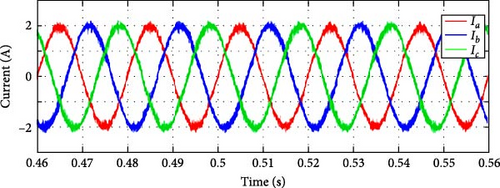

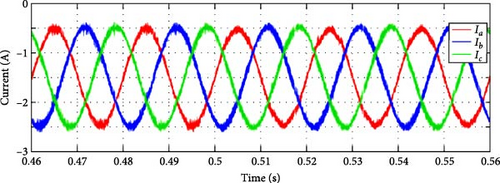
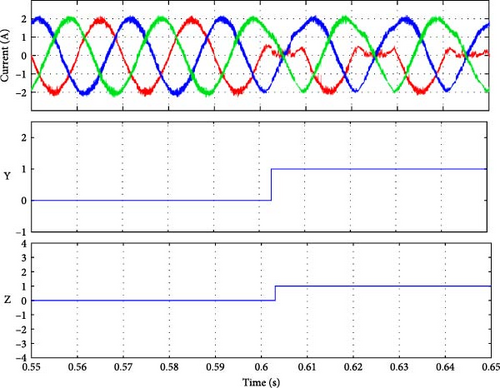
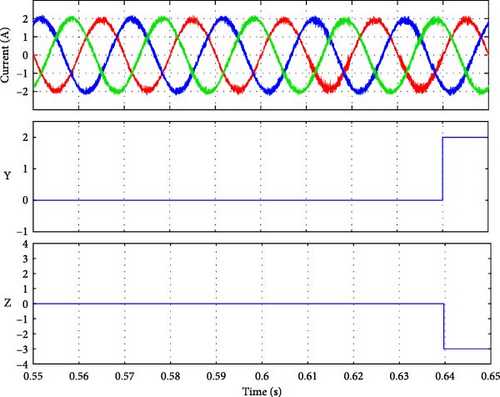
In the case of an 80% voltage drop, the resulting output current is shown in Figure 16b. This voltage reduction led to a small drop in the current of phase a regardless of the regulation provided by the MPC and this is because of the severe drop which is considered as a fault in the grid. The results following the presence of faults in Sa1 and Da2 are presented in Figure 18, with the corresponding fault detection times summarized in Table 5. As observed, the fault detection algorithm performance was accepted since it was able to detect and identify the faults within a few milliseconds without additional sensors or calculations, which meets with the desired objectives.

6. Hardware in the Loop Validation
This section evaluates the performance of the proposed controller using the CU-SLRT Std real-time digital simulator (equivalent to the DS1104 interface). A HIL simulation was employed to validate the efficacy of the model predictive controller and the fault detection algorithm within the proposed system. The CU-SLRT real-time board offers enhanced computational capabilities and additional functionalities compared to the DS1104. It features a 6-core 2.6 GHz processor, FPGA-based I/Os, 16 analog inputs, 8 analog outputs, 16 digital I/O ports, and 16 PWM outputs. Moreover, it includes two encoders and supports communication interfaces such as Ethernet and RS232 connectors.
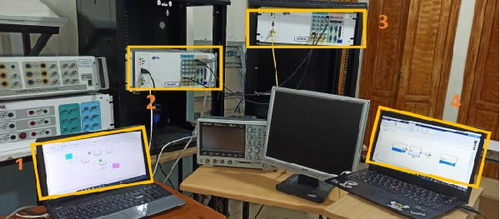
Figure 19 presents an image of the real-time experimental setup where MATLAB was used for the MPC with fault detection and inverter models. In this setup, two real-time systems with identical characteristics are used. The grid-connected three-phase NPC is initially modeled on a personal computer using MATLAB. This model is then executed onto the CU-SLRT real-time simulator (host-real time) via Ethernet and RS232 connectors. The system’s outputs are managed through ADC channels. In parallel, the MPC controller with the fault detection algorithm is modeled on a separate computer and operated onto a second real-time simulator, also connected through Ethernet and RS232 connectors. The inputs are similarly handled via DAC channels. The system parameters used in this experiment are shown in Table 6.
| Parameters | Value | Unit |
|---|---|---|
| DC-link voltage (Vdc) | 300 | V |
| Capacitor (C1, C2) | 1000 | µF |
| Filter inductance (L) | 40 | mH |
| Filter resistance (R) | 0.05 | Ω |
| Grid voltage (vg) | 130 | Vrms |
| Sampling frequency | 20 | kHz |
- Abbreviation: HIL, hardware-in-the-loop.
Figure 20 illustrates the results corresponding to open-switch faults in the NPC inverter. The current waveforms validate the fault condition, and the Y parameter accurately indicates the fault location, as previously explained. Table 7 presents the fault detection times in milliseconds. While the detection times differ from those observed in the simulation, they remain sufficiently brief to allow the system to tolerate the fault without causing irreversible damage to the equipment and the electrical system as a whole.


| Y | Detection time (ms) | Faulty switch |
|---|---|---|
| 1 | 3 | Sa1 |
| 1 | 11 | Sa2 |
| 1 | 32 | Da1 |
| 2 | 1 | Sa3 |
| 2 | 11 | Sa4 |
| 2 | 10 | Da2 |
- Abbreviation: HIL, hardware-in-the-loop.
To further evaluate the performance of the proposed fault diagnosis method, it is compared against several previously reported methods as summarized in Table 8.
| Reference | Inverter type | Detection parameter | Diagnostic content | Fault detection time | Fault identification time | Additional operations |
|---|---|---|---|---|---|---|
| [40] | Three-level NPC inverter (grid connected) | Three-phase currents | Switches, clamping diodes | ≈1 FP | ≈2 FP | Yes |
| [35] | Three-level NPC inverter (grid connected) | Three-phase currents | Switches, current sensor | ≤0.15 FP | No identification of faulty switch | No |
| [43] | Three-level NPC inverter (grid connected) | Three-phase currents | Switches | >0.5 FP | >0.5 FP | Yes |
| [44] | Three-level NPC inverter (grid connected) | Three-phase currents, grid voltage | Switches | ≤1 FP | ≤1 FP | No |
| [45] | Three-level NPC rectifier | Instant converter voltages | Switches | ≤0.15 FP | ≤0.15 FP | No |
| [41] | Three-phase PWM inverter | Three-phase currents | Switches, current sensor | ≈1.1 FP | No identification of faulty switch | No |
| [42] | Two-level voltage source | Three-phase currents | Switches, current sensor | 0.3–0.9 FP | 0.3–0.9 FP | No |
| Proposed | Three-level NPC inverter (grid connected) | Three-phase currents | Switches, clamping diodes | ≤0.5 FP | ≤0.5 FP | No |
- Abbreviations: FP, fundamental period; NPC, neutral point clamped.
7. Conclusion
This study focuses on detecting and localizing OCFs in grid-tied 3-L-NPC inverters. A new algorithm, integrating distorted current analysis with MPC, is introduced for efficient fault identification. This algorithm can detect faulty switches and clamping diodes in less than one fundamental period, providing a rapid solution without requiring additional hardware or complex calculations. The functionality of this approach is established through the analysis of the predicted average phase current, calculated via MPC after introducing various faults at specific times. Additionally, distorted current analysis is used to precisely detect the faulted switch and clamping diode. The effectiveness of MPC in tolerating OCFs in clamping diodes is demonstrated by the output current, and simulation results confirm the reliability of the proposed fault detection algorithm. The HIL experiment validates these results for the faulty group. Furthermore, the proposed algorithm was verified under parameter drift and voltage imbalance conditions, demonstrating its robustness and proper functionality in these challenging scenarios. Future work will focus on detecting other types of faults in grid-tied NPC inverters, thereby enhancing the comprehensiveness and applicability of fault detection strategies in grid-connected converters.
Conflicts of Interest
The authors declare no conflicts of interest.
Funding
This study did not receive any funding in any form.
Acknowledgments
The authors have nothing to report.
Open Research
Data Availability Statement
The data are available upon request from the authors.


