Utilizing Fuzzy Logic Control and Neural Networks Based on Artificial Intelligence Techniques to Improve Power Quality in Doubly Fed Induction Generator-Based Wind Turbine System
Abstract
This article presents novel artificial intelligence (AI)-based techniques for controlling wind energy conversion systems, specifically fuzzy logic control and neural networks, known as fuzzy hysteresis-direct power control (FH-DPC) and neural hysteresis-DPC (NH-DPC), respectively. The primary purpose is to overcome conventional DPC (C-DPC) limitations in doubly fed induction generator wind turbines (WT-DFIG), focusing on power quality improvement and enhanced system efficiency. The techniques aim to reduce power ripples and improve the quality of alternating current (AC) grid energy by improving current signal quality in all WTs’ operation modes with WT-DFIG and all compensation power modes. The suggested techniques are thoroughly examined using the MATLAB/Simulink environment under various wind scenarios, demonstrating a reduction in active power ripples by over 70%, a reduction in reactive power ripples of around 77% on average, a decrease in generated current total harmonic distortions (THDs) by over 70% compared to C-DPC. The performances of FH-DPC and NH-DPC are contrasted with C-DPC and other previously suggested methods, and it is concluded that the proposed control approaches perform more effectively than them regarding ripples in local reactive compensation and generated active powers as well as THD currents, with FH-DPC slightly outperforming NH-DPC. The research indicates that AI can enhance the effectiveness and quality of power generated by wind-power systems.
1. Introduction
The global demand for electrical energy continues to rise due to population growth and industrial expansion. However, traditional fossil fuel-based energy sources face challenges of resource scarcity and environmental concerns. Consequently, renewable energy sources, particularly wind energy, have gained prominence for their clean energy production and rapid growth potential [1].
Doubly fed induction generators (DFIGs) have emerged as a preferred choice for converting wind turbine (WT) mechanical energy into electrical energy. Their wide operating speed range, high efficiency, and ability to independently generate and regulate active and reactive powers make them ideal for variable-speed wind farms [2].
Effective control techniques are crucial for managing the energy quality delivered into the alternating current (AC) grid by wind energy conversion systems. Over the years, researchers have proposed various strategies to enhance DFIG control techniques, each with its own merits and limitations.
Conventional controllers, such as indirect vector control (IVC) [3], were initially used but suffered from parameter dependency and lack of robustness. Direct torque control (DTC) [4] and direct power control (DPC) [5] methods were introduced to address these issues, offering improved responsiveness and easier implementation. However, these techniques still faced challenges, such as high-power ripples and variable switching frequency.
Efforts to improve DPC led to the development of several advanced techniques. The initial improvement of conventional DPC (C-DPC) was examined by the authors according to Zhi and Xu [6]. They suggested DPC that has a constant switching frequency, which was later employed in subsequent studies [7, 8] using space vector modulation (SVM) to better the quality of power and decrease ripples in power, but it required precise system parameter knowledge. Adaptive control [9] and predictive DPC [10, 11] models were introduced to optimize voltage vector selection, but these approaches increased complexity and computational demands. Nonlinear control methods such as sliding mode control (SMC) [12, 13], backstepping control (BC) [14, 15], and fractional-order synergetic [16] were integrated with DPC, showing improved performance but at the cost of increased complexity.
More recently, intelligent control techniques have gained traction due to their ability to handle complex control rules with high precision and flexibility. Fuzzy logic [17–21] and neural networks [22–27] approaches have been applied to enhance DPC in various ways, such as replacing switching tables, optimizing controller variables, and improving sophisticated controllers like sliding mode and SVM-DPC techniques. However, many of these studies were limited in scope, often focusing on only two out of DFIG’s four modes of operation or not considering all aspects of system performance under realistic operating conditions. Additionally, the modifications proposed by some of these intelligent control techniques have raised concerns about maintaining the simplicity that is a key advantage of DPC.
Previous studies lacked comprehensive validation of control system performance across critical WT-DFIG factors. These include random variable speed wind profiles and control of both compensated local reactive and produced active powers in every DFIG working mode, including overspeed, synchronous, subsynchronous, and super-synchronous. Most works focused on limited operating conditions, neglecting the system’s full range of capabilities and real-world wind variability. This gap highlights the need for more thorough validation of WT-DFIG system performance under realistic, dynamic conditions that account for sudden wind speed variations and all operational modes.
The motivation for this research stems from the pressing need to overcome C-DPC’s drawbacks. in WT-DFIGs, particularly the issues of variable switching frequency and power quality degradation. As wind energy continues to play a crucial role in the global transition to renewable energy sources, improving the quality and reliability of power generated from WTs becomes increasingly important.
Two novel artificial intelligence (AI) methods have been proposed in the present study, neural hysteresis DPC (NH-DPC) and fuzzy hysteresis DPC (FH-DPC), to overcome C-DPC drawbacks in wind energy systems using DFIGs. These techniques aim to enhance the system’s effectiveness, improve power quality by eliminating ripples, and achieve better control of compensated local reactive power and produced active power, and the overall quality of currents and generated energy injected into the AC grid. The primary purpose of this work is to demonstrate how AI techniques can be effectively applied to enhance DFIG-based wind energy systems’ overall performance and power quality through enhanced DPC strategies.
- •
AI-enhanced DPC: This paper proposes a novel approach to DPC that uses AI to replace hysteresis comparators within the C-DPC structure. This substitution allows for more accurate power ripple reduction and minimization of current distortion, resulting in a significant improvement in power quality.
- •
Comprehensive validation under a realistic set of operating scenarios: The effectiveness of the proposed AI-based DPC method is rigorously evaluated under realistic operating conditions that include random wind speed fluctuations. This comprehensive validation process ensures the effectiveness of the method over the entire operating range of DFIGs and various reactive power compensation modes.
- •
Optimization of DPC performance through AI techniques: This paper investigates the potential of AI techniques to optimize DPC performance. The proposed AI-based approach offers distinct advantages over traditional methods, including enhanced simplicity, improved precision, and increased robustness while preserving the core benefits inherent in DPC technology.
- •
Comparative evaluation demonstrating superior performance: A comparative evaluation is meticulously conducted to evaluate the proposed AI-based DPC method against both C-DPC and previously proposed DPC methods. This evaluation conclusively demonstrates that the proposed techniques achieve superior performance, which represents a significant advancement over existing strategies.
The proposed NH-DPC and FH-DPC techniques are designed to achieve optimal functionality across all DFIG modes—overspeed, synchronous, supersynchronous, and subsynchronous—while effectively managing local reactive power compensation in modes like unit power factor operation, reactive power generation, and absorption. These methods are examined using simulations that replicate real wind system operations, allowing for continuous assessment of their effectiveness.
Comparative analysis with C-DPC and previously suggested methods, such as NN-DPC and NF-DPC developed in [23], demonstrates the superior performance of our AI-based approaches. This work not only advances the state-of-the-art in DPC for wind energy systems but also highlights the significant potential of AI in enhancing power quality and overall system performance in renewable energy applications.
The remainder of this paper is organized as follows: Section 2 presents the mathematical models of the WT and DFIG. Section 3 describes the proposed NH-DPC and FH-DPC techniques. Section 4 discusses the simulation results and comparative analysis. Finally, Section 5 concludes the paper and suggests future research directions.
2. Materials and Methods
2.1. Description of the WT-DFIG System
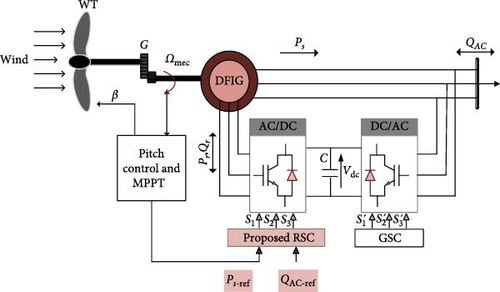
The suggested DPC technique for a wind power conversion system based on DFIG is demonstrated in Figure 1. The system consists of a WT and a gearbox, which work together to transform the kinetic energy of wind into mechanical energy. The DFIG subsequently converts this mechanical energy into electrical energy. Whereas the rotor is indirectly linked to the AC grid via an AC frequency converter that includes dual power converters, AC/DC and DC/AC, the DFIG’s stator is directly linked to the grid. The suggested DPC controls are applied to the converter that is linked to the DFIG rotor side to deal with the production of active power and compensation of local reactive power. The converter that is linked to the AC grid side is controlled to ensure a unit power factor and a sinusoidal current with a steady frequency of 50 Hz.
2.2. WT Modeling
With
where Ωt represents the speed of the turbine rotor.
2.3. WT Systems’ Operating Zones
As illustrated in Figure 2, WTs with variable speeds are operating in a variety of areas, including three different zones. Very low wind speeds, present in the zone before the first, prevent the turbine from turning. The “cut-in” speed is when the wind speed triggers the turbine to start producing power. The wind speed rises in the first zone when the nominal power is greater than the produced power. Zone two is where zone I’s generated power transitions to zone III’s maximum power. WT extracts the maximum power in both zones at a 0° blade pitch angle β using the maximum power point tracking (MPPT) algorithm.
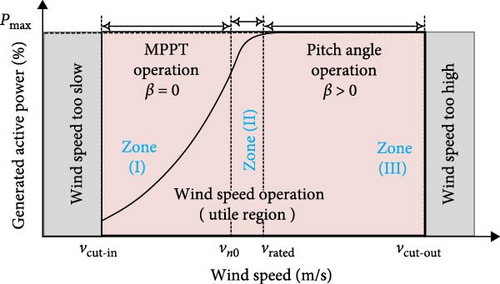
In Zone 3, the speed of the wind surpasses the nominal speed of the wind, and by modifying the blade pitch angle β, the nominal output power limit is established by the pitch angle control mechanism. As a precaution, the DFIG rotor is disconnected from the turbine when the wind speed in the third operating zone reaches its maximum. This power interruption is required to avoid damage and safeguard the turbine [4, 30].
2.3.1. Algorithm for Tracking Maximum Power Point
Zone 2 is a nonlinear, parabolic power curve for WTs that permits a zero-pitch angle β. Furthermore, the power coefficient Cp attains its highest value [4, 30]. To ensure that wind power is tracked as efficiently as possible, DFIG’s speed must be derived from the MPPT technique.
To optimize wind energy extraction most efficiently, a strategy, including speed regulation by DFIG, is used. This strategy entails the use of the MPPT algorithm, such as the P&O technique. By implementing this algorithm, the DFIG’s rotational speed is adjusted to match the maximum power point of the WT power curve. This synchronization ensures that the WTs operate at the highest possible efficiency, maximizing the conversion of wind energy into electrical energy [29].
2.3.2. Pitch Angle Control Algorithm
In Zone 3, to safeguard the electrical generator system, the blade pitch angle control of the WT helps to restrict the produced power to its rated value when the wind speed surpasses the rated speed (overspeed). By regulating the power output and controlling the blade pitch angle with a proportional integral (PI) controller. In addition to producing electricity at its best, the system can safeguard its electrical generators and power converters [4, 28]. Thus, power regulation and blade pitch angle control together guarantee the WT system’s safe and effective functioning in overspeed mode.
2.4. DFIG Modeling
The DFIG’s mathematical model in the dq frame is given as follows:
3. Fundamental Principles of DPC
3.1. DPC Overview
- •
Direct control of generated active power (Ps).
- •
Direct control of compensation local reactive power (QAC).
Based on these objectives, the control system generates optimal rotor voltage vectors for the rotor-side converter (RSC).
3.2. Mathematical Foundation
3.2.1. Power-Flux Relationships
The stator flux |φs| is kept constant by connecting the DFIG stator directly to the balanced AC grid. However, the active power and local reactive power compensation change with variations in the angle of the rotor-stator flux and the rotor flux.
3.2.2. Rotor Flux Dynamics
According to Equation (13), the rotor flux variance is influenced by the choice of rotor voltage vector and the length of time it is applied. Consequently, by selecting the proper voltage vector, the rotor flux’s amplitude and angle can be adjusted. Moreover, a voltage vector is generated by the two-level inverter between two switching processes out of a group of eight voltage vectors, six of which have the same amplitude and two of which have zero amplitude. In contrast, the difference in the QAC and the Ps powers is impacted by the outcome of the rotor flux variation. Figure 3 displays how every rotor voltage vector affects the local reactive power compensation and active power.

3.2.3. Choosing the Proper Voltage Vector
To choose the proper rotor voltage vector to achieve desired changes in active power Ps and reactive power compensation QAC the effect of each vector on the rotor flux sector must be considered, as depicted in Figure 3. For example, when operating in rotor flux sector 1, applying voltage vector 5 increases both Ps and QAC, vector 6 increases Ps while decreasing QAC, and vector 2 decreases both, and so on. The goal, whether increasing/decreasing Ps and/or QACdetermines the appropriate output rotor voltage vector selection. More specifically, the vector is chosen based on its effect of increasing or decreasing active power and reactive power compensation in the given rotor flux sector.
3.2.4. Powers and Rotor Flux Estimation
3.3. C-DPC
3.3.1. System Architecture
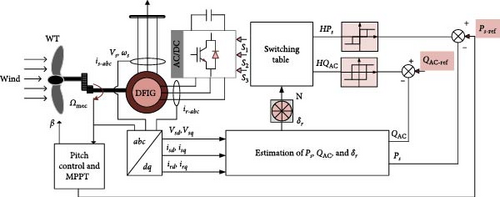
C-DPC is a control that uses a switching table and hysteresis comparators. The WT-DFIG C-DPC basic scheme system is depicted in Figure 4. The main advantages of this approach are its fast dynamic response and straightforward control structure.
3.3.2. Hysteresis Power
In order to provide compensated local reactive power switching states and produced active power, three and two-level hysteresis bands were chosen for ePs and eQAC, respectively, as shown in Figure 5.
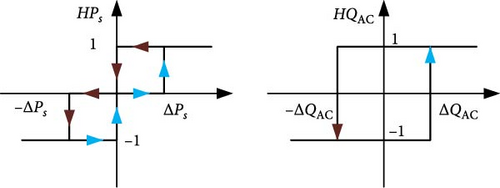
In order to obtain the powers switching states. First, a comparison is made between the estimated values of active and reactive powers and their references. Then, digitizing the errors via hysteresis comparators. Therefore, the output is a value representing the effect that occurs to both the active power HPs (−1,0 or 1) and the local reactive power compensation HQAC (−1 or 1). Furthermore, errors are reduced inside of the bands of the hysteresis comparators.
HPs represents the active power regulator output, so when it is an output that represents (HPs = 1), it means that it is a power that needs to be increased, (HPs = −1) to decrease, or (HPs = 1) does not affect it. Therefore, (HQAC) represents the local reactive power compensation regulator output, so when it is an output that represents (HQAC = 1), it means its power needs to be increased and (HQAC = −1) to decrease.
3.3.3. Switching Table
Table 1 illustrates the switching table of C-DPC, based on the principle shown in Figure 3. This table is used to establish the rotor voltage vector (Vn) appropriate for the inverter. It will have found on the active and reactive powers hysteresis comparators output errors (HPs and HQAC) and the rotor flux sector (N), which is computed by establishing six angular sectors within the rotor flux space.
| HQAC | HPs | Number of sectors | |||||
|---|---|---|---|---|---|---|---|
| 1 | 2 | 3 | 4 | 5 | 6 | ||
| +1 | +1 | V5 | V6 | V1 | V2 | V3 | V4 |
| 0 | V7 | V0 | V7 | V0 | V7 | V0 | |
| −1 | V3 | V4 | V5 | V6 | V1 | V2 | |
| −1 | +1 | V6 | V1 | V2 | V3 | V4 | V5 |
| 0 | V0 | V7 | V0 | V7 | V0 | V7 | |
| −1 | V2 | V3 | V4 | V5 | V6 | V1 | |
- Abbreviation: C-DPC, conventional direct power control.
4. Advanced DPC Strategies
The C-DPC approach, while effective, faces certain limitations, including variable switching frequency and response delays in hysteresis comparators. To address these challenges, two advanced control strategies have been developed based on AI techniques. These innovative approaches—FH-DPC and NH-DPC—maintain the fundamental advantages of C-DPC while introducing sophisticated control mechanisms to enhance overall system performance. By leveraging AI, these advanced strategies offer improved power quality, reduced power ripples, and more precise control over active and reactive power compensation. The following sections detail the implementation and characteristics of these advanced control methodologies.
4.1. FH-DPC
4.1.1. System Overview
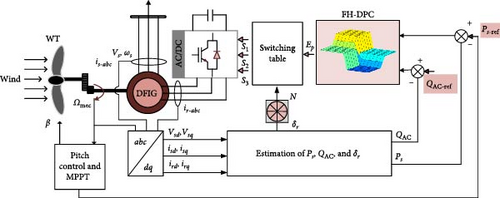
The objective of the proposed controls is to enhance the performance of C-DPC and eliminate issues associated with the response delay of hysteresis comparators. The system diagram for the FH-DPC control is illustrated in Figure 6.
4.1.2. Fuzzy Hysteresis Power
The hysteresis comparators principle served as the basis for the design of the FH-DPC controller. This one has two inputs with a single output. It replaces the compensated local reactive and generated active powers hysteresis comparators with a single fuzzy logic controller, as shown in Figure 7. Indeed, the two inputs are powers errors (ePs and eQAC) and the output is a single digital value, that represents both powers errors (Epowers). The proposed FH-DPC design was implemented using these steps.

4.1.2.1. Fuzzification
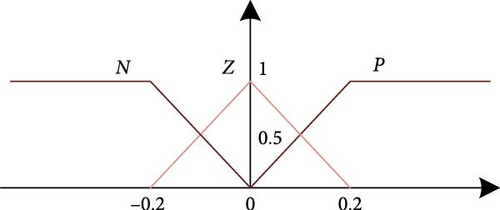
Input variables are transformed into linguistic variables using membership functions (MFs). Active power error has three MFs (P, Z, and N), while reactive power error has two MFs (P and N) (as presented Figures 8 and 9).

4.1.2.2. Fuzzy Rules
Six rules are designed based on both power hysteresis comparators, using the Mamdani inference method, as shown in Table 2.
| eQAC/ePS | P | Z | N |
|---|---|---|---|
| P | E1 | E2 | E3 |
| N | E4 | E5 | E6 |
- Abbreviation: FH-DPC, fuzzy hysteresis-direct power control.
4.1.2.3. Defuzzification
To convert the fuzzy inference results into measurable output is the aim of the defuzzification process. The “Bisector” approach is used in this work to defuzzify.
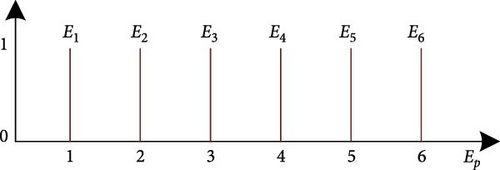
The output (Epowers) is the digital error powers, which has six singletons MFs (E1 … E6), as presented in Figure 10.
4.1.3. Switching Table
The choice of the rotor voltage vector (Vn) appropriate for the AC/DC converter will based on the output of the rotor flux sector and digital error powers (Epowers) using the switching table provided in Table 3.
| Epowers | N | |||||
|---|---|---|---|---|---|---|
| I | II | III | IV | V | VI | |
| E1 | V5 | V6 | V1 | V2 | V3 | V4 |
| E2 | V7 | V0 | V7 | V0 | V7 | V0 |
| E3 | V3 | V4 | V5 | V6 | V1 | V2 |
| E4 | V6 | V1 | V2 | V3 | V4 | V5 |
| E5 | V0 | V7 | V0 | V7 | V0 | V7 |
| E6 | V2 | V3 | V4 | V5 | V6 | V1 |
- Abbreviation: FH-DPC, fuzzy hysteresis-direct power control.
4.2. Artificial Neural Network (ANN) Control Based on DPC (NH-DPC)
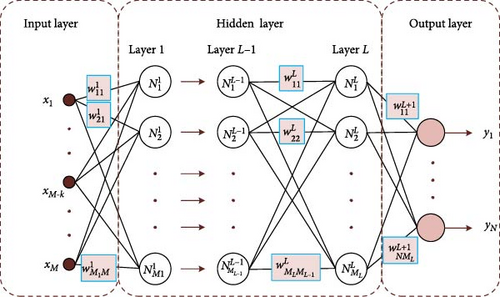
Electrical optimization and control are two of the many sectors that employ ANNs, which are approaches for machine learning. Their capacity to gain knowledge from data, process information swiftly, and provide precise predictions is what makes them so popular. ANNs consist of multiple layers (input, hidden, and output) with interconnected neurons linked by weighted connections, as illustrated in Figure 11.
4.2.1. Architecture Design
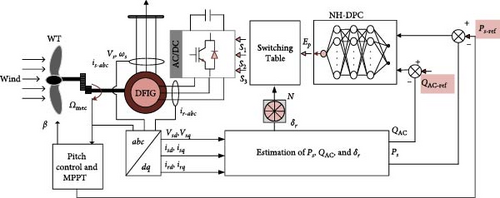
This section proposes a new direct power neural network control that utilizes a single neural network as a control instead of two hysteresis comparators. Instead of hysteresis or fuzzy logic, the proposed DPC employs a neural network to generate digital power errors. The structure of the WT-DFIG with the suggested control (NH-DPC) applied to the WT-DFIG system is shown in Figure 12.
4.2.2. The Neural Network Operating Principle
4.2.2.1. Feed-Forward Algorithm
The activation function is applied to the sum of the input vector multiplied by the associated weight vectorw1 = [wk11, wk21, ⋯, wkM1] in addition to the bias value. For a single neuron in the first hidden layer, as described in Figure 13. It is mathematically described as follows [27, 32, 33]:
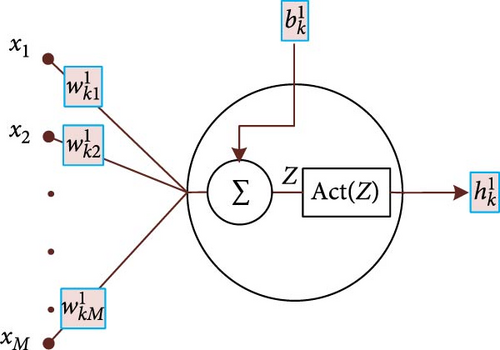
The initial hidden layer is indicated by the superscript (w, b, and h).
- •
The praline function
- •
The sigmoid function
4.2.2.2. Back Propagation Algorithm
The Levenberg–Marquardt method, a form of backpropagation, is employed for supervised learning. By propagating through hidden layers to the input layer, this approach calculates the gradient of the output layer’s cost function.
4.2.3. Neural Network Hysteresis Power
The appropriate data must be prepared before establishing and learning a network. For that, the input features and output must be defined. Thus, there are two input features, namely, the compensated local reactive and produced active powers errors (eQAC, ePs), and the output is a digital powers error (Epowers). Some samples used for this neural network are shown in Table 4.
| No. of samples | eQAC | ePs | Epowers |
|---|---|---|---|
| 1 | −0.4 | −0.82 | 6 |
| 2 | −0.18 | +0.05 | 4 |
| 3 | +0.2 | +0.92 | 1 |
| 4 | +0.98 | −0.24 | 3 |
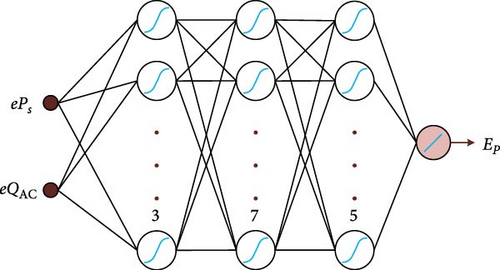
The proposed topology for NH-DPC is shown in Figure 14. After conducting multiple experiments, the most optimal structure was determined. The network architecture includes an input feature layer, three hidden layers consisting of three, seven, and five neurons, respectively, and a layer of output that employs the praline function. The activation function used across all hidden layers is the sigmoid function.
Proper training is essential for achieving high performance in the NH-DPC neural network. To accomplish this, 70% of the total 14,400 data samples were used for training, while 15% were assigned for validation and another 15% for testing. The Levenberg–Marquardt approach, which is based on the MSE cost function, was used during the learning phase.
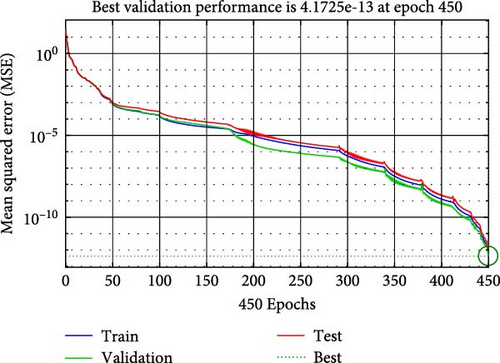
The development of the neural network was carried out using MATLAB’s Neural Network Toolbox. Multiple experiments were conducted, and all of them resulted in similar outcomes in terms of efficiency and time. Figure 15 demonstrates the validation performance of the proposed neural network (NH-DPC), which achieved a value of 4.17e−13 after 430 iterations, taking approximately 1.5 min.
4.2.4. Switching Table
To choose the rotor voltage vector (Vn) appropriate for the AC/DC converter. It is dependent on the rotor flux sector and neural network (Epowers) output. This choice uses the same switching table as in the fuzzy logic control, as given in Table 3.
5. Results and Discussions
This study employed MATLAB/Simulink to analyze the performance of the C-DPC, NH-DPC, and FH-DPC methods employed in the WT-DFIG system, as illustrated in Figures 4, 6, and 12, respectively. There are two separate sections of the examination, using fixed steps and randomly variable wind profiles. The purpose of these two parts was to replicate a previous study [23] while also incorporating insufficient operating circumstances to make the study more complete. Furthermore, the goal of these parts was to compare the NH-DPC and FH-DPC control approaches offered in this paper with those proposed in [23], namely NN-DPC and NF-DPC. The system parameters introduced in [28] are presented in Table 5, where ηDFIG = 0.98.
| Parameter | Value | Parameter | Value |
|---|---|---|---|
| Rated power (kW) | 7.5 | 0.081 | |
| Frequency (Hz) | 50 | 0.0664 | |
| Pole (pairs) | 3 | Rt(m) | 3.24 |
| Rs(Ω) | 1.02 | G | 5.065 |
| 0.093 | ρ(kg/m3) | 1.125 |
The control flow and operation of the three DPC strategies are summarized in the flowchart shown in Figure 16. As illustrated in the flowchart, the three DPC strategies follow the same overall control flow. The estimated active and reactive compensation power values are compared with their references to generate error signals. These errors are then fed into the respective hysteresis controller for each strategy, and then the outputs of the respective hysteresis and rotor flux sector are used in the respective switching table to select the rotor voltage vector. The selected rotor voltage vector is employed in the RSC.
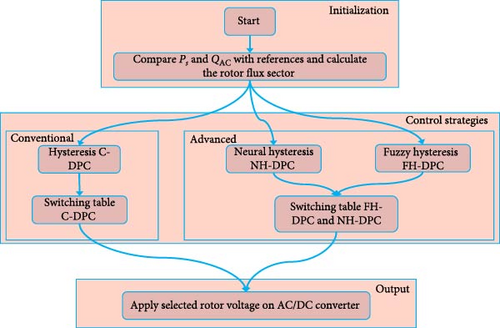
The main difference between the strategies is in the implementation of the hysteresis controllers. C-DPC utilizes fixed-band hysteresis controllers. FH-DPC employs fuzzy logic-based hysteresis controllers. And NH-DPC uses neural network-based hysteresis controllers.
5.1. A Profile of Step Wind Speed
This section’s goal is to assess how well the five controllers used for reference tracking performed, namely C-DPC, NH-DPC, FH-DPC, and two methods suggested in [23], NF-DPC and NN-DPC. Furthermore, C-DPC, NH-DPC, and FH-DPC’s performance in local reactive power compensation modes, which were not assessed in [23], will also be compared.
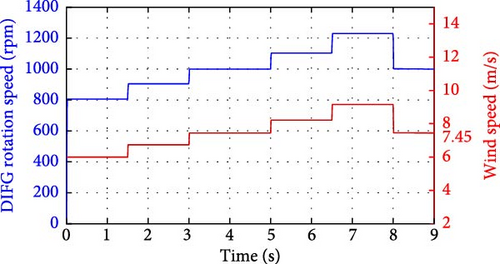
In order to evaluate the performance and effectiveness of the proposed DPC approach in a system WT-DFIG, tests were conducted using a step-like wind profile with wind speeds ranging between 6 and 9.1 m/s. This profile of wind was designed to have fast changes in wind speed at specific time points and constant wind speed in between changes to satisfy the standards for mechanical speed of the three DFIG system operating modes. Following the system’s 1000 rpm synchronous speed, these modes were selected. For the first 3 s, the sub-synchronous mode is in on (the mechanical speed that is less than 1000 rpm), then synchronous mode for 3–5 s, and between 8 and 9 s (mechanical speed of exactly 1000 rpm), and finally super-synchronous mode between 5 and 8 s (mechanical speed above 1000 rpm). Figure 17 displays the mechanical velocity profiles and wind velocity profiles for each operating mode.
The active power reference Ps−ref is affected by changes in wind speed. Indeed, the suggested control techniques (NH-DPC, FH-DPC) and C-DPC have an effect on the active power produced by WT-DFIG. It appropriately conforms to its reference value, as illustrated in Figure 18. Then, Ps the power is always delivered into the AC grid and has a negative indication throughout every DFIG operating mode.
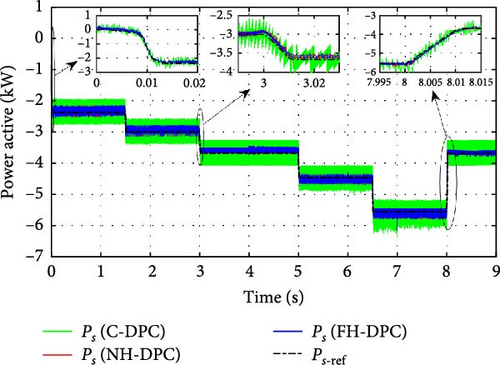
In Figure 18, we have magnified the transitional periods between different operating modes to assess the effectiveness of every approach by assessing the dynamic response. These zooms demonstrate that the system responds quickly and tracks the references perfectly across all periods of transitional between the different modes of operating. The finding is valid for two strategies proposed in this study (NH-DPC and FH-DPC) and C-DPC.
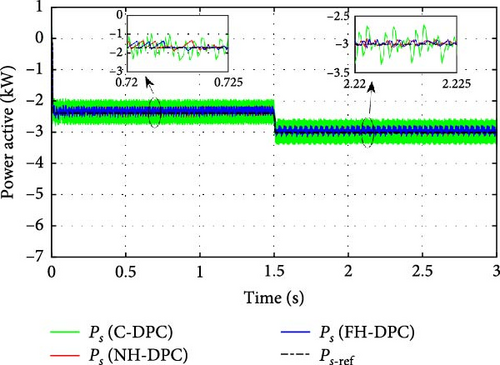
To analyze the steady-state performances of the proposed strategies. The active power for each operating mode is displayed individually in Figures 19–21 together with its reference. It is evident from these figures that the ripples in the active power of the C-DPC approach are relatively wide and significantly reduced by adopting the proposed methods NH-DPC and FH-DPC throughout every operating mode.
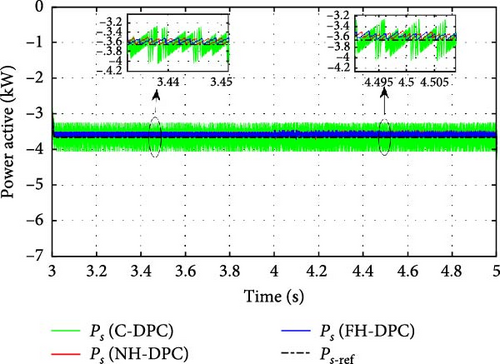
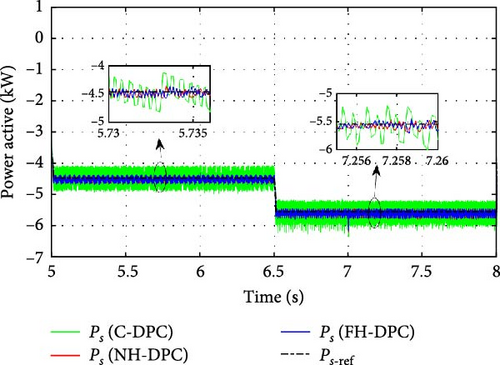
To validate the efficacy of every strategy, Table 6 shows the results of estimating the mean ripple range using the standard deviation. Compared to C-DPC, both NH-DPC and FH-DPC exhibit a substantial enhancement, with more than 70% enhancement achieved in every mode. Moreover, FH-DPC and NH-DPC perform similarly, with FH-DPC slightly outperforming NH-DPC in subsynchronous and synchronous modes. With an average rise in performance of 10%, the two suggested controls (NH-DPC and FH-DPC) likewise perform better than the alternatives listed in [23].
| Outcomes | Mode of DFIG operation | ||
|---|---|---|---|
| Synchronous | Sub | Super | |
| Ps ripples (W) | |||
| C-DPC | 193.98 | 203.06 | 202.85 |
| NH-DPC | 37.9 | 58.35 | 54.96 |
| FH-DPC | 37.82 | 58.05 | 55.56 |
| Ripples reduction ratio | |||
| NH-DPC contrasted to C-DPC | 80.46% | 71.26% | 72.91% |
| FH-DPC contrasted to C-DPC | 80.5% | 71.41% | 72.61% |
| NF-DPC contrasted to C-DPC | 67.99% | 67.13% | 64.79% |
| FH-DPC contrasted to NF-DPC | 15.54% | 6% | 10.77% |
- Abbreviations: C-DPC, conventional direct power control; DFIG, doubly fed induction generator; FH-DPC, fuzzy hysteresis-direct power control; NH-DPC, neural hysteresis-direct power control.
The reference values determine how NH-DPC, FH-DPC, and C-DPC affect the local reactive power compensation. This one has three operating modes. Indeed, the WT-DFIG system absorbs or generates it, or it operates with a unit power factor. QAC−ref power is determined by the demand on the AC grid, as shown in Figure 22.
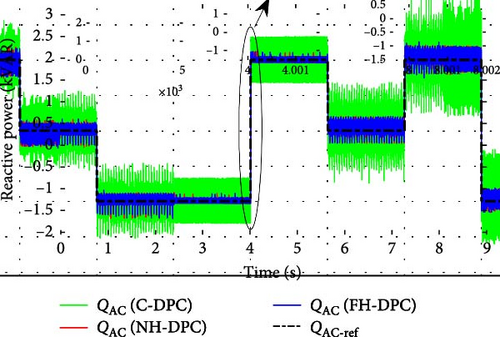
To execute local reactive power compensation, reactive power from the grid is absorbed by the system when a positive reference signal is employed. It acts like an inductor. This happens between 0 and 1 s, between 4 and 5 s, and between 6 and 7 s. Between 2 and 4 s as well as 7 and 8 s, the system collects reactive power from the AC grid when the local reactive power compensation reference value (QAC−ref) is negative. It functions as a capacitor. By ensuring that there is no communication between the WT-DFIG and the AC grid, the control mechanism ensures that the AC grid runs at the unit power factor. This conducts like a resistor. From [1s, 2s] to [5s, 6s] to [8s, 9s], this is evident.
Figure 22 has been zoomed in to observe how NH-DPC, FH-DPC, as well as C-DPC methods, impact the compensated local reactive power system’s response time during brief intervals between various compensation modes. The dynamic response is adequate for all three control approaches, as seen in the zoomed figures.
Figures 23–25 are used to analyze the evolution of compensated local reactive power during steady-state operation, separately for each mode of operation. The suggested NH-DPC and FH-DPC approaches have importantly reduced the ripples in local reactive power compensation contrasted to the C-DPC control technique. The ripples in the local reactive compensation power of the C-DPC control are relatively large. This finding holds true for each operating mode of DFIG, including synchronous, sub-synchronous, and super-synchronous modes, in addition to all compensated local reactive power modes, including absorption, unit power factor operation, or generation.
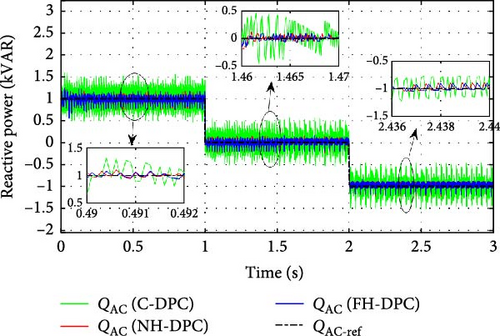
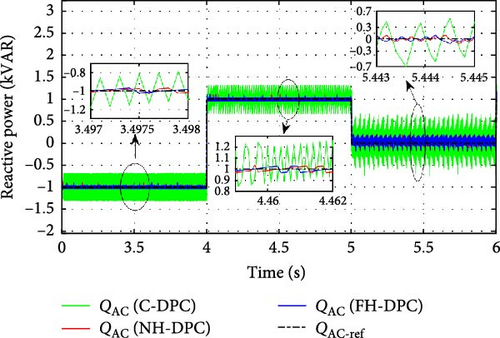
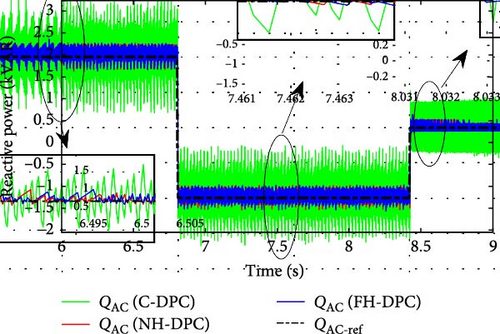
To illustrate each control method’s efficacy, the results of the average ripple range are summarized in Table 7. Importantly, NH-DPC and FH-DPC both perform better than C-DPC, with a 77% average enhancement throughout all different compensation and operating modes. Moreover, FH-DPC performs slightly better than NH-DPC in all modes except for synchronous mode operation, where the roles are reversed. Both proposed controls also outperform the options listed in [23], with a 23% increase on average.
| Outcomes | Modes of compensation | ||||||||
|---|---|---|---|---|---|---|---|---|---|
| Unit power factor | Generation | Absorption | |||||||
| Modes of operation | Synch | Super | Sub | Synch | Super | Sub | Synch | Super | Sub |
| QAC ripples (Var) | |||||||||
| C-DPC | 228.03 | 232.3 | 189.67 | 169.47 | 240.52 | 183.21 | 173.32 | 269.37 | 187.4 |
| NH-DPC | 30.63 | 69.61 | 52.96 | 19.67 | 56.19 | 51.59 | 20.65 | 74.87 | 60.65 |
| FH-DPC | 31.02 | 69.1 | 51.31 | 19.71 | 55.68 | 51.39 | 20.69 | 74.86 | 60.39 |
| Ripples reduction ratio | |||||||||
| NH-DPC contrasted to C-DPC | 86.57% | 70.03% | 72.08% | 88.39% | 76.64% | 71.84% | 88.09% | 72.21% | 67.64% |
| FH-DPC contrasted to C-DPC | 86.40% | 70.25% | 72.95% | 88.37% | 76.85% | 71.95% | 88.06% | 72.21% | 67.77% |
| NF-DPC contrasted to C-DPC | — | 53.63% | 52.71% | 61.01% | 62.17% | — | — | 53.02% | 57.74% |
| FH-DPC contrasted to NF-DPC | — | 23.66% | 27.74% | 30.96% | 19.10% | — | — | 26.57% | 14.81% |
- Abbreviations: C-DPC, conventional direct power control; FH-DPC, fuzzy hysteresis-direct power control; NH-DPC, neural hysteresis-direct power control.
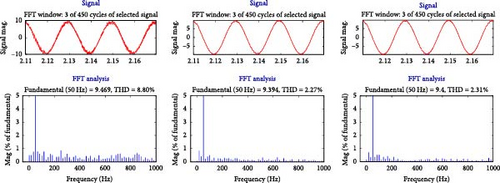
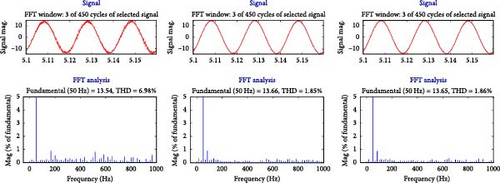
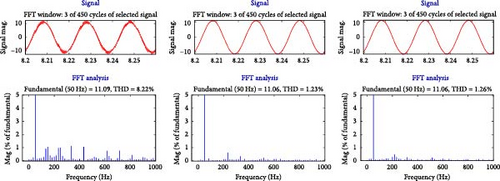
Under C-DPC, NH-DPC, and FH-DPC control approaches, the currents produced by the DFIG system are shown in Figure 26a–c. It is evident from Figure 26b,c that even while switching between operating modes, the system keeps the operating frequency at 50 Hz. In terms of signal quality, the results are highly acceptable: the suggested NH-DPC and FH-DPC approaches greatly enhance the quality of the generated current signals in comparison to C-DPC. Given that the DFIG stator is straight linked to the AC grid, it is imperative to provide high-quality produced current signals. Consequently, this study analyzed the harmonic content of the current produced by phase (A) across every DFIG operating mode via FFT analysis.


The spectra obtained are presented in Figure 27a–c, which indicates that the proposed control methods substantially reduce total harmonic distortions (THDs) in every investigated mode. The various methods suggested in this study are contrasted in Table 8, as well as those examined in [22]. Particularly, NH-DPC and FH-DPC exhibited an average THD enhancement of 77% contrasted to C-DPC. Furthermore, both proposed methods exceeded the options listed in [23] by an average of 11%.
| Outcomes | Modes of operation | ||
|---|---|---|---|
| Synchronous | Super | Sub | |
| THD of produced currents | |||
| C-DPC | 8.22 | 6.58 | 8.80 |
| NH-DPC | 1.23 | 1.85 | 2.27 |
| FH-DPC | 1.26 | 1.86 | 2.33 |
| THD reduction ratio | |||
| NH-DPC contrasted to C-DPC | 85.04% | 71.88% | 74.20% |
| FH-DPC contrasted to C-DPC | 84.67% | 71.73% | 73.52% |
| NF-DPC contrasted to C-DPC | 67.11% | 67.32% | 67.53% |
| FH-DPC contrasted to NF-DPC | 20.74% | 6.16% | 8.16% |
- Abbreviations: C-DPC, conventional direct power control; FH-DPC, fuzzy hysteresis-direct power control; NH-DPC, neural hysteresis-direct power control; THD, total harmonic distortion.
Table 9 provides a comparative analysis of the two proposed control methods (NH-DPC and FH-DPC) based on a thorough review of the methodologies discussed in this paper. Upon closely examining the outcomes, it is evident that the FH-DPC method outperforms the NH-DPC method, primarily in terms of design efficiency and reducing the ripples of produced active and compensated local reactive powers. Specifically, FH-DPC improves efficiency by 77.22% compared to the 77.32% improvement of NH-DPC. Although the performance improvement of NH-DPC is slightly lower, its effect on improving THDs is noticeable.
| Outcomes | Average enhancements to C-DPC | Overall enhancement to C-DPC (%) | Execution time | Design efficiency | |||
|---|---|---|---|---|---|---|---|
| Ps ripple (%) | QAC ripple (%) | THDs (%) | Training time | Complexity | |||
| NH-DPC | 74.88 | 77.05 | 77.04 | 76.32 | Fast | 88s | High |
| FH-DPC | 74.84 | 77.20 | 76.64 | 76.22 | Moderately fast | — | Medium |
| Recommended method | Both | FH-DPC | NH-DPC | NH-DPC | Fast | FH-DPC | FH-DPC |
- Abbreviations: C-DPC, conventional direct power control; FH-DPC, fuzzy hysteresis-direct power control; NH-DPC, neural hysteresis-direct power control; THD, total harmonic distortion.
Even with excellent data, training an AI-based DPC approach was difficult. The best network architectures for neural networks (NH-DPC) were found by overcoming computational constraints and using trial-and-error optimization in conjunction with powerful processors (10th gen Intel Core i3 CPUs, 12 GB RAM). The training process for NH-DPC neural networks is more complex due to the need to determine optimal weights and biases, resulting in longer training times (80–140 s). Nevertheless, after training, this network produces extremely effective mathematical models for simulations of the WT-DFIG system, operating with minimal computational cost. In contrast, FH-DPC while less computationally intensive during training than neural networks. The fuzzification and defuzzification processes in FH-DPC introduce additional complexity that may potentially increase computational load compared to traditional DPC methods.
- •
NH-DPC and C-DPC demonstrate fast execution times due to the rapid decision-making capabilities of trained neural networks and simple hysteresis comparators, respectively.
- •
FH-DPC exhibits moderately fast execution speed due to additional computational steps in the fuzzy logic system.
5.2. A Profile of Random Variable Wind Speed
This section goals to evaluate the ability of the proposed control strategies to withstand random and sudden changes in the DFIG system’s manners and to track references. To achieve this, all three operating modes of the DFIG system will be randomly and continuously explored in addition to the overspeed mode. The choice of randomly and suddenly varying the profile behavior of wind velocity, continuously and successively, is intended to replicate a realistic wind system operation. This aspect was not examined in [23].
The mechanical velocity and wind velocity profile for every DFIG operating mode are shown in Figure 28. Wind speed ranging from 4.96–12 m/s is used. It is critical to remember that changes in wind speed have a direct influence on the mechanical velocity required for DFIG’s four operating modes. As represented in Figure 27, the mechanical velocity is set to its maximum by triggering the pitch angle control when the power reaches its maximum value. In this last part, the power extraction maximization is transformed into a limitation of generated power at its nominal value. In the remainder of Figure 28, the DFIG velocity evolution tracks exactly that of the wind velocity profile, where it is denominated as an MPPT zone. In the MPPT zone, the extracted power is maximized, in Zones 1 and 2, where the remaining value of λ on optimum and value of Cp on highest, and β = 0. As shown in Figure 29, the value β rises in the over-speed mode, where the blade pitch angle is regulated, while the values of λ and Cp decrease.

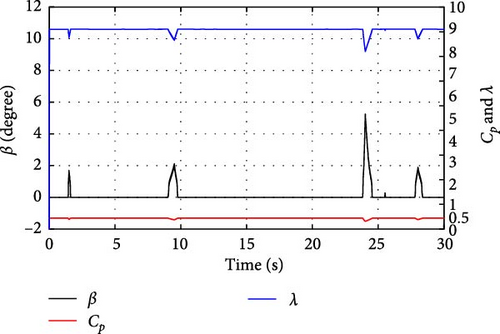
Figure 30 illustrates the generated active power by the WT based on the DFIG system under the C-DPC, NH-DPC, and FH-DPC techniques. The zoomed-in sections in Figure 30 show the fast response of the system and excellent active power reference tracking despite its sudden and random variations. This is accurate for all control approaches proposed in this study. Moreover, the NH-DPC and FH-DPC techniques substantially decrease the generated active power ripples in every operating mode, especially in the over-speed mode. However, in the case of C-DPC, the generated active power ripples are relatively large.

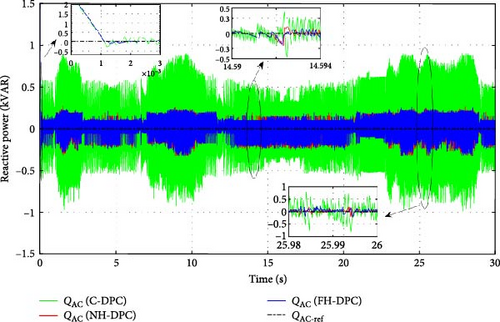
The results depicted in Figure 31 clearly indicate that local reactive power that is compensated by WT-DFIG accurately follows its reference. Therefore, the C-DPC, NH-DPC, and FH-DPC have effectively controlled the QAC power. Moreover, the NH-DPC and FH-DPC strategies have substantially reduced the ripples in the QAC across all operation modes, as compared to the C-DPC technique.
In Figure 32a–d, the generated currents of the WT based on the DFIG employed C-DPC, NH-DPC, and FH-DPC methods are illustrated. Figure 32b–d illustrates that despite the sudden fluctuations and random behavior in wind velocity, the operating frequency remains constant at 50 Hz. The outcomes are remarkable, with the NH-DPC and FH-DPC strategies greatly surpassing the C-DPC and producing substantially improved current signal quality.


To evaluate the performance of the NH-DPC and FH-DPC strategies, a comparison is made with several existing methods in terms of their ability to reduce the THD of the current in a WT-DFIG system. The results are presented in Table 10.
| Technique | THD (%) |
|---|---|
| DPCSVM [34] | 29.82 |
| FCS-MPC [9] | 3.02 |
| 2-SMC [13] | 3.40 |
| NN-DPC [23] | 2.19 |
| NF-DPC [23] | 2.08 |
| ANN-DPC [26] | 2.32 |
| NH-DPC | 1.23 |
| FH-DPC | 1.26 |
- Abbreviations: ANN-DPC, artificial neural network- direct power control; DPCSVM, direct power control space vector modulation; FH-DPC, fuzzy hysteresis-direct power control; NH-DPC, neural hysteresis-direct power control; SMC, sliding mode control; THD, total harmonic distortion.
6. Conclusion
This paper has introduced novel control approaches, NH-DPC and FH-DPC, for the WT-DFIG system utilizing neural networks and fuzzy logic control. These techniques overcome the limitations of the C-DPC method, including ripples in compensated local reactive and generated active powers, robustness, and current signal quality during all modes of WT-DFIG operation. They also compensate for local reactive power in generation, unit power factor operation, or absorption modes. The proposed strategies were compared to NN-DPC and NF-DPC techniques from [22] and were evaluated in simulations of the system. Results show that the proposed techniques successfully reduced both power ripples, improved current signal quality, and lowered THD in all compensation and operation modes. Furthermore, NH-DPC and FH-DPC outperformed the alternative approaches, and NH-DPC slightly surpassing C-DPC, NF-DPC, NN-DPC, and FH-DPC. Overall, the system parameters were significantly improved.
This paper extensively investigates and explores all the benefits of the WT-DFIG, including its ability to be utilized in all compensated local reactive power modes and operating modes, which can be cited as one of its key advantages. The study proposed in this paper simulates the actual behavior of a wind power system with sudden and random variances in wind speed profiles, demonstrating the WT-DFIG’s continuous and successive operation. The use of neural network-based NH-DPC and FH-DPC control strategies presented in this paper exemplifies the potential of AI in the renewable energy field. It is crucial to highlight the significant role that AI improves wind conversion systems’ performance and power quality.
It was acknowledged that while the simulation results for AI-based WT-DFIG control were promising, there were limitations that needed to be addressed. The study focused on ideal conditions, not accounting for extreme events or grid faults. Real-world implementation may face challenges such as sensor inaccuracies and computational delays. Scalability to large wind farms and applicability to other renewable energy systems need further investigation. To address these limitations, Using a large scale WT test-bed, a plan was presented to perform experimental validation, contrast outcomes with simulations, and evaluate robustness under different circumstances. The goal of this strategy is to close the gap between theory and practice, potentially leading to real-world adoption while highlighting AI’s potential in advancing WT-DFIG control despite implementation challenges in resource-constrained environments.
Nomenclature
-
- Pv, Pmec:
-
- Wind kinetic, mechanical power
-
- ν:
-
- Wind velocity
-
- ρ:
-
- Air density
-
- S:
-
- Rotor area
-
- CP:
-
- Power coefficient
-
- R:
-
- Blade radius
-
- λ:
-
- Tip speed ratio
-
- β:
-
- Blade pitch angle
-
- G:
-
- Gearbox gain
-
- Tt, Tmec, Tem:
-
- Turbine, mechanical, electromagnetic torque
-
- Ωt, Ωmec:
-
- Turbine, mechanical speed
-
- J:
-
- Moment of inertia
-
- fvis:
-
- Viscous friction
-
- vsd, vsq:
-
- Stator voltages in the d–q frame
-
- isd, isq:
-
- Stator currents in the d–q frame
-
- vrd, vrq:
-
- Rotor voltages in the d–q frame
-
- ird, irq:
-
- Rotor currents in the d–q frame
-
- ωs, ωr:
-
- Stator and rotor phase electrical variable pulsations
-
- Rs, Rr:
-
- Stator and rotor resistances
-
- Ls, Lr:
-
- Stator and rotor leakage inductances
-
- M:
-
- Stator-rotor mutual inductance
-
- Ps:
-
- Produced active power
-
- QAC:
-
- Compensated lock reactive power
-
- φs:
-
- Stator flux
-
- φr:
-
- Rotor flux
-
- γ:
-
- The angle between the rotor and stator flux
-
- δr:
-
- The angle between the rotor and stator flux in αβ frame
-
- Vs:
-
- Grid voltage
-
- Vn:
-
- Voltage vector
-
- N:
-
- Rotor flux section
-
- x:
-
- Vector input feature
-
- w:
-
- Vector weight
-
- b:
-
- Bias value
-
- H:
-
- Vector output previous layer
-
- y:
-
- Output of the neural network
Acronyms
-
- AC:
-
- Alternating current
-
- ADRC:
-
- Active disturbance rejection active
-
- AI:
-
- Artificial intelligence
-
- BC:
-
- Backstepping control
-
- DFIG:
-
- Doubly fed induction generator
-
- DPC:
-
- Direct power control
-
- DTC:
-
- Direct torque control
-
- FH:
-
- Fuzzy hysteresis
-
- IVC:
-
- Indirect vector control
-
- MPPT:
-
- Maximum power point tracking
-
- MSE:
-
- Mean squared error
-
- NF:
-
- Neural fuzzy
-
- NH:
-
- Neural hysteresis
-
- PI:
-
- Proportional integral
-
- SMC:
-
- Sliding mode control
-
- SVM:
-
- Space vector modulation
-
- THD:
-
- Total harmonic distortions
-
- WT:
-
- Wind turbine.
Conflicts of Interest
The authors declare no conflicts of interest.
Funding
This research received no specific grant from any funding agency in the public, commercial, or not-for-profit sectors.
Open Research
Data Availability Statement
The data used to support the findings of this study are available from the corresponding author upon request.


