Hybrid Renewable Energy and Smart App-Based Management for Efficient and Sustainable EV Charging Infrastructure
Abstract
This paper presents a hybrid renewable energy system integrated with a smart application-based management solution to enhance the efficiency, sustainability, and scalability of electric vehicle (EV) charging stations. The system utilizes photovoltaic (PV) panels, wind turbines (WTs), and battery storage to reduce reliance on grid power and improve energy resilience. A robust energy management system (EMS) employs an adaptive neuro-fuzzy inference system (ANFIS) to optimize PV production under changing conditions, while machine learning algorithms control the dynamic distribution of energy among the grid, storage, and EVs. A smart application leverages IoT, real-time data analytics, and a scheduling algorithm to optimize charging operations across numerous stations. This app-based management optimizes energy use, reduces grid overload, and offers dynamic charging suggestions. Simulation findings in MATLAB/Simulink demonstrate that the proposed system improves power balance, grid stability, and user convenience, while decreasing grid reliance by more than 30%. Furthermore, a blockchain-based payment solution provides secure transactions, lowering station owners’ operating expenses by up to 25%, while saving users as much as 18%. This study provides a comprehensive foundation for future EV charging infrastructure supporting the transition to sustainable electric mobility.
1. Introduction
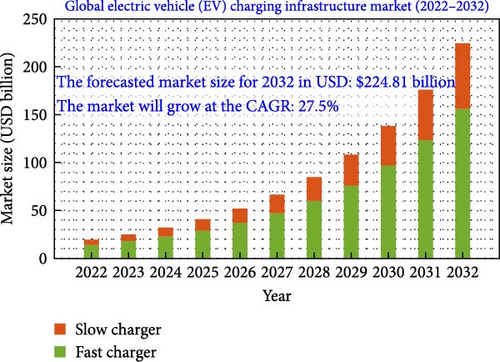
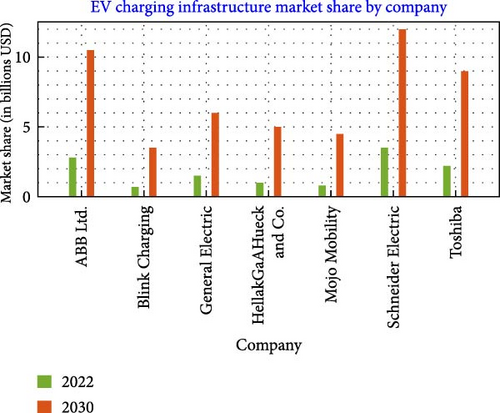
The rapid global shift toward electric mobility is driving unprecedented growth in electric vehicle (EV) adoption, which has consequently led to increased demand for accessible and sustainable EV charging infrastructure. This development is essential not only to support EV proliferation but also to minimize the carbon footprint associated with transportation, aligning with global decarbonization goals. Thus, the investment in charging infrastructure has increased dramatically recently and is expected to increase in the near future, as shown in Figure 1 [2]. Also, the market share for the famous company in billions of USD for 2022 and projected for 2030 is shown in Figure 2. Nevertheless, the widespread deployment of large-scale EV charging stations introduces significant challenges, such as increased pressure on the power grid, reduced energy efficiency, and a heavy reliance on traditional energy sources, which diminishes the environmental advantages associated with EV adoption. In addition, the growing demand for EV charging infrastructure presents both an opportunity and a challenge for sustainable energy management. Addressing these issues through renewable energy sources (RESs) integration and intelligent management systems is critical for achieving a resilient, efficient, and sustainable EV charging ecosystem [4].
Prior research in this area has largely focused on renewable-powered EV charging stations, employing renewable resources and storage to reduce dependency on grid power and improve sustainability. The literature explores various aspects of EV charging infrastructure, emphasizing efficiency, smart integration, and RES. For instance, reviews of charging advancements within smart microgrids [5] highlight RES integration importance in supporting xEV charging and the role of smart grids in enhancing overall system performance. A broad overview of EV technologies conducted by Kumar et al. [6] discussed RES-supported charging technologies, focusing on charging infra, energy organization, and control methods. It highlights the importance of efficient charging solutions and the addition of RES to support EV charging, but lacks data and regional specificity. A study on the hierarchical operation of EV charging stations in grid-integration mode is proposed in [7]. The paper emphasizes the need for coordinated control mechanisms to optimize charging processes and grid stability. A cloud-based system introduced in [8] to improve the EV charging efficiency showed good performance, but lacks scalability and data privacy safeguards. Charge management system that optimizes the operation of charging infrastructures for battery EVs (BEVs) in [9] showed efficiency gains and reduced peak load while improving overall system performance, but requires high computational resources and omits user behavior. Mobile charging solution for EVs in urban areas is examined in [10], focusing on Chattanooga. The study found that mobile stations help reduce charging demand in crowded areas and offer flexible service, but face generalizability and economic viability challenges. A study [11] explored the integration of smart tools and the Internet of Vehicles (IoV) to enhance EV charging systems. It identified emerging trends like vehicle-to-grid (V2G) technology and smart charging solutions that optimize energy use and grid interaction. The findings highlighted that while smart tools and IoV can improve energy efficiency, they lack comprehensive solutions for cybersecurity and interoperability. These limitations emphasize the need for more robust, regionally adaptable, and secure EV charging solutions.
Recent advancements in smart charging have further optimized the deployment and operation of EV infrastructure. For instance, Liu et al. [12] introduced a data-driven model for shared EVs (SEVs), demonstrating that smart charging strategies such as time-of-use (TOU) tariffs and V2G technology can reduce charging costs by 17.93% and 34.97%, respectively. The model also highlights the importance of efficient infrastructure deployment, especially slow chargers at rental stations. Similarly, Das and Kayal [13] focused on a two-stage charging and discharging scheduling strategy that significantly reduces the peak-to-average ratio (PAR) in the power network, enhancing grid stability. These findings underscore the role of intelligent charging management in achieving energy efficiency and minimizing grid stress.
In terms of energy management systems (EMSs), an artificial neural network (ANN)–based EMS for photovoltaic (PV)-powered EV stations is proposed in [14] to optimize energy and enhance reliability. The findings showed increased energy management efficiency, lower operational costs, and successful RES integration, but a lack of responsiveness to ambient PV changes. An active power management system for EVs is proposed in [15] to optimize charging times and reduce peak demand on the grid but is limited in testing across diverse EV types. An enhanced EMS for plug-in hybrid EVs (PHEV) was evaluated to reduce energy waste [16]. The results revealed reduced energy waste and better vehicle performance; however, changing driving patterns and user habits may alter system effectiveness. To reduce peak load, Sathesh et al. [17] introduces an EMS for grid-connected PV-powered EV stations. The findings revealed lower peak demand and improved grid stability, but issues such as energy storage and long-term station viability were not addressed. In [18], a neural network (NN) model for EV stations powered by PV is shown. The findings demonstrate that the model can control charging and forecast PV energy generation, increasing EV dependability. However, it lacks scalability for larger setups and might not take environmental conditions like temperature (Temp) or shading into account. An EMS for PV-battery-ultracapacitor hybrid EVs (HEVs) [19] to boost the efficiency via optimized energy distribution among the different sources but it faces real-time execution challenges. An adaptive neuro-fuzzy inference system (ANFIS) based EMS for PV-battery energy storage system (BESS) EV charging is conducted in [20] to enhance power output but does not evaluate varying load conditions. Similarly, an ANFIS–based EMS for standalone PV-solid oxide fuel cell (SOFC)-battery systems in [21] provided reliable power and offered a consistent and efficient power supply for EV charging, even in off-grid scenarios, but did not address SOFC durability. An EMS for a PV-integrated grid using EVs in [22] is proposed to maximize energy flow efficiency between PV, the grid, and EVs, facilitating V2G interaction, but lacks real-world EV behavior analysis like EV user behavior, load demand variation, or the effect of grid instability.
The studies address various aspects of EV charging, management, and user engagement in smart cities. In this regard, the study introduced in [23] aims to alleviate traffic congestion while optimizing EV charging schedules, thereby promoting sustainable urban mobility. However, the efficacy of the suggested system may be prompted by external factors like public acceptance and economic implications. An intelligent EMS scheme coordinating the control of grid-connected PV systems and EV charging stations was proposed in [24] to reduce peak load demand through the optimization of EV charging plans based on real-time PV energy availability. The study does not account for variations in user behavior or preferences in charging patterns, while the scalability of this scheme in diverse geographical and regulatory contexts is not thoroughly explored. Optimal EV station allocation to minimize costs and maximize RES use is introduced in [25], yet assumptions about user behavior limit real-world applicability. An integrated on-board diagnostics II (OBD-II) system combined with a mobile app designed for monitoring EVs is tested in [26]. The system provides real-time data on vehicle performance, battery status, and diagnostics, improving user engagement and management. Limitations include the OBD-II data scope for EVs and limited real-world testing of the app’s effectiveness. Similarly, the V2Anything app in [27] enhanced communication for traffic and energy efficiency, but raised security and scalability concerns. The comprehensive review conducted in [28] highlighted that while smart EV supply equipment (EVSE) promises interoperability, it lacks empirical validation and assessments of economic feasibility. Savari et al. [29] proposed an IoT system for EV load forecasting and charging station recommendations, improving user experience and resource use. Accuracy may be affected by weather and user behavior and integration with existing infrastructure could be challenging. EV driving behavior mapping in [30] highlighted user experience, but is limited by its qualitative approach.
Although the abovementioned studies have introduced different methods and aspects of EMSs and developed apps for improving the EV charging stations; however, few studies have effectively combined both hybrid RESs with a sophisticated app-based energy management approach to holistically address efficiency, grid stability, and user convenience in EV charging. Thus, this paper addresses this research gap by proposing a novel hybrid renewable energy system integrated with a smart application-based management framework designed specifically for EV charging infrastructure. The system combines PV panels, wind turbines (WTs), and battery storage with an intelligent EMS, which utilizes optimized ANFIS-ANN for precise PV optimization and machine learning algorithms to dynamically manage energy distribution between the grid, storage units, and charging stations. The smart application component leverages IoT, real-time data analytics, and an advanced scheduling algorithm to optimize charging station operations, enhance user experience, and minimize grid impact during high-demand periods. Additionally, a blockchain-based payment and authentication system is incorporated to ensure data security and reduce operational costs for charging station operators. While included for its benefits in secure transactions, a detailed technical analysis of the blockchain implementation itself is outside the primary scope of this study.
The primary objectives of this study were to design a sustainable and hybrid renewable energy-powered EV charging station integrated with an EMS to optimize renewable resource usage and reduce grid dependency. Additionally, the research aimed to develop a smart application for charging schedule optimization, dynamic pricing, and improved user satisfaction, energy efficiency, and cost-effectiveness. A further objective was to implement a NN–based control mechanism for efficient energy distribution between renewable sources, battery storage, the grid, and charging EVs. Finally, the study sought to validate the system’s performance through MATLAB/Simulink simulations, demonstrating improvements in power balance, renewable energy utilization, and operational efficiency.
2. The Proposed EMS
The block diagram in Figure 3 shows an intelligent EMS for an EV station powered by RES, including a PV array, WT, and battery. The PV array connects through a boost regulator controlled by an ANFIS–based MPPT algorithm, ensuring optimal energy extraction. Similarly, the wind system uses a boost regulator with a perturb and observe (P&O) MPPT algorithm to maximize power under varying wind conditions. Both converters feed DC power into a common DC bus.
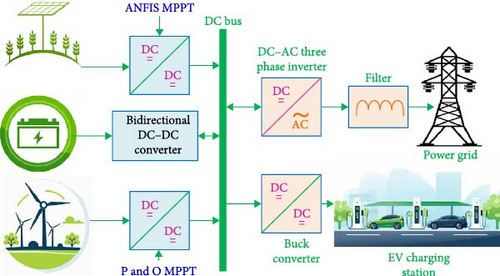
The battery’s bidirectional regulator manages energy flow, allowing it to store surplus energy from the DC bus or supply energy as needed. From the DC bus, energy is routed along two main paths: one path goes to a DC–AC inverter, converting DC power to grid-compliant AC, and the other path supplies the EV charging station via a buck converter, stepping down DC voltage for EV charging. This configuration optimizes energy flow, enhances the use of renewable resources and balances power between the grid and the EV station.
2.1. Type of Charge Used and Number of Cars
Terra 360 by ABB is a high-powered, versatile EV charger designed for commercial and public use, delivering up to 360 kW to fully charge an EV in about 15 min. It supports simultaneous charging for up to four vehicles with multiple ports, offering flexibility and reducing wait times. Compatible with various connectors like those widely used in Europe and North America (CCS) and common in Japan and certain other countries (CHAdeMO), it accommodates diverse EV models. A user-friendly touchscreen interface provides real-time charging info, while its compact design allows flexible installation in limited spaces. The Terra 360 is efficient and sustainable, with features like remote software updates and safety controls for reliable and cost-effective operation. Table 1 shows the charge characteristics and core parameters used for the daily charging capacity of EVs used in this study.
| The parameter | The value |
|---|---|
| Type of charge | Terra 360 ABB |
| Number of port in one machine | 4 |
| Number of machine charging | 8 |
| The charger power | 360 kW |
| Number of total port | 32 ports |
| Time of charging per car | 20 min |
| Total of power | 2880 kW |
| Total car charging | 32 cars |
| Work hours | 15 h |
| Cars/time (1 h) | 60/20 = 3 |
| Total cars/day | 15 × 96 = 1440 |
| Total cars/time (1 h) | 32 × 3 = 96 cars |
This study calculates the daily EV charging capacity, focusing on the number of vehicles, charging machines, outlets, and the required charging time per vehicle. With eight machines, each with multiple outlets, the setup is optimized to reduce downtime and maximize charging efficiency. Based on a 20-min charging duration per vehicle, the calculations estimate the number of cars that can be charged within specified intervals.
2.2. PV and Wind Design
For PV, the system is divided into 86 solar subfields, each containing a specific number of panels arranged in parallel and series configurations to maximize efficiency within the available space. The total generation capacity achieved is 2016 kW, with a 20% margin to ensure continuous performance and meet daily energy demands. The 20% margin ensures reliability by accounting for losses due to shading, dust, aging, and suboptimal conditions [31]. For wind system, to calculate the power generated from wind energy, the number of WTs, individual turbine capacity, and total capacity are considered. Each turbine has a power generation capacity of 42 kW, and with 24 turbines in the system, the combined total power generation is 1008 kW. The design adheres to established methodologies to ensure grid stability [32]. The details of PV and wind system parameters are shown in Table 2. The total energy generated by wind and solar PV is 3024 kW.
| Parameter | Details | Parameter | Details |
|---|---|---|---|
| PV | Wind | ||
| Panel size | 1.18 m2 | Turbine type | Standard efficiency turbine |
| Panel efficiency | 18% | Number of turbine | 24 |
| Panel output power | 213.15 W | Power generation | 42 kW |
| Number of parallel PV modules | 10 | Total power generation | 1008 kW (42 kW × 24) |
| Number of series PV modules | 11 | Size of each turbine | 10 m2 |
| Total PV modules | 110 | Total size of turbines | 240 m2 (10 m2 × 24) |
| Total power generation | 23.446 kW | Size with 20% margin | 288 m2 (240 m2 × 1.20) |
2.3. Conversion Stage
2.4. ANFIS and Control of the MPPT
ANFIS combines NNs and fuzzy logic to learn from data and accurately predict the MPP in various scenarios. The model trains the system to map input–output data pairs. The PV panel’s current and voltage are both taken into account as input variables and power (P = V × I) is computed from them. Like NNs, ANFIS uses forward and backward pass updates to modify membership function variables during training in order to reduce the discrepancy between actual and expected outputs. The trained ANFIS model estimates the optimal duty cycle (D) for the boost regulator, aligning the PV system’s operating point with its MPP. The duty cycle is dynamically adjusted based on continuous monitoring of PV output. The input membership function of ANFIS MPPT is shown in Figure 5.

This process involves generating a fuzzy inference system from input–output pairs, training ANFIS to understand the relationship between PV voltage, current, and the duty cycle, and adjusting the boost converter’s duty cycle to maximize power under varying conditions. This method provides a flexible MPPT solution by effectively managing both external disturbances and the nonlinear features of PV systems. Figure 6 illustrates the relationship between the ANFIS MPPT’s inputs and output membership function.
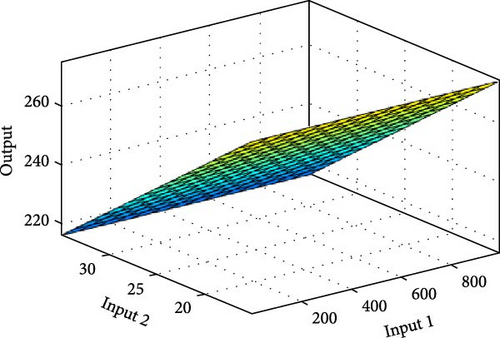
Figure 7 shows a control system for a PV array connected to a boost regulator, designed to maximize output through MPPT. The system begins with an ANFIS MPPT controller, which uses irradiance (Ir) and Temp to generate a reference voltage (Vref) for the optimal operating point. The actual PV voltage (Vpv) is compared to Vref and the error is processed by a PI controller, which produces a control signal. This signal is used by a PWM generator to control the boost regulator’s switching. This process optimizes the energy harvested from the PV system under varying environmental conditions, contributing to the overall energy efficiency of the station.

The boost regulator, consisting of an inductor, switch, diode, and capacitor, increases the PV voltage to match the DC bus. By adjusting the switch duty cycle through the PWM signal, the system optimizes the PV array’s working point to extract MPP under varying conditions. The best possible energy harvesting from the solar panels is ensured by this closed-loop system, which continuously adjusts to variations in Temp and sunlight.
2.5. BESS
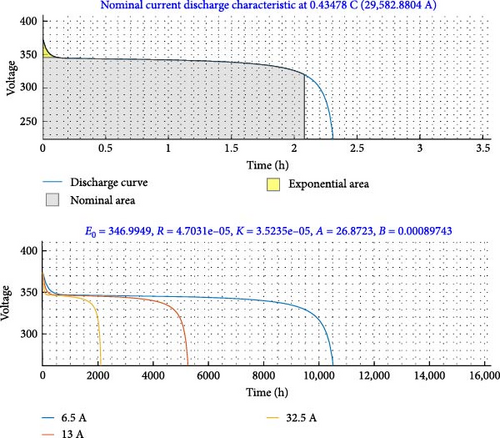
The state of charge (SOC) is a crucial metric representing the battery’s stored power. The supervisory system must detect the SOC to make decisions based on the battery’s condition and power needs. The stored charge over time (t) is Q, where Cbat is the nominal capacity and Ibat is the charging current. In order to ensure that the battery is well-suited for the EMS it supports, the system uses a Li-ion SB with the following important specifications: a nominal voltage of 320 V, which indicates standard operating conditions; a rated capacity of 68.75 Ah, which reflects its energy storage capability; the battery starts with a 90% SOC, which ensures an immediate power supply when needed; a 30-s response time, which allows quick adjustment to changes in power demand or supply, which is crucial for maintaining stability in dynamic systems. The discharge characteristics of the BESS are represented in Figure 8.
2.6. EV Battery Charging Control
The buck converter’s control system for charging an EV battery is depicted in Figure 9. For effective and secure charging, the system controls the current entering the battery. In order to determine the error, it first compares the reference current (Iref) with the actual current (Idcbus) via a summing junction. A PI controller receives this error and uses proportional and integral actions to modify the output in order to reduce the error.

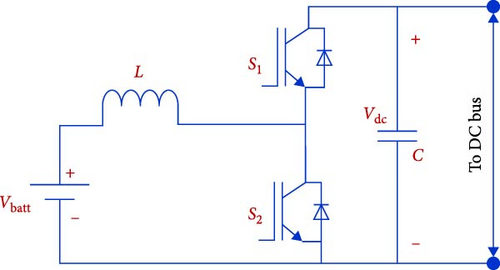
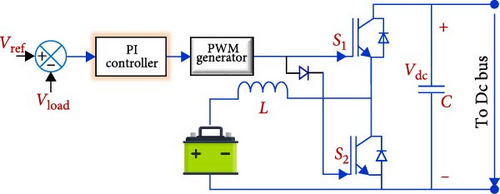
A PWM generator receives the output from the PI controller and transforms it into high-frequency switching pulses at a switching frequency of 10 kHz. By modifying the voltage and current to correspond with the necessary charging profile, these pulses control how the buck converter operates. By avoiding overcharging and regulating the voltage to the proper level, the buck converter maximizes the system’s performance and guarantees safe and effective charging. Figure 10 illustrates a battery control system with a bidirectional regulator to manage power flow between a battery and a DC bus. The system uses two switches (S1 and S2), an inductor (L), and a capacitor (C) to enable bidirectional power flow. It operates in boost mode to charge the battery from the DC bus or in buck mode to discharge the battery to the bus, based on energy needs and the battery’s SOC. A PI controller compares the reference voltage (Vref) with the load voltage (Vload), generating an error signal that adjusts the PWM generator. The PWM pulses control the MOSFET switches, regulating the power flow to maintain the DC bus voltage, ensuring efficient battery charging or discharging.
2.7. NN–Based EMS Using Inverter Control
The grid connected to the inverter is a three-phase system with a voltage of 415 V and a frequency of 50 Hz. Figure 11 illustrates a NN–based EMS designed to optimize power distribution in a hybrid renewable energy setup. In this system, power from both PV panels (Ppv) and WTs (Pw) is combined and fed into a summation block. This combined power is then compared to the SOC of the SB (SOCSB) and the resulting difference is processed by the NN. Based on these inputs and the real-time EV charging demand (), the NN intelligently assesses the energy landscape.

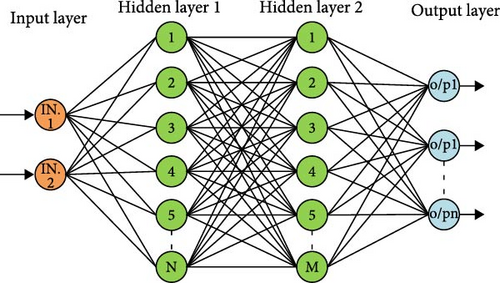
Operating as the core decision-maker for power flow, the NN determines the optimal strategy for distributing the available energy. This strategy is translated into a precise reference current (Iref) signal for the grid-connected inverter. By controlling the inverter based on this Iref, the EMS dynamically manages the energy exchange between the system’s components: it dictates when surplus renewable energy should be directed to charge the SB, when the battery should discharge to support the load or inject power into the grid, when renewable energy should directly supply the EV chargers, and when supplementary power needs to be drawn from or injected into the grid. Optimization and deep learning have become essential for addressing complex challenges and improving efficiency [34]. In this context, an NN is employed to optimize energy utilization by prioritizing the use of clean and renewable energy and stored battery power to meet EV charging demands whenever possible, thereby minimizing grid dependency and reducing operational costs. The NN structure as shown in Figure 12, input layer has two inputs (IN.1 and IN.2), two hidden layers with the sigmoid activation function. The actual input and output data are collected from the best controller training data for the ANN.
3. Smart Charging App
The goal of this project is to create a renewable energy forecast system for EV charging that estimates real-time production from sources like wind and PV cells using weather data and machine learning. It encourages charging during green energy peaks by giving consumers information on RES availability through integration into the app. By allocating charging loads according to renewable estimates, this lowers peak demand and promotes sustainability while stabilizing the grid. With features including interactive maps, real-time station data, and notifications, the app lets users plan sessions according to their preferences, RES availability, and cost. In order to promote green charging and balance the grid load, a dynamic pricing model lowers rates during periods of high availability and modifies costs based on the production of renewable energy. This adaptive pricing, which optimizes energy use for customers and operators, is supported by real-time data integration. Along with monitoring energy efficiency measures, the app evaluates load balancing, peak demand reduction, and renewable energy use. It also assesses cost-effectiveness through savings and dynamic price advantages.
3.1. App Design and Implementation
A platform, tools, and architecture that facilitate the integration of scheduling algorithms, dynamic pricing mechanisms, and predictive modeling must be carefully chosen in order to construct the smart app. React Native is used to create the program for both iOS and Android, enabling a single codebase to expedite development and guarantee consistent functionality. Backend development uses Node.js to effectively handle asynchronous data, while MongoDB stores user preferences, pricing information, and historical energy statistics. The LSTM prediction model is integrated into Python-based API endpoints, allowing for real-time data processing and providing the app with easily navigable forecast data. Multiple layers make up the app architecture, each of which is intended to manage functions including data processing, retrieval, and user presentation. Energy predictions, pricing, and user profiles are safely stored in a centralized database layer that employs encryption and role-based access controls to protect data privacy. RESTful APIs are used by the API layer to facilitate real-time data interchange between the frontend and backend, offering user notifications, pricing updates, and forecasts for renewable energy. The user interface layer includes screens for station location, scheduling, price, availability of renewable energy, and payment methods. It is constructed using modular components for effortless navigation. It is important to note that the application integrates a blockchain-based payment system to ensure secure transactions. However, the specifics of the underlying blockchain technology and its performance metrics are not the focus of this paper.
Quick access to key functions is provided via the user interface’s easy-to-use structure. An overview of available charging stations, their locations, and the amount of renewable energy available are shown on the main screen. Users can arrange charging sessions using a scheduling and pricing interface that displays pricing that has been modified for anticipated renewable energy availability and current grid circumstances. In addition to warnings for renewable energy peaks or charging completion, the insights and notifications area provides information on the best times to charge and possible savings.
3.2. Key Features and Functionalities
By taking user preferences and anticipated renewable energy availability into account, the app’s charge scheduling algorithm optimizes charging times. To create an ideal timetable, a heuristic optimization method, such as particle swarm optimization (PSO), balances factors including price, energy availability, and user-specified criteria. By allowing users to modify parameters such as maximum price thresholds, preferred time windows, or renewable energy priorities, the algorithm can modify schedules to accommodate user preferences while increasing energy efficiency. If energy prices or projections change, the program also adapts in real time, sending users app notifications with the most recent recommendations.
The app’s dynamic pricing encourages users to charge when there is a high supply of renewable energy or when grid demand is low. Users can see cost breakdowns and compare charging rates at various times thanks to real-time pricing that is based on TOU data and energy availability estimates. The app offers incentives or discounts for charging during periods of high renewable energy use, which are marked with a “Green Charging” emblem and associated price changes in an effort to further encourage green charging. The software encourages users to plan charging during periods of strong renewable energy generation by dynamically adjusting prices based on expected supply through the integration of renewable energy predictions. Prediction accuracy, user-focused scheduling, and incentive pricing all work together to enable a more economical and environmentally friendly method of EV charging while also lowering user expenses.
Electrical car chargers vary according to the capacity and speed of charging. Also, the plugs vary based on charging standards. The classifications of the chargers and plugs used are listed in Table 3. Determining the appropriate charger for an EV involves considering the car model, charging system compatibility, and socket type. The application uses the car’s model and year to recommend suitable chargers (Level 1, Level 2, or DC fast charging) and identifies the compatible socket type based on regional standards. Charging time depends on key factors such as battery capacity, charger power, and charging efficiency. Battery capacity, measured in kWh, defines the energy storage potential, while charger power, measured in kW, dictates the energy delivery rate. Efficiency losses, typically 85%–95%, are accounted for in the charging process. The time required for a full charge is estimated using the formula: Time consumed (h) = battery capacity (kWh) / charge capacity (kW). For instance, a 60-kWh battery charged with a 22 kW Level 2 charger would take approximately 2.73 h. Additional factors, such as battery SOC, extreme Temps, and charging rate limits for higher capacities, can also influence the charging duration.
| Types of chargers | Charger/plug | Specifications | Regions/applications |
|---|---|---|---|
| Level 1 | Charger |
|
• Common in residential settings |
| Level 2 | Charger |
|
• Popular for both residential and commercial use |
| DC fast charging | Charger |
|
• Used primarily in public charging stations |
| Type 1 plug (J1772) | Plug | • Standard in North America and Japan | • Used primarily in North America and Japan |
| Type 2 plug | Plug | • Most common European standard | • Widely used across Europe |
| CHAdeMO plug | Plug | • Fast-charging standard developed in Japan | • Primarily in Japan and some other markets |
| Combined charging system | Plug | • Supports both slow and fast charging | • Commonly used in America and Europe |
| Tesla supercharger plug | Plug | • Exclusive to Tesla vehicles | • Used at Tesla charging stations globally |
3.3. Performance Evaluation
- •
Prediction accuracy: The accuracy of the renewable energy forecast model is key. Metrics include: MAE (measures average deviation between actual and predicted renewable generation), RMSE (highlights larger errors to adjust extreme predictions), and MAPE (shows errors as a percentage, ensuring accuracy is comparable across scales).
- •
User satisfaction and engagement: User satisfaction is measured through surveys, ratings, and usage analytics, focusing on: usability and navigation (evaluated through ratings and feedback on the interface’s intuitiveness), feature satisfaction (gauges user interest in features like scheduling and dynamic pricing), and frequency of use (assessed through login frequency, session duration, and feature engagement).
- •
Energy efficiency and environmental impact: The app’s promotion of renewable energy is measured by: renewable energy utilization rate (percentage of sessions aligned with peak renewable availability), grid load reduction (sessions scheduled to avoid peak grid times), and carbon footprint reduction (emissions reduction compared to traditional charging).
- •
Cost savings and economic benefits: Economic impact is assessed by: cost savings per session (compares costs with and without dynamic pricing), monthly/annual savings (tracks cumulative cost reductions), and dynamic pricing influence (measures how pricing information influences user charging habits).
For instance, a 60-kWh battery charged with a 22 kW Level 2 charger would take approximately 2.73 h. Additional factors, such as battery SOC, extreme Temps, and charging rate limits for higher capacities, can also influence the charging duration. To thoroughly assess the effectiveness and impact of the smart charging application, a comprehensive set of metrics was defined across key evaluation areas. Table 4 summarizes these metrics, which cover aspects ranging from prediction accuracy and user engagement to energy efficiency, environmental impact, and economic benefits.
| Evaluation area | Key metrics | Description |
|---|---|---|
| Prediction accuracy | MAE (mean absolute error) | Measures the average magnitude of the errors between predicted and actual values |
| RMSE (root mean square error) | Gives a relatively high weight to large errors; useful for identifying outliers | |
| MAPE (mean absolute percentage error) | Expresses the error as a percentage, providing a scale-independent measure of accuracy | |
| User satisfaction and engagement | Usability and navigation score/rating | Assessed through user feedback and ratings on the ease of use and interface intuitiveness |
| Feature satisfaction score/rating | Gauges user interest and satisfaction with specific app features (e.g., scheduling and dynamic pricing) | |
| Frequency of use and feature engagement | Measured through login frequency, session duration, and interaction with different features | |
| Energy efficiency and environmental impact | Renewable energy utilization rate | Percentage of charging sessions powered by renewable energy or aligned with peak renewable availability |
| Grid load reduction | Quantification of peak demand reduction achieved by shifting charging loads to off-peak or high-renewable periods | |
| Carbon footprint reduction | Estimated reduction in CO2 emissions compared to charging from conventional grid sources | |
| Cost savings and economic benefits | Cost savings per session | Comparison of charging costs with and without utilizing the app’s dynamic pricing and scheduling |
| Monthly/annual user savings | Tracking the cumulative cost reductions experienced by users overtime | |
| Dynamic pricing influence on charging habits | Analyzing how pricing information affects user decisions on when and where to charge | |
3.4. User and Operator Applications
The EV charging application includes two versions tailored for different users: Application A for EV owners and Application B for charging station operators. Application A provides EV owners with an intuitive interface to manage vehicle information, locate and filter nearby charging stations, schedule and reserve charging times, and track energy consumption and costs. Users can also plan trips with charging stops and receive notifications for timely charging. Application B enables station operators to register and manage multiple charging stations, set and monitor charging rates, view energy consumption details, generate performance reports, and remotely manage station functions. Both applications support payment options, safety information, multilingual access, and shared evaluation features, with tools for real-time station performance insights to enhance customer experience and operational efficiency. This dual-application approach aims to streamline EV charging services for users and optimize station management for operators, supporting a robust and user-friendly charging ecosystem.
4. Results and Discussions
To evaluate the output power from the hybrid system for better EMS and for better EV station charging, the simulation of the scheme was conducted in MATLAB/Simulink to estimate the performance under varying weather conditions. There are three cases that were tested in terms of the SB SOC.
4.1. PV and Wind Systems Outputs
From 0 to 0.5 s, the PV system operates at full irradiance (1000 W/m2), generating maximum power. At 0.5 s, irradiance drops to 500 W/m2, simulating partial shading, and is maintained until 1 s. This simulation examines the PV system’s response to sunlight variations and its power stability, as shown in Figure 13. Under 1000 W/m2, the PV voltage is 314.4 V, current 74.34 A, and power output 23.37 kW. When irradiance drops to 500 W/m2, voltage slightly decreases to 308.4 V, current to 37.94 A, and power output to 11.70 kW, illustrating the direct link between solar irradiance and PV power.
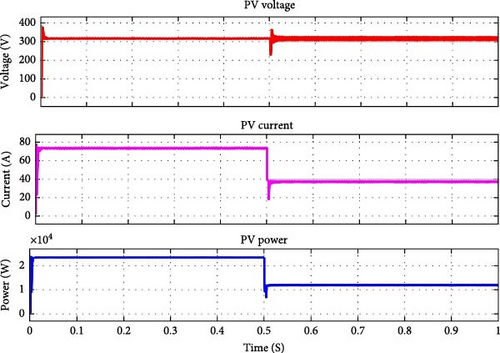
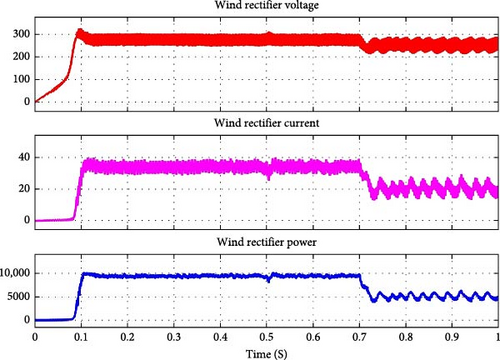
Figure 14 shows the voltage, current, and power characteristics of the wind rectifier. From 0 to 0.7 s, with a wind speed of 12 m/s, the rectifier achieves higher voltage, current, and power, demonstrating efficient energy conversion. At 0.7 s, the wind speed drops to 10 m/s, resulting in reduced voltage, current, and power output, reflecting the WECS’s responsiveness to wind variations. At 12 m/s, the rectifier voltage is 280 V, current 32.55 A, and power 9113 W; at 10 m/s, voltage drops to 273.5 V, current to 21.84 A, and power to 4806 W. This data highlights how wind speed affects the system’s performance and efficiency.
4.2. SB SOC at 90%
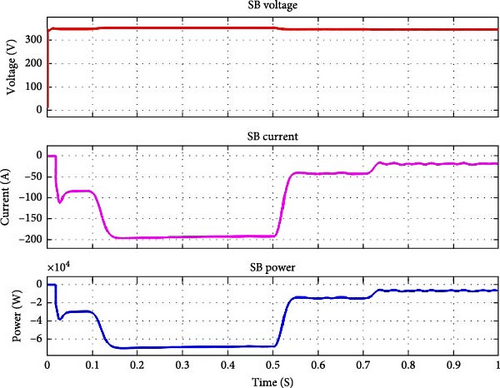
The performance of a SB is analyzed over two intervals: 0–0.5 and 0.5–1 s. During the first interval, the battery voltage is 346.6 V, with a current of 3.027 A, resulting in a power output of 1049 W, indicating that the battery is supplying power. In the second interval, the battery voltage slightly increases to 348 V, but the current becomes negative (−1.716 A), indicating that the battery is now charging and absorbing 5972 W of power. This result highlights the battery’s dual role in both supplying and absorbing power based on the system’s needs. Figure 15 shows the main parameters of the SB in this scenario. Figure 16 displays the EV battery parameters, including voltage, current, and power. Despite fluctuations in input from the PV and wind power sources, the EV battery power remains constant, achieved through effective energy management between the SB and the grid.
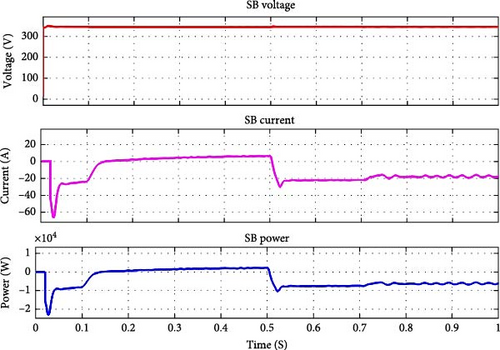
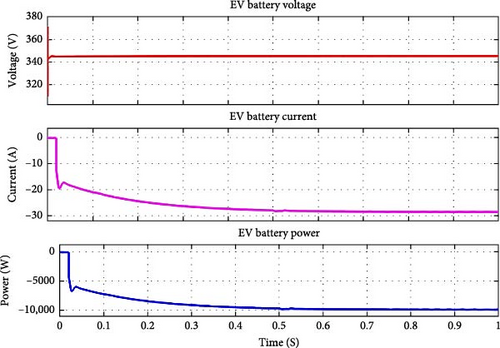
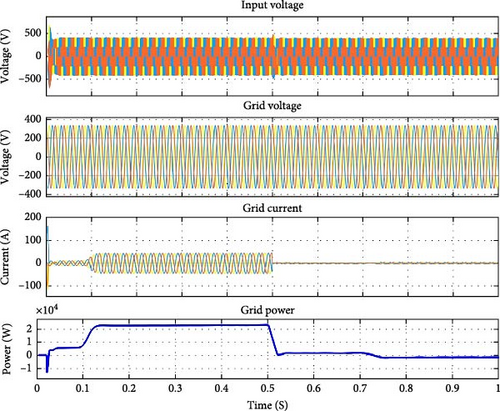
Figure 17 shows the grid parameters during system operation. From 0 to 0.5 s, the grid supplies power directly to the load under optimal conditions, with full irradiance and sufficient wind speed, ensuring stable power to the load. From 0.5 to 0.7 s, PV irradiance drops to 500 W/m2, reducing solar generation. To maintain load supply, the grid draws additional power from the SB. From 0.7 to 1 s, as wind speed decreases to 10 m/s, grid output reduces further, focusing on powering the EV battery. A NN manages this process, ensuring consistent EV battery power despite changing conditions, demonstrating the NN’s effectiveness in stabilizing critical power delivery.
4.3. SB SOC at 50%
In this case, the SOC of the SB is retained at a fixed level of 50%. The output parameters for both the PV and wind systems remain consistent with the values presented in Case 1. Under these conditions, the grid plays a critical role in balancing the power distribution. It adjusts the power flow to ensure that the SB is charged while simultaneously supplying power to the EV battery, as shown in Figure 18.
The grid provides the extra energy needed to charge the SB in order to make up for any power outages, given the fixed SOC of the battery. To maintain the scheme’s overall efficiency, the grid also makes sure that there is enough power available to meet the EV battery’s demands. Figure 19 shows the voltage, current, and power of the SB during this operation, giving a thorough understanding of how the battery functions in these particular circumstances. This configuration emphasizes how crucial the grid is to controlling energy distribution, particularly when the system’s power requirements cannot be entirely met by RESs alone.
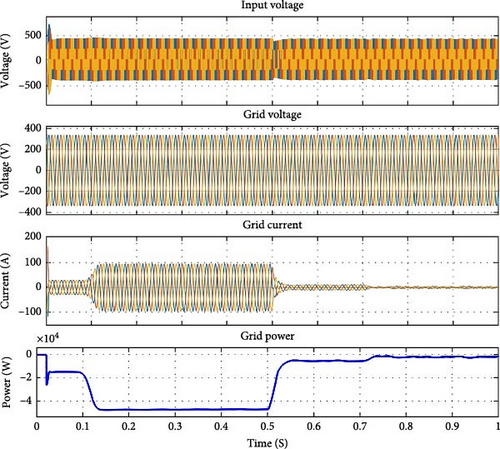
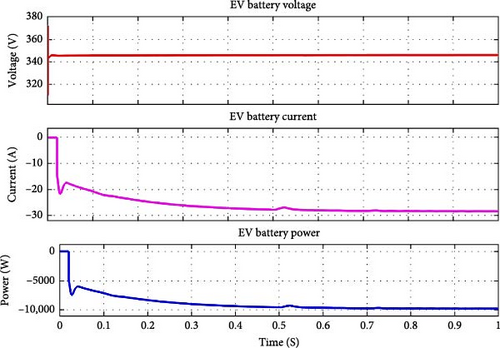
In Case 2, as shown in Figure 19, the grid is crucial to controlling the system’s overall power distribution. The grid is in charge of providing electricity to the EV battery and the SB between 0 and 0.5 s. The grid maintains a steady supply of electricity to the EV battery throughout this time, in addition to charging the SB. This shows that by considering the available power produced by the PV and wind sources, the grid is actively balancing the load requirements. To make up for any deficits from the renewable sources, the grid modifies its output to match the overall load demand. This ensures that, despite variations in renewable energy generation, the SB is charged effectively and the EV battery receives a steady and reliable power source. Figure 20 describes the EV battery’s properties in this case. It is clear from this that the grid keeps the EV battery’s power supply steady during operation. This strategy emphasizes the grid’s crucial role in maintaining system stability, especially in situations where energy demands cannot be entirely met by renewable sources alone.
4.4. SB SOC at 30%
In this case, the SB’s SOC is held at a constant 30%. The values displayed in Case 1 are in line with the PV and wind energy outputs. In light of these circumstances, the grid must modify its power production in order to power the EV battery and guarantee that the SB is charged. The grid must supply extra energy to charge the SB in order to maintain the SOC, which is fixed at 30%. The grid keeps providing electricity to the EV battery at the same time, guaranteeing that the EV’s energy requirements are continuously satisfied. Figure 21 shows the SB’s parameters throughout this procedure. Details on voltage, current, and power flow are included in this figure to give you an idea of how the SB operates in these particular circumstances. The grid’s capacity to effectively distribute and regulate power in this situation emphasizes how important it is to support the SB’s charging, as well as the EV battery’s consistent power supply, guaranteeing the energy system’s overall stability and dependability.

The grid remains crucial in controlling power distribution in Case 3, where the SB’s SOC is set at 30%, thereby verifying the stability and effectiveness of the system. While keeping the SOC at 30%, the grid is in charge of powering the EV battery and charging the SB, as shown in Figure 22.
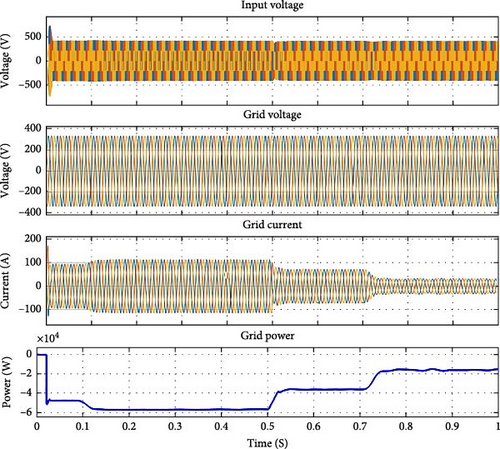
The grid carefully modifies its output between 0 and 0.5 s to satisfy the SB’s energy requirements, charging it to keep the fixed SOC. Regardless of variations in power generation from the PV and wind sources, the grid simultaneously makes sure that the power delivered to the EV battery stays steady and constant. The grid makes up for any deficiencies from renewable sources by actively balancing the load requirements, guaranteeing that the SB is charged effectively without sacrificing the power supply of the EV battery. Figure 23 provides specifics on the EV battery’s properties in this case. This situation emphasizes how important the grid is to the system as a whole. The grid’s capacity to modify its power output guarantees that both the SB and the EV battery receive the required power, even in situations where RES are unable to supply the entire energy demand. This feature is essential for preserving the energy system’s stability and permanence, especially when working with a set SOC for the SB.

4.5. Comparative Analysis of Powers in All Cases
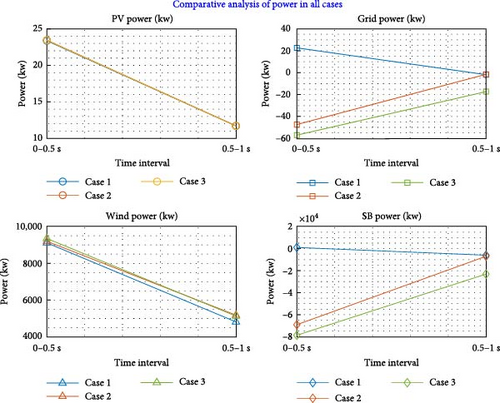
Table 5 provides a comparative analysis of power outputs across three cases, measured at two intervals: 0–0.5 and 0.5–1 s. The data reveals variations in power contributions from PV, grid, wind, and SB sources under different conditions. In Case1, PV power remains steady, decreasing from 23.37 kW in the first interval to 11.70 kW in the second. Grid power starts at 22.66 kW and shifts to −1.84 kW, indicating power absorption during the second interval. Wind power drops from 9113 to 4806 W, while the SB reverses from supplying 1049 W to absorbing −5972 W. In Case 2, PV output mirrors Case 1, starting at 23.46 kW and reducing to 11.72 kW. Grid power shows a large initial absorption (−47.39 kW), which then lessens to −1.51 kW. Wind power slightly increases from 9200 to 5174 W, while SB power shows significant absorption, moving from −69,090 to −6960 W.
| Powers (kW) | Case 1 (SOC 90%) | Case 2 (SOC 50%) | Case 3 (SOC 30%) | |||
|---|---|---|---|---|---|---|
| 0–0.5 s | 0.5–1 s | 0–0.5 s | 0.5–1 s | 0–0.5 s | 0.5–1 s | |
| PV power | 23.37 | 11.70 | 23.46 | 11.72 | 23.44 | 11.69 |
| Grid power | 22.66 | −1.84 | −47.39 | −1.51 | −57.07 | −17.32 |
| Wind power | 9113 | 4806 | 9200 | 5174 | 9353 | 5121 |
| SB power | 1049 | −5972 | −69,090 | −6960 | −78,680 | −23,130 |
In Case 3, PV power follows a similar pattern, starting at 23.44 kW and decreasing to 11.69 kW. Grid power experiences the highest absorption, from −57.07 kW initially to −17.32 kW. Wind power varies between 9353 and 5121 W, with SB consumption reaching its peak, from −78,680 W initially to −23,130 W. Figure 24 shows a visualization of the power in the three cases. Overall, the table highlights distinct trends in power generation and absorption, with significant variations in grid and SB power reflecting changes in load demand and energy distribution strategies.
5. Electrical Vehicle Application User Manual
5.1. Client Application
This app is divided into four main pages called Home, Main, Map, and my account, described as below:
5.1.1. Login Page
The login page provides options for both logging in and signing up for new users. The sign-up process requires a user to enter a username, password, and phone number, with a mandatory acceptance of the Terms and Policy of Use. Returning users can log in quickly by entering their phone number and password. The login page appears as shown in Figure 25.
5.1.2. Home Page
The home page displays nearby charging stations with their ratings, allowing users to search for specific stations. When selecting “Book Now” on a station, users see detailed information, including a station photo, name, cost, address, and available plug types with images. Users can choose which car to charge if they have multiple vehicles registered, specify the desired charging time and duration and proceed to book the station directly from this page. The login page appears as shown in Figure 26.

5.1.3. My Account Page
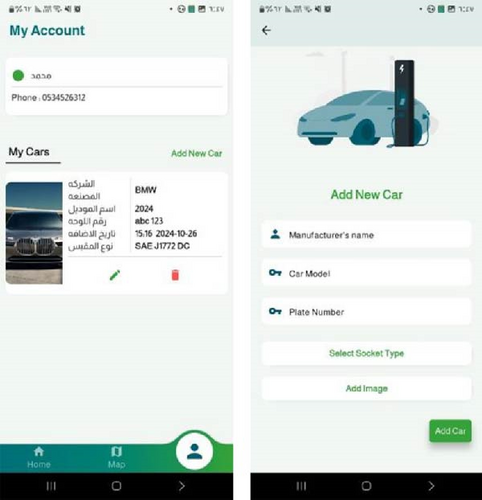
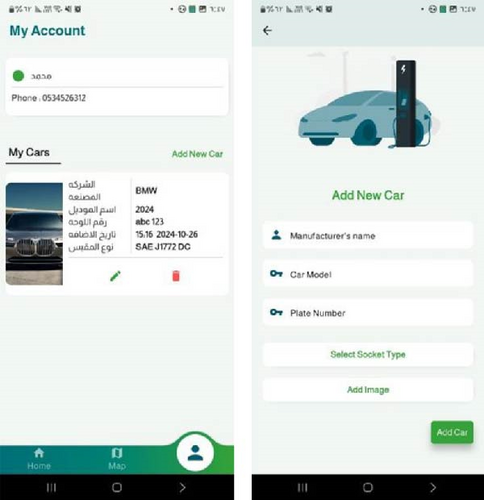
The “My Account” page displays personal details such as your name, phone number, and registered cars. Users can add cars by entering information such as the car manufacturer’s name, model, plate number, socket type, and uploading a car image. Multiple cars can be added and users have the option to edit or delete car details from their account as needed. The map page appears as shown in Figure 27.
5.1.4. Map Page
The map page displays a Google Map with icons marking all charging stations in the selected area. When a station is clicked, a small window appears at the bottom of the screen, showing the station’s name and photo. Clicking on this window directs the user to the “Book Now” page. Users can also filter stations by plug type, displaying only those stations with the preferred plug. The map page appears as shown in Figure 28.

5.2. Company Application-Charging Station Owners
The app is divided into four main pages called home, branch, reservations, and statistics, described below:
5.2.1. Login Page
The login page provides options for both logging in and signing up for new users. The sign-up process requires a user to enter a username, password, and phone number, with a mandatory acceptance of the Terms and Policy of Use. Returning users can log in quickly by entering their phone number and password. The login page appears as shown in Figure 29.

5.2.2. Branch Page
The “Branch” page allows users to add company details and stations. Users can add a company by providing information such as the company name, phone number, email, commercial registration number, tax number, and a photo. Additionally, there are options to edit or delete the company. Once a company is added, users can manage the station by selecting options to add a branch, edit existing details, or delete a branch. When adding a branch, users must provide details including the branch name, phone number, and area. The branch page appears as shown in Figure 30.

5.2.3. Reservations and Statistics Page
The “Reservations” page displays all reservation orders with detailed information provided by the client, including reservation time (order and charging time), car details (company, model, and plate number), and client information (name and phone number). The “Statistics” page shows comprehensive statistics for the company, branch, and stations, including income and power consumption data for each station. The reservation page appears as shown in Figure 31.

6. Conclusion
This study proposes an advanced framework for EV charging infrastructure, integrating hybrid RESs (solar and wind) with an intelligent EMS, and a sophisticated smart application. The system leverages renewable energy to minimize grid dependency, optimize energy efficiency, and enhance sustainability. Key technical innovations include an ANFIS for renewable energy optimization, NN–based EMS for dynamic power distribution, and a robust mobile application designed to streamline user and operator experiences. One essential element of this framework is the smart application. Features like dynamic pricing that encourages the use of green energy, real-time scheduling depending on the availability of renewable energy, and user-centric tools like plug compatibility screening, station location mapping, and interactive cost tracking dashboards are all included. The software, which was developed with machine learning algorithms for renewable energy projection, lowers operating expenses while enabling users to make charging decisions that are environmentally friendly. To guarantee efficiency and transparency, it provides energy analytics, blockchain-secured payment methods, and station management tools to operators.
Simulation results demonstrate that this integrated system achieves a reduction in grid dependency by over 30% and improves energy utilization, while the app ensures seamless interaction and optimal charging experiences. In addition to addressing the difficulties in expanding EV infrastructure, this technology and user involvement combination promotes the global shift to sustainable electric mobility. In addition to meeting the increasing need for effective EV charging options, this work lays the groundwork for future developments in the integration of smart grid technology and renewable energy. Scalability in various geographical and legislative contexts, the long-term effects of oscillations in renewable energy and improved cybersecurity measures for intelligent applications should all be investigated further. This paradigm aids in the global shift to sustainable electric mobility by bridging the gap between sustainability and operational efficiency.
Future research should focus on validating the system’s scalability and adaptability through simulations and pilot deployments involving larger networks of charging stations. It is particularly important to investigate the system’s performance across various geographical locations with diverse renewable energy potential (including regions with low wind or solar resources) and under different regulatory and market frameworks. Additionally, further work is needed to analyze the long-term effects of oscillations in renewable energy generation and to develop enhanced cybersecurity measures for the intelligent application and overall system. Future research could also involve a more in-depth investigation of the blockchain-based payment system, including an analysis of different consensus mechanisms, transaction latency, scalability, and a detailed cost-effectiveness study of its implementation.
Conflicts of Interest
The authors declare no conflicts of interest.
Funding
No funding was received for this manuscript.
Open Research
Data Availability Statement
The data that support the findings of this study are available from the corresponding author upon reasonable request.


