Enhanced Electrical Characterization of Dusty Solar Modules: Integrating Outdoor Experiments With Single- and Double-Diode Models
Abstract
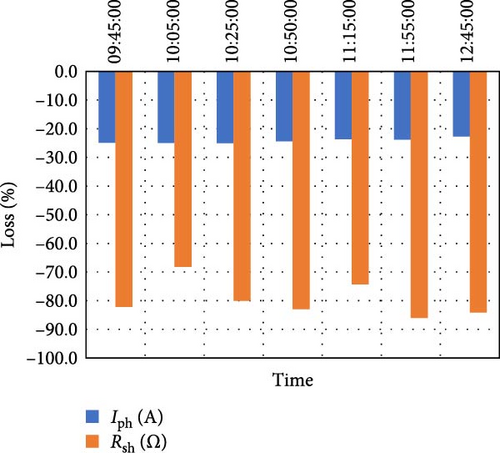
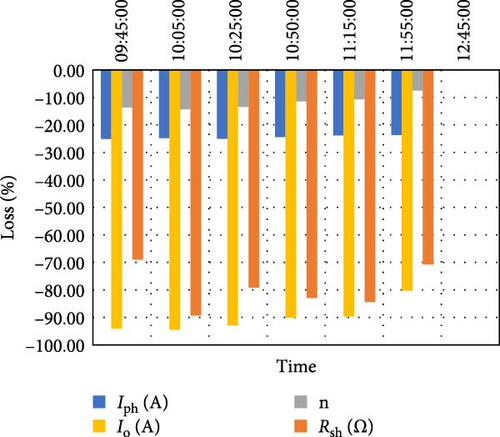
This study addresses a research gap regarding the impact of dust accumulation on photovoltaic (PV) modules, with a specific focus on parameter extraction using single- and double-diode models (SDMs and DDMs) under dusty conditions. While dust effects on PV performance are well-studied, few have explored how existing models can accurately represent these effects. Experimental data from outdoor testing of small-scale modules subjected to artificially deposited dust were analyzed. The direct current parameters were then extracted using the SDM and DDM, with the application of the improved snake optimization algorithm to enhance the accuracy. Preliminary analysis shows that the fill factor of dusty panels gradually increases, surpassing that of clean panels, due to increased absorption of diffuse light from reflections off the nonuniform dust layer. Efficiency uniformly decreases under dust presence. Computational comparison reveals a significant impact of dust on the algorithm’s prediction quality, with maximum root mean square error decreases of 339.1% and 303.5% for DDM and SDM, respectively. The study observes that DDM effectively represents dust effects with fewer parameters than SDM, which includes more parameters conveying dust deposition effects. On average, DDM photocurrent values decrease by 24.2% due to dust, while shunt resistance decreases by 79.7%. For SDM, photocurrent decreases by 24.2%, shunt resistance by 80.1%, diode saturation current by 84.6%, and ideality factor by 10.5%. These findings suggest that current models inadequately represent dust effects, favoring SDM for its simplicity, while partial shading serves as a weak approximation.
1. Introduction
The contemporary world is combating climate change by utilizing renewable technologies to meet energy needs while prioritizing resource sustainability [1]. Solar photovoltaic (PV) technology stands out among renewable energy sources as a promising and mature power generation method, with 75% of global renewable energy capacity additions in 2023 attributed to PV [2]. In 2022 alone, solar PV generated a record 1300 TWh of electricity, a statistic obtained from the International Energy Agency (IEA) [2]. What can disturb the productivity of these PV systems, among many, is the negative impacts caused by environmental factors like temperature, humidity, and dust deposition [3]. This research focuses on the dust-related deterioration of PV performance. As well-defined, dust consists of solid particles less than 500 µm in diameter [4]. The accumulation of dust obstructs sunlight from reaching the PV panel surface [5], leading to losses in transmittance [6], conversion efficiency, and output power [7].
Numerous studies have comprehensively monitored, quantified, and documented the unmistakable effect of these micro grains on the generated power or the different solar panel characteristics. For instance, in work conducted by Younis et al. [8], losses in short-circuit current (Isc) reached 38.14% under extreme artificially deposited dust scenarios during outdoor testing in Romania. Similarly, Majeed et al. [9] deployed mono and polycrystalline silicon PV modules in Pakistan and observed losses in output power of 16.16% and 11.54%, respectively, after 1 month of outdoor exposure. Dida et al. [10] tested crystalline silicon PV modules for 8 weeks in the Saharan environment of Algeria to obtain a 6.1% drop in the Isc. From a different perspective, Dhaouadi et al. [11] deployed glass slides next to PV panels for 18 weeks in the desert environment of the United Arab Emirates to reveal a 30% drop in the transmittance depending on the ultraviolet spectroscopy technique. Salameh et al. [12] published a comprehensive review that summarizes the studies concerned with the effects of dust deposition on the performance of the PV panels, categorized by climatic region.
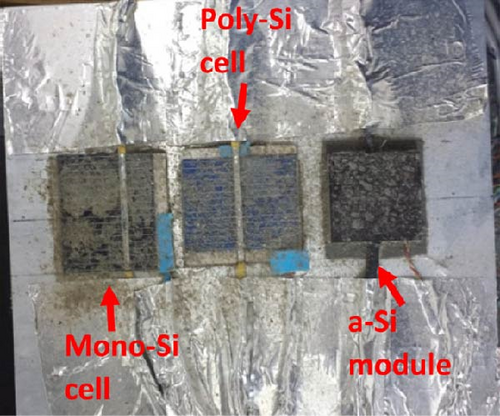
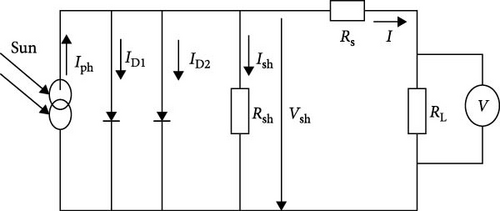
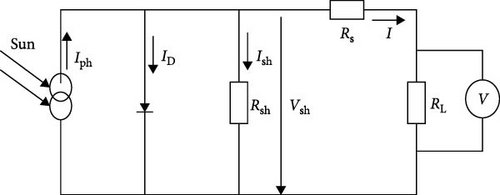
Modeling the physical behavior of solar cells in response to sunlight has garnered significant attention, with numerous successful attempts documented in the literature. These include empirical models [13], analytical models [14], and the widely utilized equivalent circuit models [15]. Notably, the literature is predominantly characterized by the use of single- and double-diode models (SDM and DDM), with over 60% of studies employing these implicit equations to mathematically represent the photoelectric phenomenon within individual solar cells [16]. The presence of dust on the solar cell surface can induce a partial shading effect due to variations in dust amounts randomly scattered on the PV surface [17], as shown in Figure 1 [8]. When considering the physics involved in partial shading scenarios, the DDM offers a more accurate representation of solar cell behavior. This is because the DDM incorporates recombination losses within the depletion region, thereby improving the model’s precision [18] and its ability to predict performance under low insolation conditions [19]. Figure 2 illustrates the equivalent electric circuits of the SDM and DDM [20]. Ishaque, Salam and, Taheri [21] indirectly verified the effectiveness of the DDM to model the partial shading effects based on MATLAB simulations. However, there is a limited number of studies exploring the relationship between partial shading, dust accumulation, and the DDM. One such study is the work of Gholami et al. [22] where they developed an analytical and numerical approach to extract DDM parameters under dust cover. Their research revealed a 30% reduction in prediction error when utilizing this new method in conjunction with the DDM, compared to using the same method with the SDM. Importantly, experimental measurements served as the benchmark for comparing the performance of both models [22].
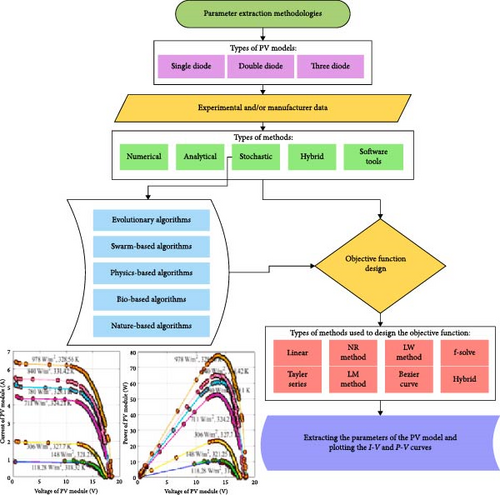
On the solution front, a plethora of methods are available to determine the parameters of the SDM and DDM precisely [23]. This includes the rapid advancements in artificial intelligence techniques, particularly focusing on optimization algorithms [24]. This is crucial as these models, particularly the DDM are recognized for their computational intensity and complexity in parameter extraction [25]. Among the algorithms, the swarm-intelligence metaheuristic algorithms are widely used [16]. In recent years, there has been a surge in the development and application of various algorithms in conjunction with the equivalent circuit models. These include the Salp Swarm algorithm [26], Barnacles mating algorithm [27], Wild Horse optimization algorithm [28], Harris Hawk optimization algorithm [29], Ant Loin optimization algorithm [30], Gorrila Troops optimization algorithm [31], Particle Swarm optimization algorithm [32], and numerous others. Figure 3 provides a comprehensive overview and summary of the parameter identification process, mainly focusing on stochastic optimization algorithms [33].
Special attention was given to correlating the various effects of dust deposition on solar cells with factors such as dust amount, density, or coverage area. The resulting models were categorized into linear, exponential, numerical simulations, optical, and other classifications [34]. However, few studies have focused on characterizing these effects based on the fundamental equation or equivalent circuit models. Significantly, Gholami et al. [35] adopted a similar methodology, utilizing a noniterative approach to enhance the accuracy of parameter extraction in their modified SDM while also accounting for the impact of dust deposition. This led to direct current (DC) parameters with an average improvement in accuracy ranging from 25% to 35% compared to bulk experimental results [35].
The research methodology employed in this study is based on experimental data gathered from outdoor testing of two identical PV panels subjected to dust accumulation, ranging from completely clean to heavily dusty conditions. These data were collected on a day when the PV test bed was positioned horizontally. The electrical characterization of the PV modules under investigation was accomplished by extracting the parameters of the SDM and DDM using the Improved Snake Optimization Algorithm (ISOA). This experimental–computational process involved analyzing the variation in current and voltage readings over time, as well as irradiance levels throughout the testing day. Consequently, the results obtained will reflect the impact of dust on the DC parameters under a range of environmental conditions, including irradiance levels and ambient temperature.
This study aims to assess the accuracy of SDM and DDM in representing solar cells under dust coverage. The novelty of this work lies in applying an optimization algorithm for parameter extraction, which improves predictions under dusty conditions and evaluates the quality of the models. This research is among the few to characterize PV panel performance under dust using parameters from SDM and DDM, with ISOA, a robust swarm intelligence algorithm, further enhancing the accuracy of these predictions. ISOA has demonstrated its efficacy in accurately predicting targeted electrical characteristics or parameters [20]. By incorporating outdoor experimental data, this study provides a reliable solution for modeling the effects of dust on PV performance, significantly advancing the understanding and prediction of PV behavior in dusty environments.
Therefore, the rest of this article is organized as follows: Section 2 presents the experimental method, Section 3 presents the ISOA algorithm, Section 4 delivers the test results and discusses them, and Section 5 concludes.
2. Experimental Method
The study aimed to assess how dust accumulation affects the efficiency of solar panels deployed in urban environments, using naturally occurring dust collected from the local environment in Brasov, Romania. The buildup of dust on the surfaces of solar PV panels can occur in varying degrees under outdoor conditions, influenced by an array of factors including site-specific characteristics, dust composition, wind dynamics, ambient temperature, humidity levels, tilt angle, and the material properties of the surface itself [36]. However, consensus within the scientific community regarding the uniformity or randomness of dust dispersion remains elusive, mirroring the unpredictable nature of environmental phenomena.
Field experiments were executed atop a building situated in the Colina campus of Transilvania University, Brasov, Romania, utilizing data collected on September 27, 2023. The annual cumulative global irradiation incident upon an optimally inclined surface in Brasov is documented to reach 1400 kWh/m2 [37].
For this investigation, three symmetric commercial polycrystalline PV modules, each comprising 18 cells and measuring 18.4 cm × 15.7 cm (~16.048 cm2 per cell), were affixed to a custom testbed. The primary focus lies in comparing the performance of a pristine module (P1) against that of a heavily dust-laden module (P3), as illustrated in Figure 4. Natural dust collected from the surroundings in Brașov, Romania, was applied to the solar panels to assess the impact of dust deposition on their performance. The dust was manually spread using a sieve over the surfaces of the examined panels. This process of artificial dust accumulation was maintained throughout the testing period.
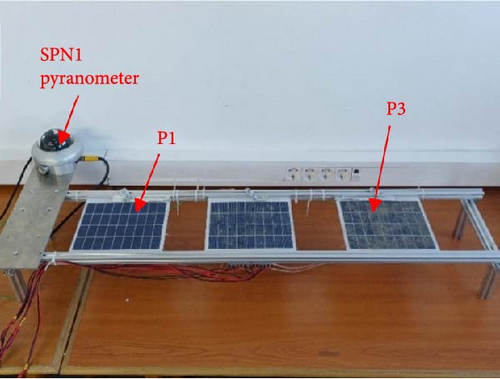

The testbed included a DELTA-T SPN1 Sunshine pyranometer, known for its precision with an accuracy of ±5% (or ±10 W m⁻2) [38], used to measure sunlight intensity. Positioned horizontally, the testbed was placed atop a layer of black tar paper, serving as the roofing material beneath it.
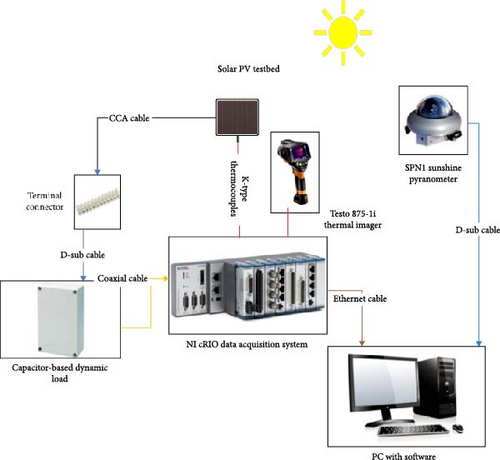
For data collection, an acquisition and control system was utilized, employing the National Instruments (NI) cRIO 9074 8-slot embedded controller [39] along with an electronic circuit based on the capacitor technique. This setup allowed for the recording of I–V characteristics, as well as ambient, back and front surface temperatures. Each set of readings was obtained over ~3.2 min, comprising eight data points with a 24-s interval. The NI modules integrated into the controller chassis are presented in Table 1.
| Module | Description |
|---|---|
| NI- cRIO-9074 | Embedded controller |
| NI-9211 | Temperature input modules |
| NI-9213 | |
| NI-9215 | Voltage input module |
| NI-9227 | Current input module |
| NI-9401 | Digital input/output (DIO) module |
Additionally, a capacitor-based dynamic load was linked to the controller to aid in acquiring the I–V data. The parameters were measured during the charging process of the capacitor directly connected to the PV modules using current and voltage sensors [40]. An image diagram depicting the complete experimental setup is provided in Figure 5 [8].
3. Improved Snake Optimization Algorithm
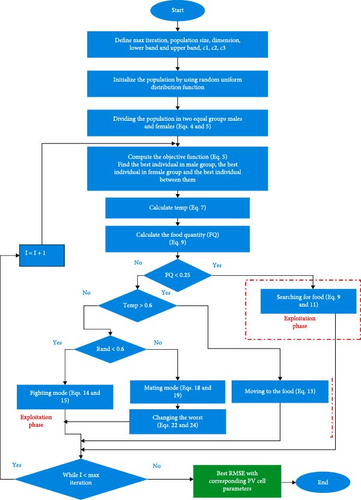
The study utilized the ISOA, chosen for its ability to reduce computational time by conducting fewer iterations and employing a smaller population size, all while maintaining high accuracy [20]. Figure 6 displays the flowchart of this enhanced algorithm, adapted from the original flow diagram by Belabbes et al. [20].
- 1.
Fighting mode: Male snakes compete to mate with the most suitable female, while females aim to select the best mate.
- 2.
Mating mode: If mating occurs within the search space, females may lay eggs, resulting in the birth of new snakes.
- 3.
Feeding mode: In situations where ambient temperatures are high, snakes consume available food.
In the exploration phase, snakes focus solely on searching for food when its availability is not guaranteed [20, 41].
The parameter settings utilized in this study by the ISOA are presented in Table 2. Notably, these settings apply to the entire PV module, which consists of 18 cells, as shown in the figure above, explaining the unusually high values assigned to the ideality factors. In the DDM, only five of the seven parameters—Iph, Io1, Io2, Rs, and Rsh—have direct physical meanings and can be linked to measurable properties of the solar cell. The remaining two parameters, the ideality factors (n1 and n2), are mathematical constructs that improve the model’s flexibility and accuracy but do not correspond to physical processes [42]. These factors help capture nonideal behaviors, such as recombination, material defects, partial shading, or dust deposition, improving the model fit for complex or imperfect cells. Their role is to refine accuracy rather than provide physical insights; therefore, they can take values within the mentioned ranges, but in the comparison, no conclusions are drawn based on them. The other ranges shown in the table are extracted from data collected from the clean PV module and adjusted to align with values commonly reported in the literature [43, 44]. The number of iterations and population size are standardized or fixed for both models, implying that less emphasis is placed on the accuracy of the prediction or the RMSE value, facilitating comparison between the results of the two models. However, until prioritizing accuracy is undertaken, it is premature to claim that solely standard criteria will yield meaningful results.
| Panel | P1 | P3 |
|---|---|---|
| Iph_range [A] | 0–0.5 | 0–0.5 |
| Io_range [A] | 10e–12 to 10e–4 | 10e–12 to 10e–4 |
| Io1_range [A] | 10e–12 to 10e–4 | 10e–12 to 10e–4 |
| Io2_range [A] | 10e–12 to 10e–4 | 10e–12 to 10e–4 |
| n_range | 18–36 | 18–36 |
| n1_range | 18–36 | 18–36 |
| n2_range | 18–36 | 18–36 |
| Rsh_range [Ω] | 0–0.5 | 0–0.5 |
| Rs_range [Ω] | 0–10,000 | 0–10,000 |
| Iterations | 100 | 100 |
| Population size | 1500 | 1500 |
- Abbreviations: ISOA, improved snake optimization algorithm; PV, photovoltaic.
4. Results and Discussion
4.1. Data Validation
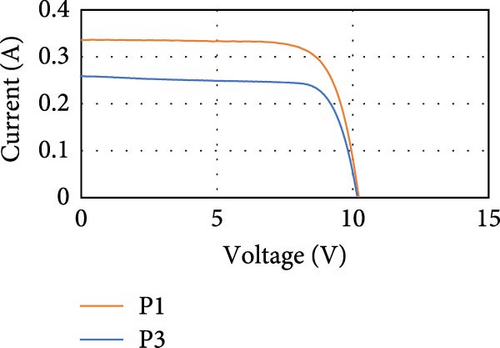
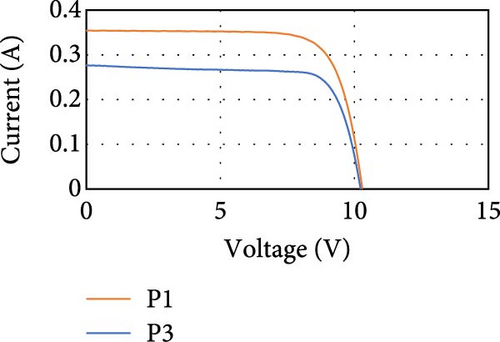
During the experiments, September 26, 2023 was designated as the reference day, during which all solar panels were clean, and the testbed was positioned horizontally, as shown in Figure 6. These panels were denoted as follows: P1 for the clean panel and P3 for the heavily dusted panel. This naming convention corresponds to the degree of dust accumulation on each panel’s surface. Notably, the level of dust accumulation remained relatively stable on P3. In theory, the electrical performances of the two PV modules on this day should be the same, the thing that is indicated by the nearly identical I–V curves displayed in Figure 7.

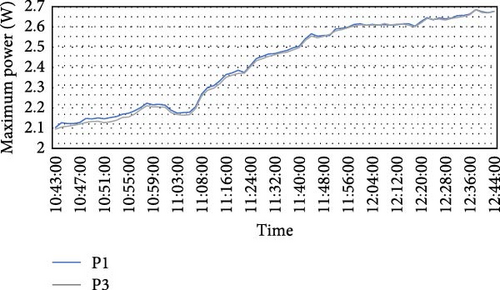
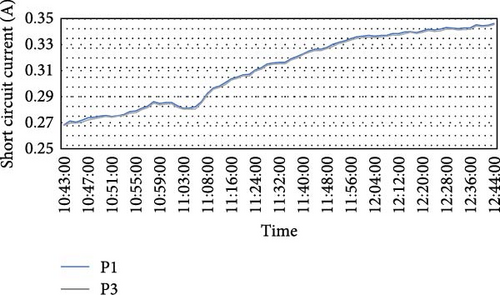
Furthermore, the time series curves for maximum power (Pmax) in Figure 8 show a high degree of similarity, with an average discrepancy of 0.37% in Pmax values between the panels. The highest and lowest global values were 2.69 W and 2.1 W, respectively. Regarding the short-circuit current (Isc), Figure 9 illustrates three similar time series charts, indicating the cleanliness of the solar panels, as Isc is primarily affected by dust soiling [45]. In this scenario, an average discrepancy of 0.43% was observed between the PV panels, with global maximum and minimum values of 0.35 A and 0.27 A, respectively.
Based on the reference day data, it can be concluded that the two commercial PV panels exhibit similar electrical characteristics. Therefore, the subsequent experimental results obtained under the horizontal configuration are reasonably valid for comparing scenarios with and without dust, quantifying the relevant effects, conducting the computational analysis, and drawing conclusions and recommendations.
4.2. Experimental Results
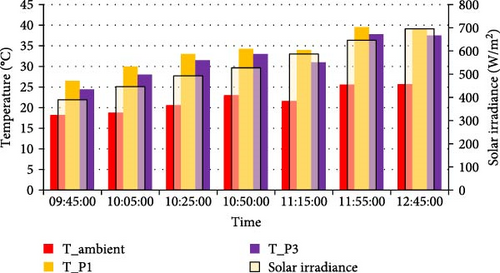
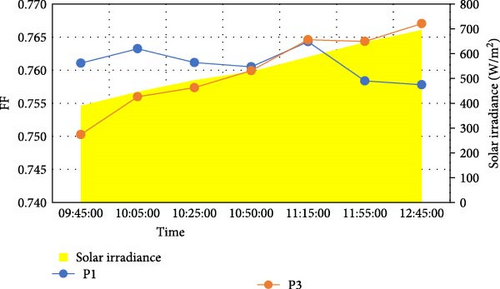
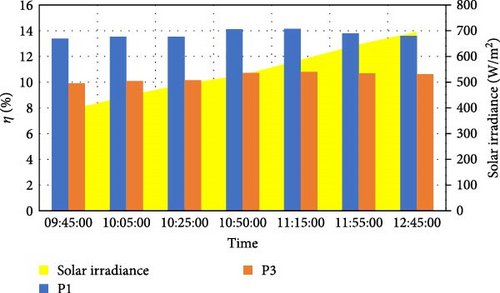
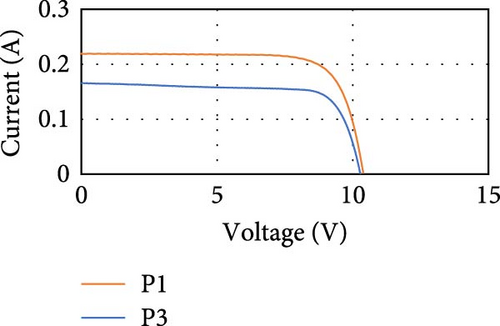
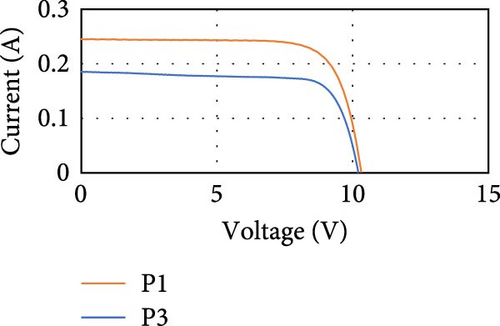
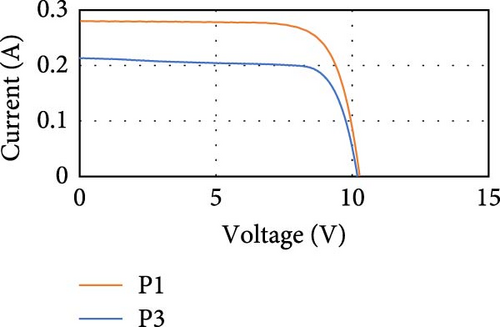
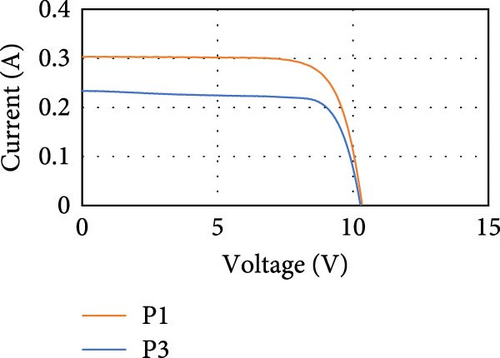
On September 27, 2023, the testbed was positioned horizontally and exposed to sunlight from 9:45 AM to 12:45 PM, totaling 3 h of exposure. Figure 10 summarizes the environmental conditions for that day, including the panels’ backside temperatures. The solar irradiance, ambient temperature, and module temperatures recorded for the different PV panels during the experiment day are outlined in Table S1, available in Appendix A. During this period, the clean module P1 generated 252.34 Wh of electricity, whereas the dusty P3 produced 193.31 Wh. This represents a reduction of 23.39% in energy output attributed to the presence of dust, a well-documented phenomenon affecting PV performance [46]. Based on the findings of El-Shobokshy and Hussein [47], the observed behavior of the fill factor (FF) (see Equation (4) [48]) in this study, displayed in Figure 11, can be interpreted as follows: Dust accumulation on panel P3 creates scattered islands on its surface, as depicted in Figure 4. However, the voids between these islands accumulate some particulates or thinner dust layers, effectively enhancing the uniformity of light striking the panel surface and thereby improving the diffuse component of light. This phenomenon leads to an increase in the FF. Moreover, under the conditions of this study, solar irradiance increases throughout the day, resulting in higher levels of diffuse radiation and more light reaching the panel. Consequently, the FF also increases, potentially surpassing the factor for a clean panel. This deviation from the typical behavior, where the FF decreases with increasing solar irradiance [49], suggests that the dust-induced changes in light distribution and intensity play a significant role in enhancing the performance of panel P3. When evaluating the efficiency of panels under dust cover (see Equation (5) [50]), it is notable that Figure 12 illustrates the common trend seen in solar panels affected by dust accumulation: a decrease in efficiency despite the concurrent rise in solar irradiance over the course of the day [50].

4.3. Computational Results
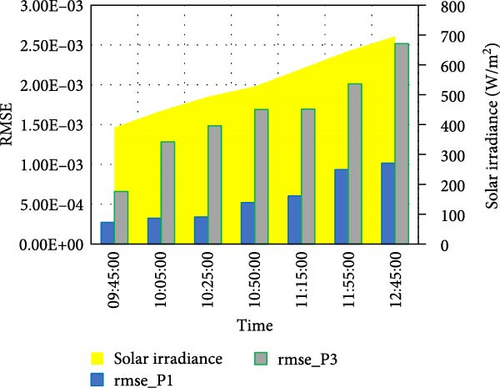
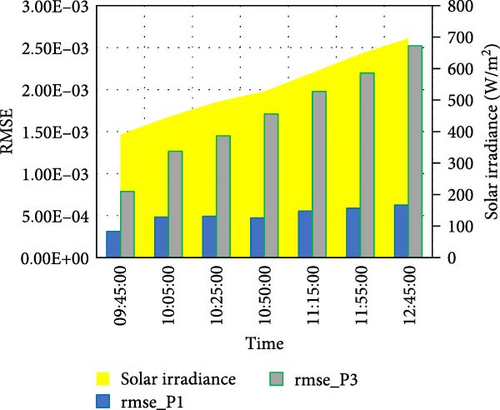
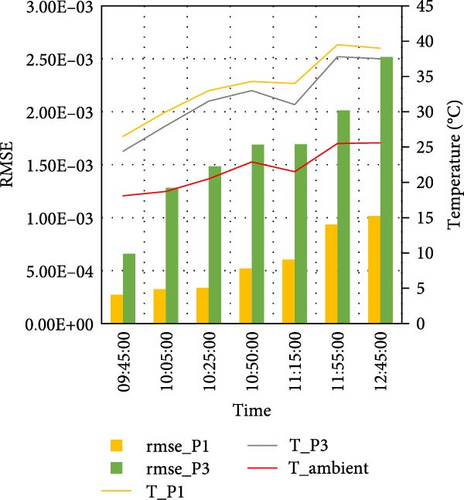
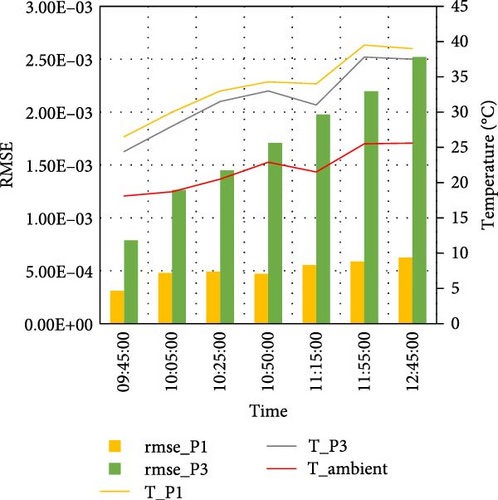
Employing Python programing language to implement the ISOA while using the recorded experimental data of current and voltage that are available in Table S2 through Table S8 in Appendix A, Table 3 presents the DDM-extracted DC parameters for each panel on September 27, 2023 at selected times of the day, while Table 4 displays the corresponding parameters extracted from the SDM. Simultaneously, the accuracy of this identification process is indicated by the RMSE metric values, also included in the same tables. Given that the variance between the panels primarily stems from the presence of dust on the respective surfaces, the tabulated data below illustrates a decline in prediction accuracy with dust accumulation. Essentially, the objective of minimizing the optimization problem here is to yield RMSE values approaching zero. Any elevation in the RMSE values signifies a decrease in accuracy.
| Panel | P1 | P3 | ||||
|---|---|---|---|---|---|---|
| 9:45 a.m. | 11:15 a.m. | 12:45 p.m. | 9:45 a.m. | 11:15 a.m. | 12:45 p.m. | |
| RMSE | 0.00027 | 0.00060 | 0.00101 | 0.00065 | 0.00169 | 0.00251 |
| Iph [A] | 0.18998 | 0.30379 | 0.35381 | 0.14270 | 0.23177 | 0.27331 |
| Io1 [A] | 7.49810E−07 | 3.13611E−08 | 6.45852E−08 | 3.44322E−10 | 1.0E−12 | 1.0E−12 |
| Io2 [A] | 1.93742E−10 | 1.0E−12 | 1.0E−12 | 1.0E−12 | 1.09466E−09 | 1.07706E−08 |
| n1 | 36 | 24.29533 | 24.66874 | 20.32724 | 36 | 18 |
| n2 | 19.79697 | 30.62980 | 36 | 19.22017 | 20.49674 | 22.44531 |
| Rsh [Ω] | 5225.602 | 3535.95827 | 7740.05031 | 933.32701 | 909.39525 | 1231.00604 |
| Rs [Ω] | 0.5 | 0.31359 | 0.29505 | 0.5 | 0.5 | 0.20944 |
- Abbreviations: DDM, double-diode models; ISOA, improved snake optimization algorithm; RMSE, root mean square error.
| Panel | P1 | P3 | ||||
|---|---|---|---|---|---|---|
| 9:45 a.m. | 11:15 a.m. | 12:45 p.m. | 9:45 a.m. | 11:15 a.m. | 12:45 p.m. | |
| RMSE | 0.00031 | 0.00055 | 0.00062 | 0.00078 | 0.00197 | 0.00252 |
| Iph [A] | 0.19012 | 0.30314 | 0.35307 | 0.14242 | 0.23098 | 0.27235 |
| Io[A] | 1.90661E−08 | 3.26444E−08 | 2.10058E−08 | 1.12837E−09 | 3.36727E−09 | 1.04198E−08 |
| n | 25.02706 | 24.35221 | 23.01309 | 21.61028 | 21.76161 | 22.39095 |
| Rsh [Ω] | 3258.08476 | 6894.08991 | 10,000 | 1010.68406 | 1073.31126 | 1501.54393 |
| Rs [Ω] | 0.13489 | 0.32217 | 0.5 | 0.18513 | 0.22859 | 0.22923 |
- Abbreviations: ISOA, improved snake optimization algorithm; RMSE, root mean square error; SDM, single-diode model.
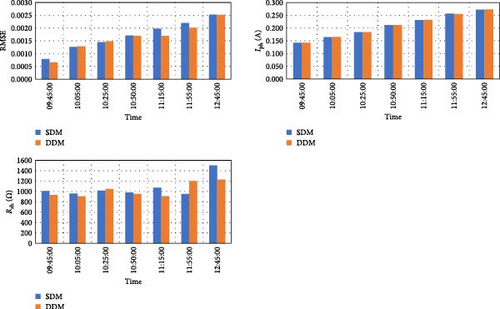
Examining Figures 14 and 15 which display the change in RMSE in response to solar irradiance and ambient and module temperatures, respectively, the DDM outperforms the SDM in terms of accuracy under clean conditions (i.e., P1), consistent with established findings [51]. However, in the presence of dust, both models predict the DC parameters with comparable accuracy, albeit with a slight superiority observed for the DDM.
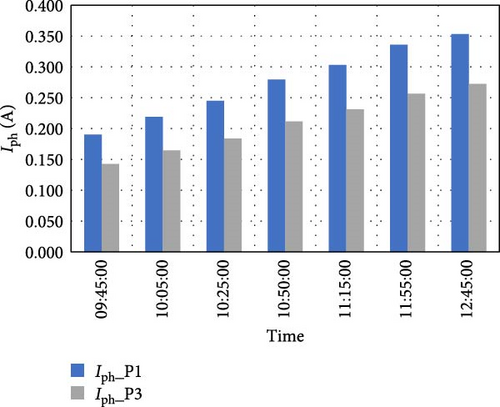
Increased utilization of visualization techniques will facilitate a deeper understanding and enable more comprehensive observations regarding the extracted DC parameters. For the photocurrent (Iph), a detectable structured behavior is noticeable in the values that were listed in the tables, considering the clean and dusty conditions. While Iph values decrease notably in P3, the heavily dusted module, compared to P1, an overall trend of increasing values is also observed as the day progresses and solar intensity rises, which is again a typical influence of irradiance intensity on the Iph [49]. These trends are depicted in Figure 16, which compares Iph values between the SDM and DDM. Interestingly, both models exhibit almost identical behavior in the presence or absence of dust, reinforcing the earlier observation of minor differences in accuracy between the DDM and SDM under clean and dusty conditions.

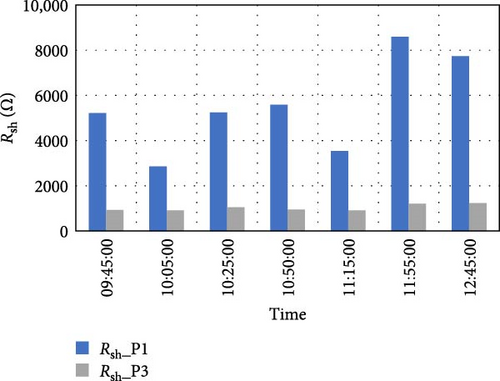
Another crucial DC parameter, the shunt resistance (Rsh) displays a uniform trend influenced by dust presence, as depicted in Figure 17. Typically, Rsh values decrease with rising ambient and module temperatures and increased solar irradiance [52]. However, panel P3 shows a significant decrease in the extracted Rsh values compared to the clean condition (P1), suggesting the impact of dust accumulation in this scenario.

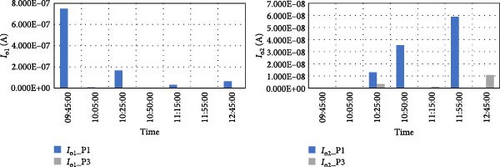
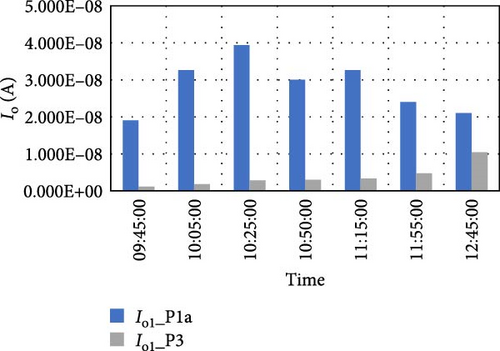
In second place in terms of consistency comes the diode reverse leakage current (Io), where tabulated values show compliance with the presence of dust, albeit with less steadiness compared to earlier parameters, Iph and Rsh. Figure 18 illustrates that the DDM yields two reverse current parameters for each diode, with lower predicted values observed for P3 in most cases, likely due to dust accumulation. Conversely, the SDM shows higher Io values in the absence of dust, consistent with the expected interaction of Io with increasing solar irradiance and temperature [53]. However, under dusty conditions, the magnitudes are lower and more uniform, indicating the influence of dust. Consequently, the SDM outperforms the DDM in terms of Io.
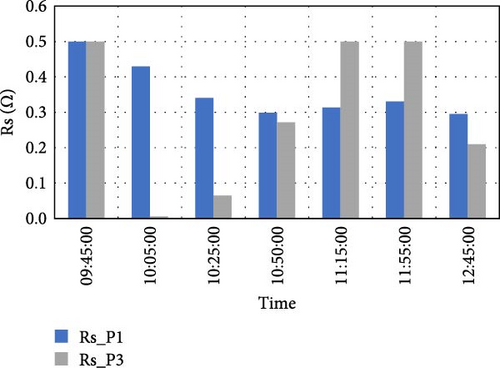
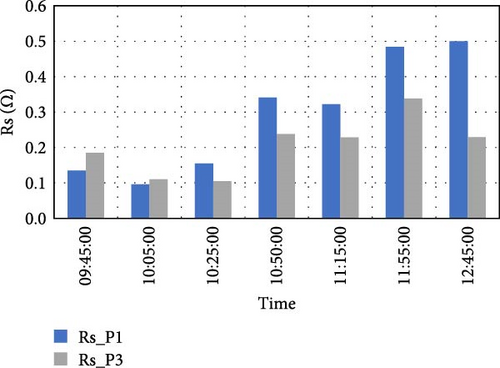
Finally, the series resistance (Rs) is considered, with its values predicted by both models in what appears to be a chaotic manner. Generally, there is no significant effect of solar irradiance on Rs [49], while the temperature effect differs with the cell technology. Yet, conflicting results have been produced in studies on crystalline silicon, for instance [54]. In Figure 19, the SDM appears advantageous in certain instances; however, the reliability of this parameter for characterizing solar panels affected by dust remains questionable. A well-known fact worth stating here is that it is desirable to have low values of Rs to minimize its impact on the FF and, consequently, the maximum power output. At the same time, Rsh should be as high as possible to reduce leakage current [55]. These desirable characteristics are reflected in the values presented in the tables above and visualized in the corresponding figures.
In summary, the visualization confirms that dust deposits reduce the accuracy of both SDM and DDM prediction capabilities, although the DDM shows a slight advantage over the SDM. When examining the extracted parameters, the SDM consistently indicates the presence of dust on the solar panel surface for Iph and Rsh, followed by Io and n, albeit with less consistency but still displaying detectable dust effects. In contrast, the DDM only exhibits meaningful behavior for Iph and Rsh in response to dust. This conclusion is illustrated in Figure 20. Interestingly, neither model adequately describes the effect of dust on Rs.
Despite the DDM’s representation of partial shading phenomena, which is often used to approximate the dust effect, its additional terms and complexity only marginally improve the accuracy compared to the SDM in the presence of dust. The SDM outperforms the DDM in characterizing the electrical performance of dust-covered solar panels based on the number of consistently extracted DC parameters. However, both models accurately predict two common parameters, namely Iph and Rsh, with nearly identical accuracy. The computationally derived values of these two parameters also align well with the environmental conditions observed during outdoor testing, suggesting their efficacy in characterizing panel performance based on equivalent circuit DC parameters. This observation is evident from Figure 21, which illustrates a comparison of the outputs between the DDM and SDM for the dusty module P3.
Ultimately, neither model sufficiently captures the nuances of dust effects. Researchers may find it more practical to rely on the SDM for simplicity when studying the impact of dust on individual DC parameters. This underscores the critical necessity for comprehensive enhancements in the mathematical formulations of equivalent circuit models as a whole, in order to better model this specific phenomenon.
5. Conclusion
In this study, the electrical performance of dust-covered solar panels was analyzed using the ISOA optimization technique and experimental data to extract DC parameters for both the SDM and DDM. On the experimental side, a testbed was subjected to 3 h of sunlight exposure. During this period, solar irradiance, ambient temperature, and module temperatures were recorded for both clean and dusty PV panels. Notably, the dusty module P3 generated 23.39% less electric energy compared with the clean panel P1 due to dust. Analysis of the FF revealed that dust accumulation on P3 led to scattered islands on its surface, enhancing the FF by improving the diffuse light component. On the other hand, despite increasing solar irradiance throughout the day, a consistent trend of decreased conversion efficiency in panels under dust cover was observed.
Computationally, the DDM exhibited superior accuracy compared to the SDM under clean conditions. However, both models demonstrated comparable accuracy in the presence of dust, with a slight advantage for the DDM. Comparing clean and dusty conditions, the maximum RMSE decreases were 339.1% and 303.5% for the DDM and SDM, respectively, while the minimum decreases were 115.3% and 153.5%, respectively. Further analysis, incorporating the DC parameters of Iph, Rsh, Io, and n unveiled varying trends influenced by dust presence. Notably, the SDM outperformed the DDM in the number of consistently extracted parameters, while meaningful behavior was observed for only Iph and Rsh with the DDM, which indicates the weakness of the approximation of dust cover as partial shading, the latter phenomenon that the DDM is its mathematical representative. On average, identified Iph values decreased by 24.2% for the DDM due to dust, while Rsh decreased by 79.7%. Conversely, for the SDM, the average decrease in Iph was 24.2%, Rsh 80.1%, Io 84.6%, and n 10.5%.
Several limitations should be considered. The short test duration may not fully capture the long-term effects of dust on panel performance. Real-world factors, such as dust composition, particle size, cleaning frequency, and environmental conditions like humidity and wind speed, were not accounted for and may significantly influence the results. Additionally, both the SDM and DDM models have limitations in accurately representing the dust impact on energy generation.
In conclusion, while the SDM offers simplicity, it was found inadequate in capturing the full impact of dust. Neither model accurately represented the dust effect, highlighting the need for improvements in their mathematical derivations. It is recommended that both models be refined, particularly to better incorporate dust effects. Future studies should include more comprehensive field tests under varying environmental conditions to validate these improvements.
Nomenclature
-
- A:
-
- Module area
-
- G:
-
- Solar irradiance
-
- I:
-
- Current
-
- Ic:
-
- Calculated current
-
- Im:
-
- Measured current
-
- Io:
-
- Diode saturation current
-
- Iph:
-
- Photocurrent
-
- Isc:
-
- Short-circuit current
-
- I − V:
-
- Current voltage
-
- n:
-
- Ideality factor
-
- Rs:
-
- Series resistance
-
- Rsh:
-
- Shunt resistance
-
- V:
-
- Voltage
-
- Vm:
-
- Measured voltage
-
- Voc:
-
- Open-circuit voltage
-
- VT:
-
- Thermal voltage
-
- Pmax:
-
- Maximum power
Acronyms
-
- DC:
-
- Direct current
-
- DDM:
-
- Double-diode model
-
- ISOA:
-
- Improved snake optimization algorithm
-
- PV:
-
- Photovoltaics
-
- RMSE:
-
- Root mean square error
-
- SDM:
-
- Single-diode model
-
- SOA:
-
- Snake optimization algorithm
Greek symbols
-
- ⴄ:
-
- Conversion efficiency
Nondimensional parameters
-
- FF:
-
- Fill factor.
Ethics Statement
The authors declare that no human participants, their data, or biological material are included in this study. Furthermore, there are no ethical issues related to the research conducted in this work.
Consent
The authors declare that no volunteers, participants, or individuals were involved in this research study, and therefore, no consent was obtained. The authors grant permission for the publication of the manuscript in Environmental Science and Pollution Research, published by John Wiley & Sons, Inc.
Conflicts of Interest
The authors declare no conflicts of interest.
Author Contributions
All authors contributed to the study conception and design. Material preparation, data collection, and analysis were performed by Abubaker Younis, Fatima Belabbes, Petru Adrian Cotfas, and Daniel Tudor Cotfas. The first draft of the manuscript was written by Abubaker Younis, and all authors commented on previous versions of the manuscript. All authors read and approved the final manuscript.
Funding
The authors declare that no funds, grants, or other support were received during the preparation of this manuscript.
Supporting Information
Additional supporting information can be found online in the Supporting Information section.
Open Research
Data Availability Statement
Data available in article Supporting information.


