Particle Swarm Optimization Controlled High-Gain Three-Port DC–DC Converter With Reduced Switches and Passive Elements for Electrical Vehicle Charging Station
Abstract
This paper presents a three-port DC–DC converter along with a high-gain converter that incorporates a photovoltaic (PV), a hybrid energy storage system (HESS), and a DC link capacitor to formulate a stable standalone supply unit for electric vehicle (EV) charging application. The HESS consists of a battery and a supercapacitor which efficiently manages sudden load changes and variations in PV output. The developed system reduces the size of storage components, extends battery life, and allows the supercapacitor to handle rapid fluctuations. A maximum power point tracking (MPPT) strategy is utilized to regulate the DC link voltage and enhance voltage boosting capabilities and effective power management between the battery and supercapacitor. The transfer function models of a three-port DC–DC converter integrated with PV and HESS are developed from the small signal model to tune the proportional–integral (PI) controller using a particle swarm optimization (PSO) technique. On the other hand, a positive output voltage super-lift Luo converter along with PI controller is incorporated to regulate the required voltage level for charging an EV battery. The developed system is analyzed, and the controller’s performance is validated using MATLAB/Simulink in both transient and steady-state conditions. The combined control strategies effectively regulate the DC link voltage against PV irradiation and also load current variations which enhances overall system efficiency.
1. Introduction
Renewable energy sources have become more efficient and cost-effective, allowing them to play a vital role in global efforts to reduce carbon emissions and combat climate change. Current trends emphasize the need for flexible energy systems that combine various renewable sources which also includes energy storage systems such as battery and supercapacitor to balance supply and demand, ensuring a stable and reliable energy supply. To support this integration, multiport converter is used to transfer the energy between numerous inputs and outputs ports. Banaei et al. [1] designed a multi-input DC–DC converter for buck–boost and boost operations, utilizing proportional–integral (PI) controllers to achieve stable voltage output, high-voltage gain, and reduced semiconductor stress. Teja et al. [2] formulated a high-gain multiport converter to integrate both photovoltaic (PV) and energy storage systems, enabling efficient energy transfer to high-voltage DC buses. Kim and Kwak [3] developed a multifunctional controller for multiport converters, enhancing bidirectional energy flow and improving power delivery in three-port converters. Tomas-Manez et al. [4] introduced a three-port DC–DC converter capable of delivering up to 4 kW while integrating PV and battery systems with grid-tied applications, thereby enhancing modular efficiency for future energy system innovations. Kanhav [5] designed a bidirectional multiport converter to improve reliability in hybrid energy systems by enabling transformerless interfacing of asymmetrical sources, resulting in better dynamic responses and more robust control strategies. Al-Soeidat et al. [6] highlighted the importance of advanced control strategies for efficient power management in multiport converters. Honarjoo et al. [7] utilized coupled inductors and switched capacitors in a three-port DC–DC converter to achieve significant voltage gain, reflecting advancements in semiconductor technology. Khan et al. [8] employed switched capacitors for high-voltage gain and PI compensation to enhance stability and efficiency in a multiport DC microgrid, aligning with ongoing trends in optimizing energy distribution. Farakhor, Abapour, and Sabahi [9] achieved high output voltage gain in a two-input boost DC–DC converter without using coupled inductors, promoting efficiency and simplifying designs in renewable energy applications. Faraji, Adib, and Farzanehfard [10] simplified power management in a nonisolated high step-up multi-input converter by employing soft-switching techniques. Jalilzadeh et al. [11] designed a dual-input, dual-output step-up converter with high-voltage gain even at low duty cycles. Switching and conduction losses were reduced due to minimized normalized maximum voltage stress across devices. Later, Jalilzadeh et al. [12] designed a transformerless dual-input, dual-output DC–DC converter with similar advantages but incorporated a pole placement control algorithm to enhance stability and efficiency in modern systems. Chandrasekar et al. [13] developed a triple-port converter as a standalone unit with four switches, capable of operating in four modes: (i) PV supplying the load and charging the battery, (ii) PV and battery jointly supplying the load, (iii) battery alone supplying the load, and (iv) PV alone supplying the load. Their multiobjective control algorithm effectively manages power flow, essential for future hybrid applications. Faraji and Farzanehfard [14] designed a triple-port converter with four operational modes, utilizing five switches and soft-switching techniques to improve efficiency and reduce conduction losses. Faraji et al. [15] extended this concept to a nonisolated triple-port bidirectional converter with a single shared inductor, streamlining energy conversion processes and advancing control mechanisms. Rostami, Abbasi, and Talebi [16] designed a triple-port converter with four modes of operation and three switches, complemented by small-signal analysis and compensator design for each mode. Khasim, Dhanamjayulu, and Muyeen [17] developed a triple-port converter with a single inductor supporting all four modes, employing small-signal modeling and Bode plot analysis before and after compensation. Askarian, Pahlevani, and Knight [18] created a three-port converter for PV and energy storage systems using two switches. They developed AC modeling of the converter, implementing a control algorithm based on duty ratio and switching frequency for controlled power flow between ports. Ravada, Tummuru, and Ande [19] designed a four-port converter with three switches to integrate PV, wind, and hybrid energy storage systems (HESSs). A simple control structure was used to operate the renewable sources at maximum power points, with system transfer functions developed to analyze stability. Yi et al. [20] designed a four-port converter consisting of two boost converters, switched capacitors, and a bidirectional buck–boost converter with four switches. Small-signal modeling was conducted for each operating mode to design a compensator. Bhattacharyya et al. [21] proposed a nonisolated two-input, one-output converter to integrate batteries and ultracapacitors for electric vehicle (EV) applications. A supervisory power control scheme was proposed to manage load fluctuations in EVs and ensure proper power distribution. Saafan et al. [22] developed a five-port converter with four switches, complemented by state-space modeling and compensator design for each mode.
It is seen from the literature that there is a need for simple control algorithm which helps to maintain the load voltage at rated value against the fluctuations in the energy output of renewable sources. To develop the advanced control algorithm, the linearized small signal model is required. Another important inference is to meet the power requirement of EV; the output port voltage of multiport converter should be increased to high value. This can be achieved by integrating the multiport converter with high-gain converter.
- i.
The integration of a three-port DC–DC converter with a super-lift Luo converter significantly enhances the high-voltage conversion ratio and improves overall system efficiency.
- ii.
A particle swarm optimization (PSO)-tuned PI controller combined with a saturation limiter effectively maintains a stable output voltage under varying load as well as solar irradiances.
- iii.
Maximum power point tracking (MPPT) control strategies ensure power balance between PV and HESS systems while keeping the DC link voltage constant.
- iv.
The small signal model developed for three-port DC–DC converter is used to obtain transfer function model and also used to design PSO-tuned PI controller.
- v.
Supercapacitors help smooth out currents from PV and HESS systems during sudden load changes, ensuring the DC link voltage remains stable.
The structure of this paper is organized as follows: Section II discusses the representation of the overall system which is designed in this work. It shows a block diagrammatic representation and a circuit diagram with all parameters involved. Section III discusses steady-state analysis of three-port DC–DC converter and super-lift Luo converter and modes of operation. Section IV shows the mathematical modeling, and Section V explains the control strategy of the three-port DC–DC converter. Section VI provides simulation results and discussions. Finally, Section VII discusses the conclusion and followed by references.
2. System Representation
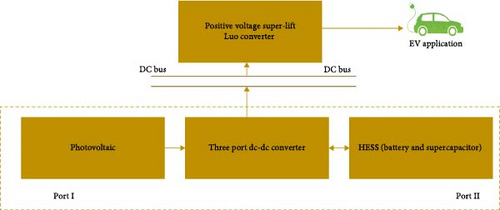
Figure 1 shows the block diagram representation of the system in which a PV is integrated with a HESS like battery and supercapacitor connected to a common DC bus [19]. The DC bus ensures stable and regulated power transfer between the three-port DC–DC converter and the positive output voltage super-lift Luo converter, which then steps up the voltage to meet the requirements of the EV system.
The schematic of three-port converter along with high-gain converter is shown in Figure 2.
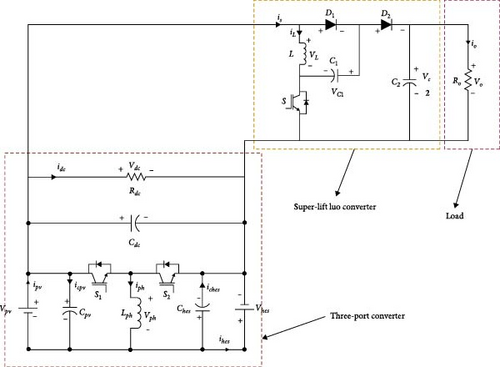
The primary function of this converter is to modulate voltage and current across each port through controlled switching, thus optimizing power flow between the connected elements. In conjunction, the positive output voltage super-lift Luo converter is designed to boost the output voltage significantly above the input. For control, the three-port DC–DC converter employs a PSO-tuned PI controller, and the cascaded PI controllers are designed for super-lift converter. PSO is utilized to fine-tune the PI controllers, which are crucial for achieving precise voltage and current regulation. The mathematical model is developed for three-port converter to do analysis and to use PSO optimization techniques. The overall system achieves enhanced efficiency, reduced losses, and robust performance across a range of operational scenarios.
3. Steady-State Analysis of the Three-Port DC–DC Converter and Modes of Operation
3.1. Three-Port DC–DC Converter Configuration
A three-port DC–DC converter shown in Figure 2 utilizes a bidirectional buck–boost converter to interface the PV, HESS, and DC link capacitor. The inductors employed for decoupling the PV and HESS are denoted by Lph. The voltage levels of the PV, HESS, and DC link capacitor are represented by Vpv, Vhes, and Vdc, respectively. The currents flowing through the PV, HESS, inductor (in between PV and HESS), and DC link capacitor are denoted by ipv, ihes, iph, and idc respectively. The switches S1 and S2 control the PV and HESS connections, respectively. The duty cycles of the PV and HESS are represented by Dph and (1-Dph) respectively.
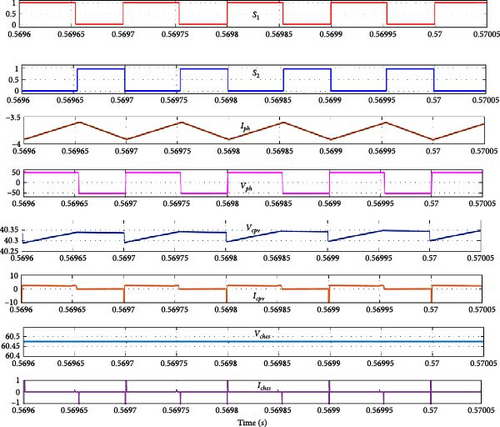
The system operates in two distinct modes controlled by switches S1 and S2, and the steady-state waveforms of the converter are shown in Figure 3. In mode-I, when S1 is turned on and S2 is turned off, the inductor current iph charges at a rate of Vph/Lph, effectively storing energy from the PV in Lph. The voltage across the inductor Vph and the voltage across the capacitor Vcpv are both equal to Vpv. During this period, capacitor Ches discharges into the HESS, while the load receives power from Cdc. In mode-II, when S1 is turned off and S2 is turned on, the inductor current iph discharges energy through the HESS and to the load. The voltage across the inductor Vph and the voltage across the capacitor Vches are both equal to Vhes. During this period, the PV system supplies power to both the load and Cdc via Lph, effectively meeting energy requirements. By alternating between both switches being on and off, the DC link voltage Vdc is regulated. Ultimately, Vdc is the sum of the voltages from the PV system and the HESS. This continuous cycling between the two modes allows for efficient energy management and reliable power delivery. The seamless interaction of these components enhances the overall performance of the system, adapting to varying load conditions while maintaining stability and efficiency. When PV is available, S1 and S2 switches must be operated to charge or discharge the battery and activate the PV with MPPT. When PV is not present, HESS maintains the voltage across Cpv, allowing the switches S1 and S2 to be operated to adjust the voltage at the DC link to the reference voltage (Vdcr). At the DC link capacitor, where the battery supplies average power and the supercapacitor supplies oscillatory power, the HESS absorbs excess or shortage power. Therefore, the three-port DC–DC converter enables MPPT and effectively manages HESS charging and discharging power.
3.2. State-Space Averaging of the Three-Port Converter
The state-averaged model is used to analyze the stability of the system and determine the parameters of controllers using optimization techniques [23].
3.2.1. Mode-I
In mode-I, switch S1 is closed, and S2 is opened, and the equivalent circuit is shown in Figure 4a.
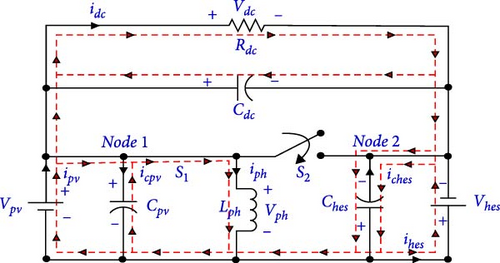
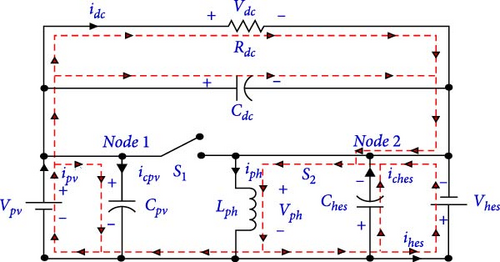
The output current of idc is equal to Vdc/Rdc.
- 1.
State equation:
- 2.
Output equation:
The above equations are written in state-space form considering iph, Vpv, and Vres as state variables and ipv and ihes as input variables.
3.2.2. Mode-II
The equivalent circuit when switch S1 is opened and S2 is closed is shown in Figure 4b.
The output voltage of Vdc is the sum of Vpv and Vhes.
The output current of idc is equal to Vdc/Rdc.
The state-space averaged model obtained helps to determine the equilibrium state vector in terms of other variables and helps to do analysis of multiport converter at equilibrium conditions.
3.3. Comparison of the Proposed Model With Simulation
Figure 5 shows the bar chart of the DC link output voltage (Vdc) and the inductor current (Iph) obtained from simulation and from model by varying the duty cycle (Dph) for different PV irradiance levels.
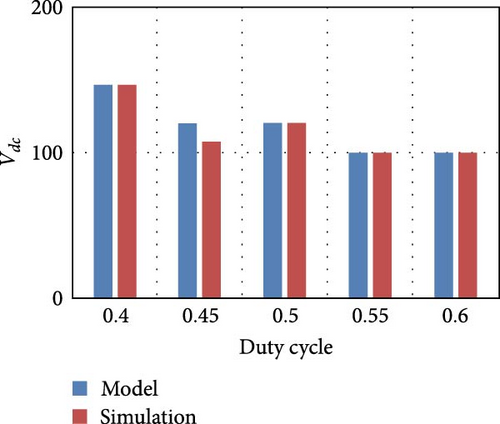
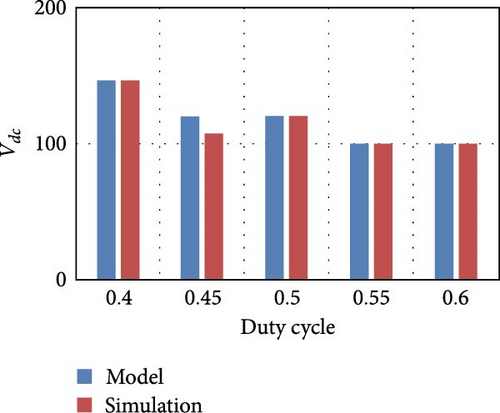
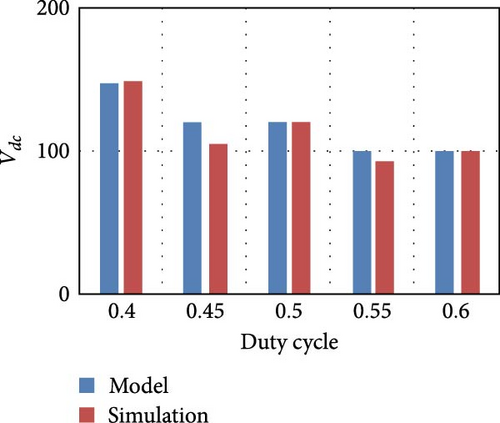
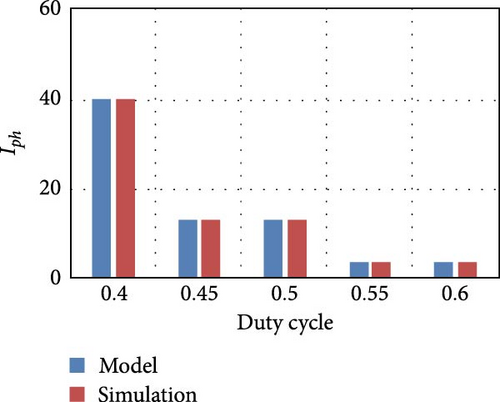
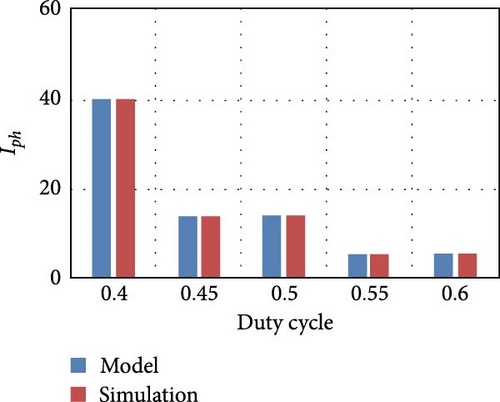
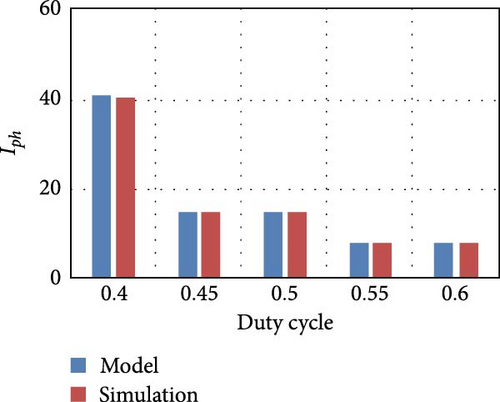
From the bar chart, it is inferred that the results obtained from both simulation and model are exactly matching, and this replicates the accuracy of the model.
4. Positive Output Voltage Super-Lift Luo Converter
The positive output voltage super-lift Luo converter is highly advantageous for applications such as EVs, LED drivers, and industrial automation when compared to conventional converters like Buck, Boost, SEPIC, and Cuk. Its design offers superior voltage gain and efficiency, minimizes component stress, and enhances reliability and capability to maintain stable output under variable loads which further enhances its suitability. To enhance EV performance and to obtain voltage regulation, a super-lift Luo converter is integrated with a buck converter in a single-input dual-output [24]. A dual-input dual-output converter is developed by integrating super-lift Luo and boost converters for effective management of PV and battery systems, suited for EV charging applications [25].
4.1. Modes of Operation
4.1.1. Mode-I
In mode-I, switch S is on, and inductor current IL increases at a rate of Vs/L. The voltage across the inductor VL is equal to Vs. During this period, capacitor C1 charges, and capacitor C2 discharges to the load which is shown in Figure 6a.


4.1.2. Mode-II
In mode-II, S is off, and inductor current IL and capacitor C1 discharge, and also C2 charges. In this scenario, the source voltage Vs supplies power to the load and is shown in Figure 6b.
The variations in inductor currents and voltages of both inductor and capacitors are shown in Figure 7.
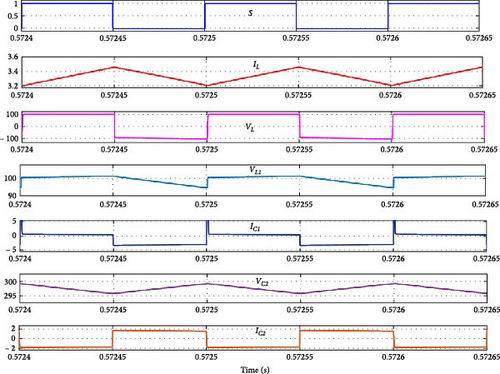
When switch is being on and off, the source Vs is regulated and also maintained constant load voltage (Vo) and load current (Io). This repeated switching between modes supports efficient energy use and provides a stable power supply.
5. Mathematical Modeling of the Three-Port DC–DC Converter
5.1. Mathematical Modeling
For the closed-loop controller design, the converter dynamics must be expressed mathematically to ensure stability and design an effective controller. In this context, the dynamic linearized model of the three-port DC–DC converter is derived using state-space averaging combined with small signal analysis. The three-port DC–DC converter is a second-order system due to the presence of two capacitors (CPV and Ches) one at each port and one inductor (Lph). These components introduce three state variables (iLph, Vpv, and Vhes) and are controlled by one input Dph. The key objectives are to maintain the DC link voltage at its target level and implement MPPT in mode-I and control battery power in mode-II. This requires managing three state variables: iph, Vpv, and Vdc. By applying state-space averaging for each state across different modes and switching conditions, a model of the three-port DC–DC converter can be developed for various operating conditions.
5.2. Dynamic Model
The model developed above is used to obtain transfer function for and . From the above transfer function, the stability of the system before and after compensation can be obtained using Bode plot.
6. PSO-Tuned PI Controller for the Three-Port Converter
6.1. Control Strategy
The control algorithm implemented is shown in Figure 8. It focuses on a dual-loop configuration [22] for the PV and HESS. The reference voltage (Vmpp) for the PV system is determined by the MPPT algorithm. The actual PV voltage is compared with this reference, and the resulting error is processed by a PSO-tuned PI controller, which generates a reference current (iphr) to maintain the PV voltage at Vmpp. This reference current is then compared with the actual current (iph), and the error is fed into another PSO-tuned PI current controller. The output of this controller fed to the saturation limiter is used to generate PWM signals through a PWM generator. When PV is unavailable, the voltage controller uses the difference between the reference DC link voltage (Vdcr) and the HESS voltage (Vhes) to determine the reference voltage (Vpvr). This ensures effective voltage regulation and energy management in the system.

Due to the various interdependencies in the system, two cascaded dual loops are implemented: one for managing current iLph and another for port-1 voltage vpv, performing Vref MPPT control when PV is available or battery power regulation when PV is not available.
6.2. MPPT Algorithm
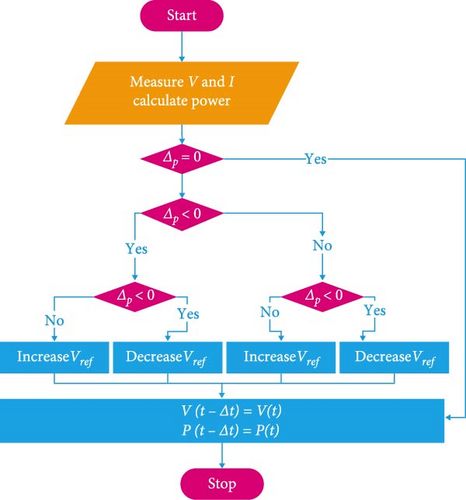
Figure 9 shows the flowchart of Vref MPPT algorithm which optimizes the performance of PV by adjusting the reference voltage to extract maximum power. The first step involves in calculation of power by sensing the current and voltage from the panel. If the error presents when comparing the current power with previous value, then the reference voltage should be adjusted as per the conditions given in flowchart to move closer to the MPP [26]. By repeatedly fine-tuning the reference voltage, the Vref MPPT algorithm ensures that the PV operates at their most efficient power level, thereby maximizing the overall energy generation from the PV. This continuous adjustment process helps to capture the highest possible energy yield under changing environmental conditions.
6.3. PSO-Tuned PI Controller
The automation of the tuning process with optimization techniques significantly reduces the time and effort required for manual adjustments and making the process more efficient and streamlined. PSO is a stochastic-based optimization and more popular in finding the parameters of PID controller. The flowchart representation of the PSO-tuned PI controller implemented in three-port converter for both VMC and CMC is shown in Figure 10.
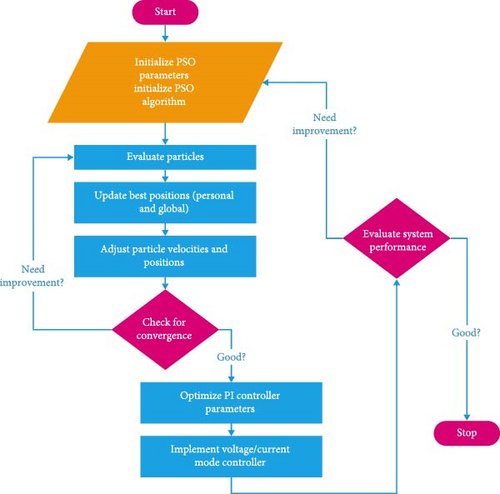
The PSO parameters of number of particles, cognitive and social coefficients, inertia weight, and number of iterations are initialized. Initial particles are created with random positions and velocities representing PI controller parameters. The performance of each particle is computed by applying the PI parameters to the transfer function model of the multiport converter and measuring performance metrics of integral absolute error. The best position for each particle (personal best) and the best position found by the swarm (global best) are determined and updated. The velocity and position of each particle are updated based on the PSO update equations [27]. The convergence of algorithm is evaluated based on iteration count or fitness value. The optimized PI parameters (Kp and Ki) are extracted from the best particle. Voltage mode or current mode control is implemented, and the system performance is evaluated.
The positive output voltage super-lift Luo converter utilizes a cascaded PI controller for both voltage and current modes which enhance performance through sophisticated closed-loop control. The parameters are obtained by trial-and-error method.
7. Results and Discussions
The performance of the integrated three-port DC–DC converter with positive output voltage super-lift Luo converter under various conditions, including different PV irradiances and load current, is analyzed using MATLAB/Simulink. The study focuses on voltage regulation, efficiency, and dynamic response, ensuring the system effectively balances and transfers energy between the PV and HESS while maintaining voltage stability. The system parameters employed in the simulation studies are listed in Tables 1 and 2.
| Parameters | Values |
|---|---|
| PV source Vmpp (V) and Impp (A) | 41.6 V and 2.76 A |
| Battery: nominal voltage (Vb) and capacity (Ah) | 60 V and 30 Ah |
| Supercapacitor- rated voltage (Vsc) and capacitance (F) | 62 V and 10 F |
| Switching frequency | 10 kHz |
| Converter parameters | Lb = 3 mH, Lph = 8 mH, Cpv = 2200 μF, Chess = 2200 μF, Cdc = 1000 μF |
| DC link voltage | 100 V |
| Voltage mode control (VMC) in PSO-tuned PI controller |
|
| Current mode control (CMC) in PSO-tuned PI controller |
|
| Parameters | Values |
|---|---|
| DC link voltage (Vdc) | 100 V |
| Switching frequency | 10 kHz |
| DC link capacitor | 1000 μF |
| Converter parameters | L = 20 mH, C1 = C2 = 25 μF |
| Load parameters | Vo = 300 V, Po = 450 W |
| Voltage mode control (VMC) in PI controller |
|
| Current mode control (CMC) in PI controller |
|
The small signal model derived in Equations (29) and (30) help to obtain the transfer function. For the system specifications given in Table 1, the obtained transfer functions of DC link voltage with respect to the inductor current are , and the transfer function of inductor current with respect to duty ratio is . PSO technique uses this transfer function models to tune PI controller parameters in both voltage and current mode controls.
Figure 11 shows the Bode plots of the system before and after adding PI controller.
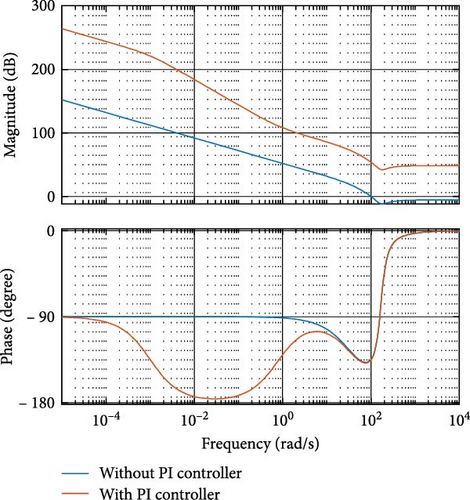
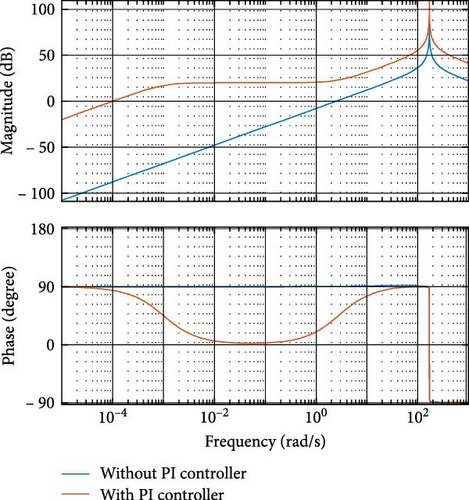
From the Bode plots, it is inferred that the designed PI controller helps to improve the stability of the system.
The entire system is developed in MATLAB/Simulink with PI controller parameters obtained in optimization technique, and the results are discussed.
In Figure 12a,b, the variation of battery and supercapacitor currents and variations in powers are shown, respectively, when PV operates under a constant irradiance of 1000 W/m2, with load disturbances occurring at regular intervals of time. When the load current is increased at t = 2 s, both the battery and supercapacitor discharge energy to meet the load demand. At t = 4 s, the load current is decreased, the battery continues to discharge, and the supercapacitor begins charging to store excess energy. Similarly, At t = 6 s, both the battery and supercapacitor discharge again effectively to manage the load requirements as there is an increase in the current.
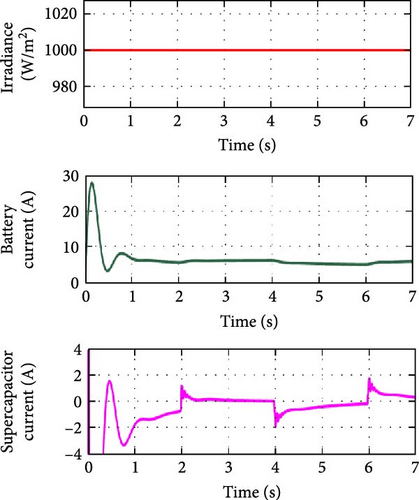
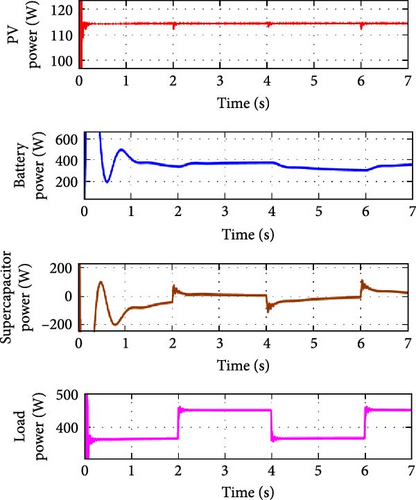
Figure 13 shows the output voltage at load and DC link voltage under constant irradiance and load variations.
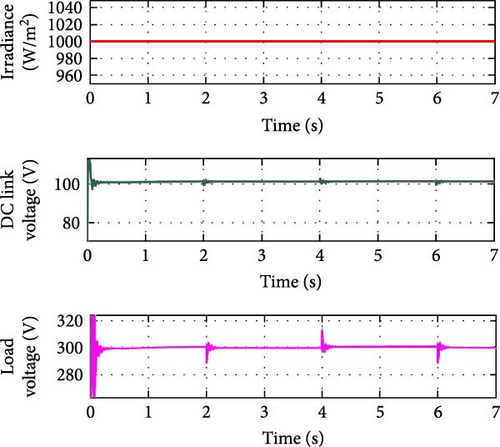
The PV operates under a constant irradiance of 1000 W/m2, with increase or decrease in load currents occurring at regular intervals of time to maintain stability in both the DC link voltage which is 100 V and the load voltage which is 300 V.
In Figure 14a,b, the PV irradiance decreases and increases at regular intervals of time without load disturbances. When irradiance decreases from 1000 to 600 W/m2, a small decrease in PV output causes the battery to discharge and the supercapacitor to charge. Similarly, at t = 3 s, the battery and supercapacitor discharge together as PV irradiance continues to decrease from 600 to 100 W/m2. In contrast, PV irradiance increases from 100 to 600 W/m2 at t = 5 s which make the battery alone to discharge to supply the load requirement.
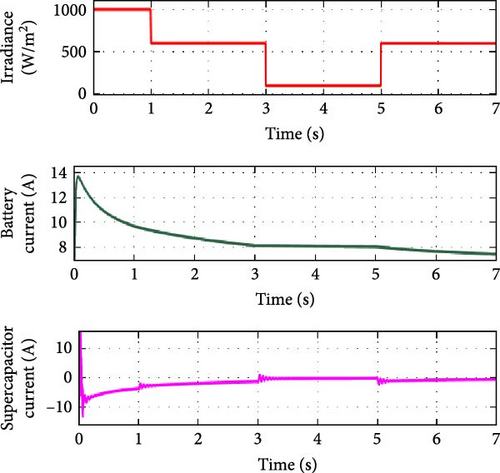
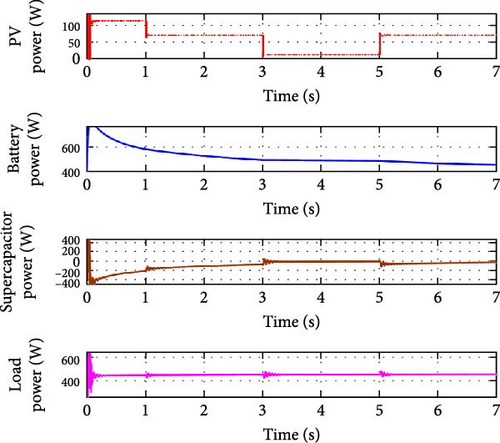
Figure 15 shows the ability of the controller to maintain the DC link and load voltage values constant against increase and decrease variations in PV irradiance levels. When PV irradiance decreases from 1000 to 600 W/m2 at t = 1 s, both battery and supercapacitor powers play an active role in meeting the constant load power. At t = 3 s, the load power remains stable against the continuous decrease in PV irradiance from 600 to 100 W/m2 as the contributions from both the battery and supercapacitor continue to support the constant load power. Conversely, when PV power increases at t = 5 s, again, the battery and supercapacitor still work together to ensure the constant load power.
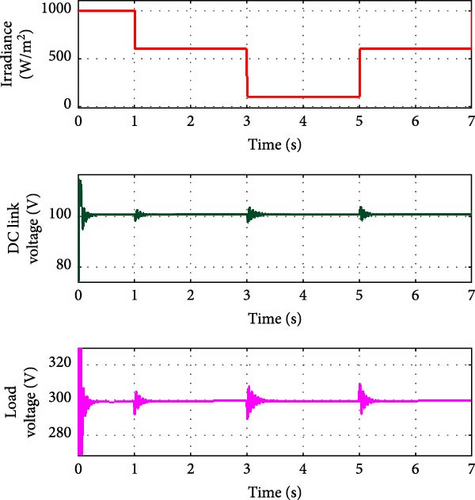
Figure 16a,b shows the ability of the controller to bring back the load voltage and DC link voltage to the rated value within a very short transient period when the load current is increased and decreased at regular intervals of time. The load current is increased to 1.5A at t = 2 s and decreased to 1.2 A at t = 4 s and again increased to 1.5 A at t = 6 s. The graph shows the maintenance of voltages against load variations.
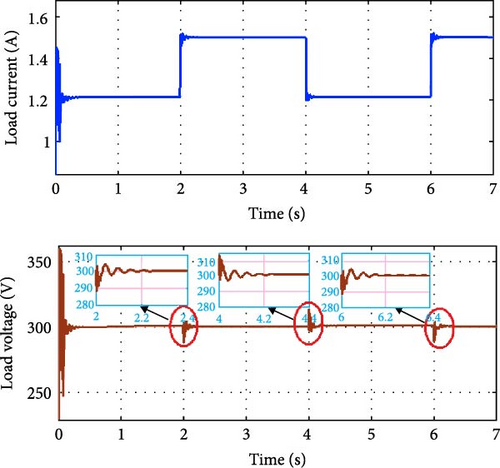
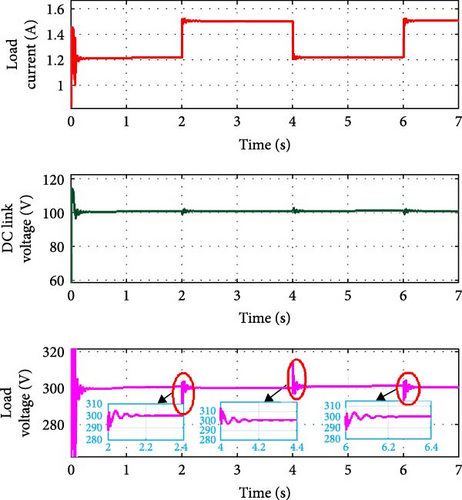
This effective regulation ensures that fluctuations in load current do not affect the stability of the DC link and load voltages.
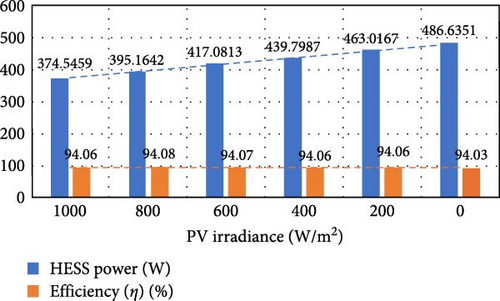
Table 3 shows the quantitative data of the PV, HESS, and load powers for different PV irradiance levels by maintaining load current constant. It is inferred that HESS will contribute power due to the decrease in the PV power. The bar chart shown in Figure 17 shows that the efficiency is maintained constant and HESS power increases due to the decrease in PV irradiance levels.
| PV irradiance (W/m2) | Load current (A) | Load resistance (ohm) | PV power (W) | HESS power (W) | DC link power (W) | Load power (W) | Efficiency (η) (%) |
|---|---|---|---|---|---|---|---|
| 1000 | 1.5 | 200 | 114.4 | 374.5459 | 478.6 | 450.2 | 94.06 |
| 800 | 1.5 | 200 | 93.26 | 395.1642 | 478.1 | 449.8 | 94.08 |
| 600 | 1.499 | 200 | 70.88 | 417.0813 | 477.6 | 449.3 | 94.07 |
| 400 | 1.498 | 200 | 47.64 | 439.7987 | 477.1 | 448.8 | 94.06 |
| 200 | 1.497 | 200 | 23.84 | 463.0167 | 476.6 | 448.3 | 94.06 |
| 0 | 1.496 | 200 | 0 | 486.6351 | 476.1 | 447.7 | 94.03 |
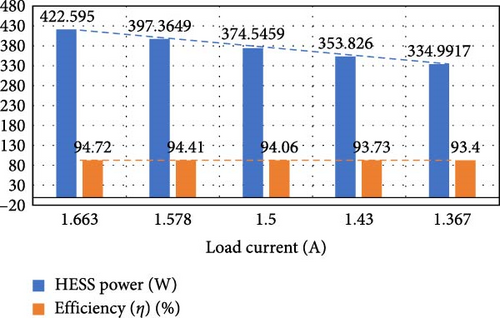
Table 4 shows the quantitative data of the PV, HESS, and load powers for different load currents by maintaining PV irradiance levels constant. It is inferred that HESS will compensate power due to the increase and decrease in the load current. The bar chart shown in Figure 18 shows that the efficiency is maintained constant and the HESS power decreases due to the decrease in load currents.
| PV irradiance (W/m2) | Load current (A) | Load resistance (ohm) | PV power (W) | HESS power (W) | DC link power (W) | Load power (W) | Efficiency (η) (%) |
|---|---|---|---|---|---|---|---|
| 1000 | 1.663 | 180 | 114.3 | 422.5850 | 525.6 | 497.9 | 94.72 |
| 1000 | 1.578 | 190 | 114.4 | 397.3649 | 500.9 | 472.9 | 94.41 |
| 1000 | 1.5 | 200 | 114.4 | 374.5459 | 478.6 | 450.2 | 94.06 |
| 1000 | 1.43 | 210 | 114.4 | 353.8260 | 458.3 | 429.6 | 93.73 |
| 1000 | 1.367 | 220 | 114.4 | 334.9917 | 439.8 | 410.8 | 93.40 |
From the above results and discussions, it is inferred that the linearized small signal mathematical model developed in this paper helps to tune PI controller parameters using optimization technique. The control strategy implemented here maintains the load and DC link voltages constant against variations in PV which is not done in Ravada, Tummuru, and Ande [19].
The major issue with converter of Ravada, Tummuru, and Ande [19] is the difficulty in dynamically adjusting and regulating the DC link voltage during PV operation when employing cascaded PI controllers. As a result, the DC link voltage does not remain stable, thereby limiting the converter flexibility and control capabilities during PV operation. The above issues are overcome in this work by adding saturation limiter along with PSO-tuned PI controller to manage voltage and power levels. The controller, enhanced by the saturation limiter, ensures that voltage levels remain stable by limiting the control signal to safe operating ranges.
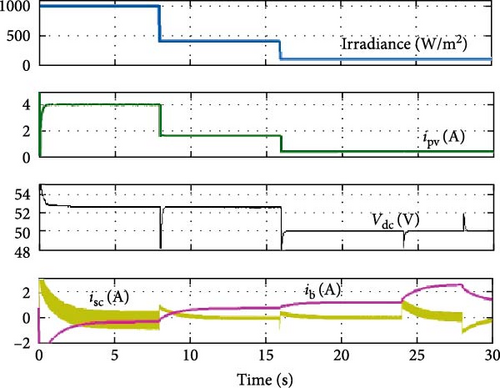
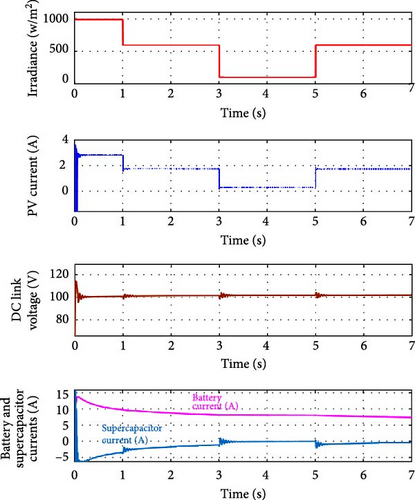
In Figure 19a as per Ravada, Tummuru, and Ande [19], the DC link voltage (Vdc) fluctuates with changes in PV irradiation, indicating instability. In contrast, the present approach (Figure 19b) shows that the DC link voltage (V) remains stable, effectively countering the effects of varying irradiation and ensuring consistent voltage control. This comparison highlights the effectiveness of the controller designed by PSO technique which uses the transfer function models to tune the PI controller parameters in successfully stabilizing the system under fluctuating irradiance conditions.
8. Conclusion
The integration of a three-port DC–DC converter with a positive output voltage super-lift Luo converter marks a significant advancement in power conversion technology. This hybrid system effectively merges the versatile three-port architecture with the high-voltage conversion ratio of the positive output voltage super-lift Luo converter, achieving superior energy efficiency and adaptability. Such a combination is particularly advantageous for applications requiring robust power management and precise voltage control including LED driver, EVs, and industrial automation. These hybrid systems integrate a MPPT combined with PSO-tuned PI controller, and the design leverages PSO broad optimization capabilities and PI precise control mechanisms, achieving exceptional dynamic response and system stability. Simulation results affirm the accuracy of the mathematical model and highlight the converters superior performance. This approach not only sets a new standard in energy management and power conversion but also offers a transformative solution for the next generation of high-performance and reliable power systems. The advanced capabilities of this hybrid system make it a transformative technology for modern electronics, offering superior adaptability and performance for a wide range of industrial and technological applications.
Conflicts of Interest
The authors declare no conflicts of interest.
Author Contributions
Balasubramanian Ganesan and Augusti Lindiya Susaikani contributed to conceptualization, methodology, formal analysis, and writing–original draft. Subashini Nallusamy and Uma Dharmalingam contributed to validation and formal analysis. Natarajan Prabaharan contributed to validation and writing–review and editing. All authors have read and agreed to the submitted revised manuscript.
Funding
The authors did not receive any funding from any source for this study.
Acknowledgments
The authors thank their institution for their extended support throughout this work.
Open Research
Data Availability Statement
No data were used in this manuscript.


