Advanced Control Strategies for Wind Turbine Blade Angle Systems: A Comparative Study of Optimization Algorithms and Controllers
Abstract
Wind energy is a critical component of renewable energy systems, but the stochastic nature of wind speed poses significant challenges for consistent power generation. This paper addresses these challenges by proposing advanced control strategies to enhance the performance of wind turbine blade angle systems. We compare two optimization algorithms: harmony search algorithm (HSA) and exponential distribution optimizer (EDO) for tuning proportional-integral-derivative (PID) controllers under various operating conditions, including normal operation and fault scenarios. The EDO algorithm demonstrates superior performance in optimizing blade angle control, leading to improved system stability and faster response times. Building on this, we further evaluate three controllers: PID, proportional-derivative-derivative, and adaptive proportional-integral (API) using the EDO algorithm. The API controller, with its adaptive gains, outperforms both PID and proportional double derivative (PD2) controllers, achieving smoother pitch angle adjustments and more stable active power output under varying wind conditions. The results highlight the API controller’s ability to maintain rated power levels with minimal oscillations, even during rapid wind speed changes and fault conditions. This study provides valuable insights into the optimization of wind turbine blade angle systems, offering a robust framework for improving power extraction efficiency and system reliability. The findings suggest that the combination of EDO optimization and API control represents a promising approach for enhancing wind turbine performance in dynamic environments.
1. Introduction
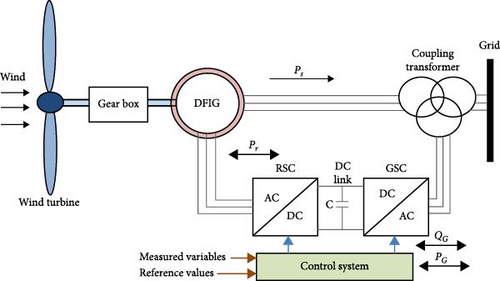
Renewable energy sources have become increasingly important in electricity generation due to their environmental benefits and cost-effectiveness. As a result, countries worldwide are focusing on addressing the challenges associated with these sources and developing optimal solutions. There are several forms of renewable energy, including solar energy, wind energy, photovoltaic energy, and hydroelectric energy. Among these, wind energy has gained significant traction in many countries due to its efficiency. While the initial capital cost for wind energy infrastructure is high, its operational costs are notably low, making it an attractive long-term investment. Wind turbines are primarily categorized into two types: fixed speed wind turbines (FSWTs) and variable speed wind turbines (VSWTs). VSWTs offer several advantages over FSWTs, including increased annual power production by 5%–10%, reduced mechanical stress, decreased power fluctuations, the ability to maintain a fixed tip-speed ratio, and operation over a wider range of wind speeds. These advantages make VSWTs more efficient and versatile in various wind conditions [1, 2]. VSWTs are commonly used in wind energy systems with various configurations. One particularly efficient configuration is the doubly-fed induction generator (DFIG). The DFIG has proven its effectiveness in wind energy applications due to several advantages: cost-effectiveness, low power losses, compact size, the ability to supply power to the grid at constant frequency and voltage despite variable rotor speeds, and decoupled control of active and reactive power. These characteristics make the DFIG configuration a popular choice in modern wind turbine designs, as it offers a balance of performance, efficiency, and economic viability [3, 4]. Figure 1 shows the constructions of the DFIG [5].
- •
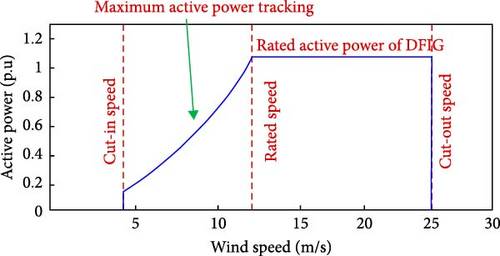
Region 1 (below cut-in speed): When the wind speed is below the cut-in speed, no power can be extracted.
- •
Region 2 (maximum power tracking): Once the wind speed exceeds the cut-in speed, the turbine enters the maximum power tracking region. Here, the blade angle control operates to extract the maximum possible power.
- •
Region 3 (above rated speed): When the wind speed surpasses the rated speed, the blade angle controller activates to maintain the extracted power at its rated value.
- •
Region 4 (above cut-out speed): If the wind speed exceeds the cut-out speed, the turbine ceases operation to protect itself from potentially damaging storm-level winds.
The wind profile varies with changing weather conditions. Within the optimal speed range (Regions 2 and 3), the wind turbine can effectively track and optimize power output. However, outside this range (Regions 1 and 4), the turbine either remains inactive or shuts down to ensure operational safety [7, 8]. Figure 2 illustrates the extracted power and the operating regions of the wind turbine system. These distinct operating regions play a crucial role in mitigating the impact of the intermittent nature of wind energy [9].
2. Literature Review
To maximize the power extracted from a wind turbine system, precise control of the blade angle is essential. Various controllers have been developed and applied to manage blade angles effectively. These controllers aim to regulate power output at rated values, regardless of fluctuations in wind speed. Over the years, researchers have explored and tested numerous types of controllers to achieve optimal performance, with the goal of identifying the most effective solution.
2.1. Control Techniques in the Literature
The proportional-integral-derivative (PID) controller is a classical control system known for its cost-effectiveness and simplicity. It consists of three main components, each serving a specific function: the proportional term (P) improves the system’s response to rapid changes in error; the integral term (I) reduces the steady-state error; and the derivative term (D) enhances the controller’s reaction to the rate of change of the error. PID controllers have demonstrated their effectiveness in FSWT applications. However, their performance in VSWTs is less satisfactory due to the system’s inherent nonlinearity. To address this limitation, researchers have begun exploring new techniques to enhance the performance of classical PID controllers in VSWT systems [13, 14].
One of the advanced techniques developed to enhance PID controller performance is the fractional-order PID (FOPID) controller, introduced in 1999. The FOPID controller offers several advantages, such as improved closed-loop response and reduced sensitivity to changes in system parameters. These characteristics make FOPID controllers particularly promising for complex systems like VSWTs. However, despite its benefits, the FOPID controller faces a significant challenge: it is difficult to design in the time domain. This complexity in design remains a key factor limiting its widespread adoption and implementation [15]. The sliding mode controller (SMC) is another advanced control technique used to enhance blade angle control in wind turbines. SMCs can be categorized into three main types: first-order, second-order, and third-order SMCs (FOSMC, SOSMC, and TOSMC, respectively). Among these, the TOSMC demonstrates particularly robust performance. This robustness is attributed to its ability to operate with minimal frequency variations, resulting in a smoother system response [16]. Another advanced variant of the PID controller is the PID-acceleration (PIDA) controller, which was first used in 2020. This controller enhances the conventional PID design by incorporating a double-derivative branch. The inclusion of this acceleration term improves the controller’s transient response in the frequency domain, allowing for faster and more accurate adjustments. As a result, the PIDA controller offers better performance in systems that require quick and precise control actions, such as VSWTs [17]. The summary of the previous literature of control strategies is shown in Table 1.
| Controller | Advantages | Limitations |
|---|---|---|
| PID (proportional-integral-derivative) [13, 14] | Simple structure and widely used, easy to implement, suitable for linear systems, and good performance in fixed-speed systems | Performance degrades with system nonlinearity, poor robustness to parameter variations, sensitive to gain selection, and not effective in variable-speed wind turbines |
| FOPID (fractional-order PID) [15] | Enhanced control flexibility via extra tuning parameters (λ, μ), better performance than classical PID, especially for fractional-order or nonlinear systems, and more robust to system parameter changes | Design and tuning are more complex, difficult to implement in time domain, and typically designed in frequency domain |
| SMC (sliding mode control) [16] | Highly robust to model uncertainties and external disturbances, excellent performance for nonlinear systems with time-varying parameters, and can handle parasitic dynamics and limited actuator bandwidth | High chattering effect (undesirable switching), requires accurate knowledge of system dynamics, and performance depends on the quality of wind data |
| PIDA (proportional-integral-derivative-acceleration) [17] | Improved transient response over PID, reduces oscillations with additional acceleration gain, effective in high-order systems with large overshoot and settling time, and superior performance when optimized with techniques like MPA (marine predator algorithm) | More complex structure than PID, requires optimization of additional parameters, and implementation more demanding due to added terms and filters |
2.2. Optimization Algorithms in the Literature
The harmony search algorithm (HSA) was an optimization technique, introduced by Geem [18] in 2001. It is a meta-heuristic algorithm inspired by the improvization process of jazz musicians. Another technique is the whale optimization algorithm (WOA), which mimics the bubble-net hunting behavior of humpback whales. First proposed by Mirjalili and Lewis [19] in 2016, the WOA has gained significant attention in the field of optimization due to its simplicity, flexibility, and strong global search capability. Comparatively, HSA has demonstrated superior performance in enhancing system stability, providing smoother responses than WOA. Another robust optimization technique is the turbulent flow water–based optimization algorithm, which has also proven its superiority over WOA in terms of stability and convergence efficiency [20]. In addition to these optimization algorithms, model predictive control (MPC) represents a fundamentally different approach to controller strategy. This method predicts the future behavior of the system and optimizes control inputs over a limited time horizon, continuously updating the control actions based on new measurements and predictions [21]. The summary of the previous optimization literature is shown in Table 2.
| Optimization technique | Advantages | Limitations |
|---|---|---|
| Turbulent flow water–based optimization algorithm [20] | Inspired by turbulent fluid dynamics to enhance global search ability, improves convergence speed and local optima avoidance, and high flexibility for nonlinear systems | Computationally intensive, less tested in diverse engineering applications, and may require significant parameter tuning |
| Harmony search algorithm (HSA) [18] | Simple concept inspired by musical harmony, and easy to implement and tune, and effective in many engineering optimization tasks | May converge slowly compared to more recent algorithms and performance is sensitive to initial parameter selection |
| Whale optimization algorithm (WOA) [19] | Mimics bubble-net hunting of humpback whales, excellent balance between exploration and exploitation, fewer parameters to tune, and performs well on benchmark and structural problems | Susceptible to premature convergence in some complex problems and might require more computational effort to fine-tune for specific cases |
| Model predictive control (MPC) [21] | Predicts future system behavior and optimizes control actions, handles multivariable systems and constraints effectively, and robust under moderate model mismatches | Relies heavily on accurate system modeling, high computational load for real-time applications, and performance degrades with model inaccuracies |
This paper examines the effectiveness of two optimization algorithms when applied to the blade angle PID controller: the exponential distribution optimizer (EDO) algorithm and the HSA. We evaluate these algorithms under three distinct conditions: fixed wind speed, practical (variable) wind speed, and faulty conditions. The superior optimization algorithm, as determined by our analysis, will then be utilized to compare the performance of three different controllers: PID controller, proportional double derivative (PD2) controller, and API controller. This comparative study aims to identify the most effective control strategy for blade angle regulation in wind turbine systems, potentially improving power extraction efficiency and system reliability across various operational scenarios.
The remainder of this paper is organized as follows: Section 3 details the implementation of the DFIG wind turbine model in MATLAB/Simulink, which serves as the foundation for the study. Section 4 introduces the EDO algorithm, explaining its mathematical formulation and application in optimizing blade angle control. Sections 5 and 6 describe the PD2 and API controllers, highlighting their design and advantages over traditional PID controllers. Section 7 presents the simulation results, comparing the performance of the HSA and EDO in tuning PID controllers under various operating conditions, including normal operation and fault scenarios. Section 8 extends the analysis by evaluating the performance of the PID, PD2, and API controllers optimized using the EDO algorithm. Finally, Section 9 concludes the paper, summarizing the key findings, discussing their implications, and suggesting future research directions.
3. DFIG Implementation on Simulink for Wind Turbine Model
A wind farm model, developed in MATLAB Simulink and illustrated in Figure 3, is utilized in this study. The model comprises six DFIG–based wind turbines, each rated at 1.5 MW, yielding a total generation capacity of 9 MW. The system accommodates variable wind speeds, with a rated speed of 12 m/s. The DFIGs are connected to a 120 kV and 60 Hz power grid via a 25 km transmission line and two step-down transformers. The grid-side transformer is rated at 120/25 kV and 47 MVA, while the turbine-side transformer is rated at 25/0.575 kV and 1.5 MVA. A 20-Watt load is connected at the junction between each wind turbine and its corresponding transformer.
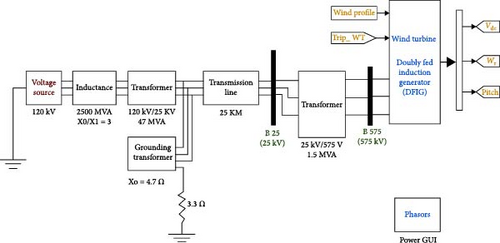
Each DFIG consists of a wound-rotor induction machine with the stator directly connected to the grid. The rotor is interfaced through a back-to-back AC/DC/AC IGBT–based PWM converter, modeled using voltage sources. The DC link is rated at 1200 V and is equipped with a 10,000 μF capacitor. The rotor-side converter regulates active and reactive power to enable maximum power point tracking (MPPT), while the grid-side converter maintains DC link voltage stability and ensures synchronization with the grid [22].
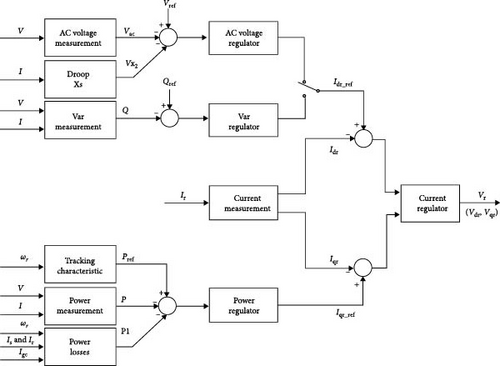
The grid-side converter control system, shown in Figure 4, measures the d and q components of the AC current as well as the DC voltage (Vdc). There is an outer control loop responsible for maintaining a stable DC voltage. This loop includes a DC voltage regulator, which generates a reference value for the d-axis current (Idgc_ref). This current controls the amount of active power delivered to the grid. An inner control loop manages the AC current and adjusts the output voltage (Vgc) of the grid-side converter to match the desired current values. Additionally, the current controller uses feedback to help predict the required output voltage. This improves both the speed and accuracy of the control system.
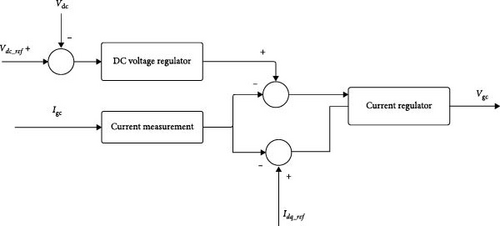
Figure 5 illustrates the components of the rotor-side converter control system, which manages the power output of a wind turbine. It measures the actual electrical power delivered to the grid and adds the estimated mechanical and electrical losses to obtain the total generated power. This total power is then compared to the reference power, which is determined based on a power tracking curve. To minimize the difference (or error) between the actual and reference power, a proportional-integral (PI) controller is used. The controller adjusts the system operation to bring the power output in line with the desired value [22].
- •
Between two phases (phase-to-phase),
- •
From a phase to the ground (phase-to-ground), or
- •
A combination of both.
For the simulation results discussed in this study, a line-to-ground fault is applied to Phase A as part of the fault analysis and the switching time for the fault is 20 s:25 s as in literature, for comparison’s sake.
4. EDO
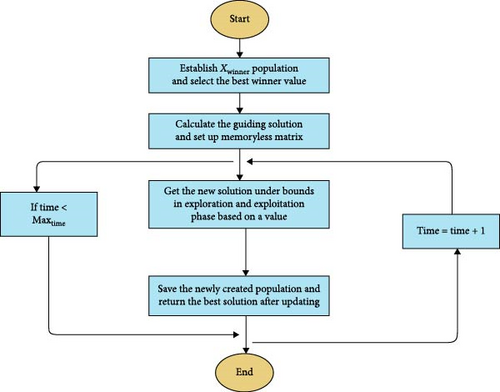
Figure 6 represented the flowchart of the EDO optimizer which shows the steps taken to solve the problem using EDO [23, 24]. In this paper an EDO optimizer is used with PID controller to enhance the performance of the system shown in Figure 3. For the cases under study, the EDO parameters are switch parameter (α) = 0.5 and population type (N) = 30.
5. PD2 Controller
The PD2 controller combines a proportional gain term (Kp) with two derivative gain terms (KD1 and KD2), as illustrated in Figure 7. Its design is similar to that of a PID controller, with the key difference being that the PD2 controller replaces the integral term of the PID with a second derivative term.
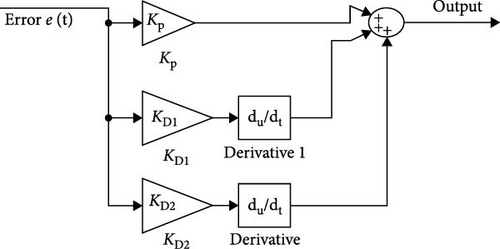
Compared to the PID controller, the PD2 controller offers a simpler design while achieving notable success in the optimization field. Its advantages include faster rise time, quicker settling time, and lower peak overshoot [25].
6. API Controller
The API controller’s output is determined by the proportional and integral components of the input error. This input error is calculated as the difference between the rated speed and the current rotor speed. Figure 8 illustrates the block diagram of the API controller. The relationship between the controller’s output and input error is expressed in Equation (16), where Ki is the integral gain, KP is the proportional gain, and the KC is a constant value [14, 26].

7. Simulation Results for Optimization Comparison
This section presents a comparison of simulation results obtained using two optimization algorithms (HSA and EDO) for initializing the PID controller. HSA is used as a benchmark, where Shawqran et al. [14] proved its superiority than conventional algorithms in the same application of the paper, while using EDO is due to its high exploration and exploitation rates. Four different case studies are examined:
Case Study 1: Represents a typical winter season scenario, simulating a random winter day under normal operating conditions.
Case Study 2: Focuses on normal operation with variable wind speed, in the absence of any faults.
Case Study 3: Investigates system performance under fault conditions, specifically a line-to-ground fault with constant wind speed.
Case Study 4: Explores fault conditions involving a line-to-ground fault with variable wind speed.
7.1. First Case: PID Controller, Normal Operation, Without Fault, and Winter Wind Speed for a Random Day With HSA and EDO Optimization
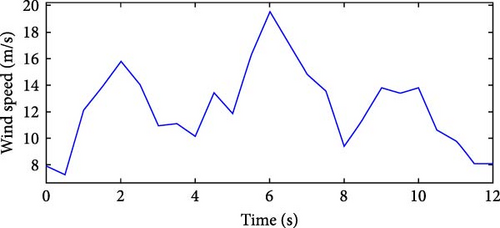
Figure 9 illustrates the wind speed variation over time for a randomly selected winter day, showing a rapid decrease from 19.6 to 9.5 m/s within 2 s. This wind speed profile is applied to the model presented in Figure 3. In this section, the impact of this wind variation on the power curve performance is analyzed using an optimized blade angle controller. The results obtained using the EDO algorithm are compared with those from the HSA algorithm. For EDO optimization, the trial-and-error parameter search range was set to ±60% of the corresponding values reported for the same wind profile using the HSA method, as detailed in [2]. The values of Kp, Ki, and Kd are shown in Table 3.
| Parameters | With optimized PID (HSA–based) | With optimized PID (EDO–based) |
|---|---|---|
| Kp | 68 | 108.8 |
| Ki | 13.7 | 8.331 |
| Kd | 72 | 115.2 |
Figure 10 compares the pitch angle responses of PID controllers optimized using the HSA and EDO techniques. The EDO–based controller demonstrates superior performance, as reflected in its higher pitch angle values and faster dynamic response. When the wind speed exceeds the rated value, the EDO-optimized controller adjusts the pitch angle more rapidly, enabling the system to return the captured energy to the rated level in less time than the HSA–based controller. Conversely, as shown in Figure 9, when the wind speed decreases between 10.5 and 12 s, the pitch angle value also decreases under the EDO-optimized controller, as illustrated in Figure 10. This reduction in pitch angle facilitates greater energy capture, allowing the system to reach its rated power more quickly.
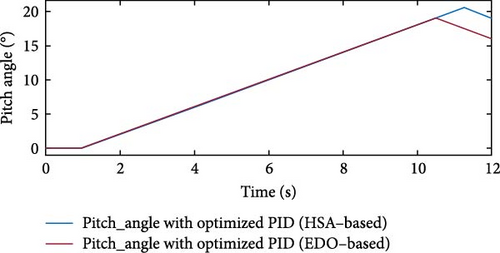
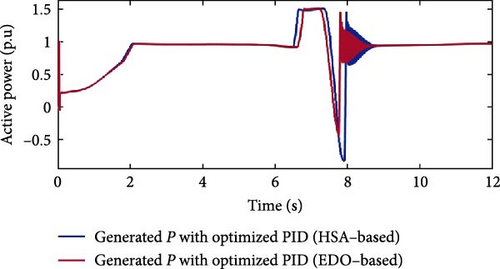
Figure 11 presents a comparison of the extracted active power performance curves using PID controllers optimized with the HSA and EDO techniques. Both optimization methods effectively prevent the active power from dropping below −1 p.u.; however, the EDO–based PID controller exhibits significantly lower oscillations. Specifically, the EDO–based optimization achieves a maximum undershoot of −0.46 p.u., compared to −0.83 p.u. for the HSA–based approach, indicating improved system protection. Although both controllers ultimately reach the rated power, the EDO-optimized PID controller demonstrates a shorter settling time, contributing to enhanced system stability and faster recovery following wind speed variations. Table 4 shows a summary of optimization comparison for Case Study 1. EDO optimization consistently achieves faster settling, better standard deviation and lower overshoot than HSA optimization.
| Optimization type | Settling time (s) | Maximum undershoot (p.u) | Standard deviation |
|---|---|---|---|
| EDO | 8.56 | −0.46 | 0.3714 |
| HSA | 8.92 | −0.83 | 0.4025 |
7.2. Second Case: PID Controller, Normal Operation, Without Fault, and Variable Wind Speed With HSA and EDO Optimization
In this section, a variable speed profile is applied to the system in the model presented in Figure 3 under normal operating conditions (no fault).
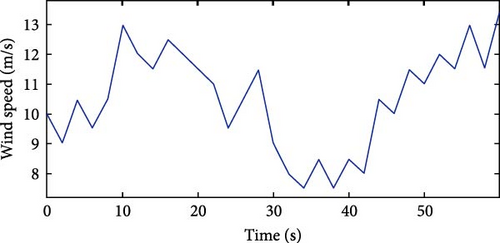
Figure 12 illustrates the wind speed profile, which varies significantly over time. The wind speed drops below the rated speed between 27 and 41 s, resulting in a reduction in the energy extracted by the blades. It exceeds the rated speed during two intervals: from 7.26 to 13.9 s and from 46 to 59.9 s. For the EDO optimization, the trial-and-error parameter ranges were set to ±60% of the results obtained using the HSA method for the same wind profile, as reported in [28]. The values of Kp, Ki, and Kd are shown in Table 5.
| Parameters | With optimized PID (HSA–based) | With optimized PID (EDO–based) |
|---|---|---|
| Kp | 172.4 | 103.44 |
| Ki | 3.2 | 1.92 |
| Kd | 67 | 40.2 |
Figure 13 compares the pitch angle curves of PID controllers optimized using EDO and HSA techniques. During the intervals from 7.26 to 13.9 s and 46 to 59.9 s, the wind speed shown in Figure 12 exceeds the rated speed. Both optimization methods respond to this, but the EDO–based PID demonstrates superior performance compared to the HSA–based PID. This is evident in Figure 13, where the pitch angle for the EDO-optimized PID is higher than that of the HSA-optimized PID between 16 and 20 s. The increased pitch angle allows the system to maintain the rated wind speed value for a longer duration after exceeding the rated threshold, indicating improved system stability. Conversely, both methods reduce the pitch angle to zero between 27 and 41 s to compensate for the significant drop in wind speed, thereby maximizing energy capture during this period.
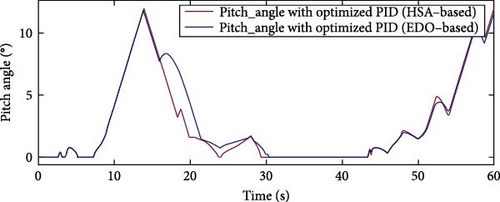
Figure 14 compares the extracted active power curves of PID controllers optimized using HSA and EDO techniques. The superior performance of the EDO–based PID controller over the HSA–based counterpart is particularly evident between 16 and 20 s, which aligns with the pitch angle behavior discussed earlier. During this period, although the wind speed exceeds the rated value, the EDO–based controller successfully maintains the active power at the rated level, resulting in reduced oscillations and a smoother response compared to the HSA–based controller. Both techniques exhibit similar performance between 27 and 41 s, when the wind speed is low, effectively maximizing the extractable energy under these conditions. Table 6 shows a summary of optimization comparison for Case Study 2, which proved the superiority of the EDO optimization over HSA optimization.
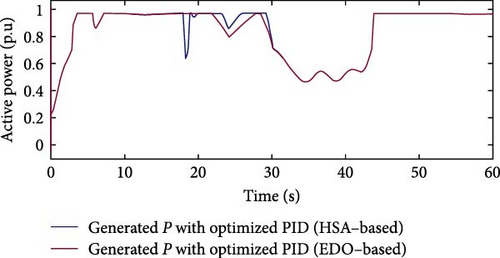
| Optimization type | Oscillations | Maximum undershoot (p.u) | Standard deviation |
|---|---|---|---|
| EDO | Low | 0.8 | 0.2268 |
| HSA | High | 0.64 | 0.2295 |
7.3. Third Case: PID Pitch Controller, Fault Condition, Line to Ground Fault at The Middle of Transmission Line, and Constant Wind Speed With HSA and EDO Optimization
In this section, a fixed wind speed profile of 15 m/s is applied to the system modeled in Figure 3. The system operates under fault conditions, specifically a line-to-ground fault at the middle of the transmission line. The fault occurs from 20 to 25 s. Figure 15 illustrates the wind speed profile, which remains constant at 15 m/s throughout the simulation. For the EDO optimization, the trial-and-error ranges were set to ±60% of the results presented for the same wind profile using HSA, as reported in [28]. The values of Kp, Ki, and Kd are shown in Table 7.
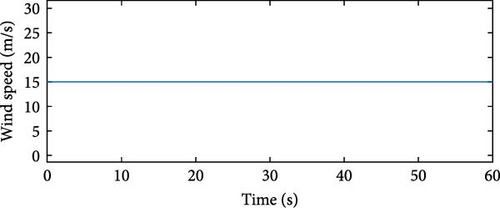
| Parameters | With optimized PID (HSA–based) | With optimized PID (EDO–based) |
|---|---|---|
| Kp | 1804 | 1082.4 |
| Ki | 62 | 37.2 |
| Kd | 5249 | 3149.4 |
Figure 16 shows the pitch angle curves for PID controllers optimized using EDO–based and HSA–based methods. When a fault occurs between 20 and 25 s, both optimization techniques increase the pitch angle, enabling the wind turbine to remain operational for a longer duration. This response supports wind farm operators in managing system faults while complying with grid code requirements. During this interval, the pitch angle values achieved by the EDO–based PID controller are slightly higher than those of the HSA–based controller, contributing to marginally improved system stability.
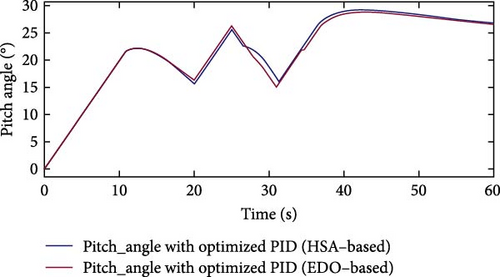
Figure 17 compares the extracted active power performance curves of HSA–based and EDO–based PID controllers. The EDO–based PID controller reaches its rated value of 1 p.u. at 30.8 s, overcoming blade inertia and mechanical losses more rapidly. In contrast, the HSA–based PID controller achieves the rated value at 31.4 s. This indicates that the system utilizing the EDO–based controller recovers more quickly from fault conditions than the HSA–based system.
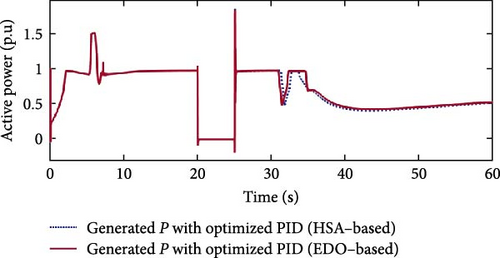
Table 8 presents a summary of the optimization performance comparison for Case Study 3, highlighting the superiority of EDO optimization over HSA optimization.
| Optimization type | Settling time (s) | Maximum undershoot (p.u) | Standard deviation |
|---|---|---|---|
| EDO | 30.8 | 0.476 | 0.3461 |
| HSA | 31.4 | 0.482 | 0.3498 |
7.4. Fourth Case: PID Pitch Controller, Fault Condition, Line to Ground Fault at The Middle of Transmission Line, and Variable Wind Speed With HSA and EDO Optimization
In this section, a variable wind speed profile of 15 m/s is applied to the system model shown in Figure 3. A line-to-ground fault occurs at the midpoint of the transmission line, causing the system to experience a fault condition. This fault lasts from 20 to 25 s. For the EDO, the optimization ranges used in the trial-and-error process are set to ±60% of the results presented for the same wind profile using the HSA, as described in [28]. The values of Kp, Ki, and Kd are presented in Table 9.
| Parameters | With optimized PID (HSA–based) | With optimized PID (EDO–based) |
|---|---|---|
| Kp | 389.6 | 623.36 |
| Ki | 175.5 | 280.8 |
| Kd | 127 | 147.55 |
Figure 18 depicts the wind speed profile, which features an overrated region between 7.26 and 13.9 s and 46 and 59.9 s, as well as an underrated region between 27 and 41 s. The underrated region results in a transition to cut-off mode due to low extracted power.
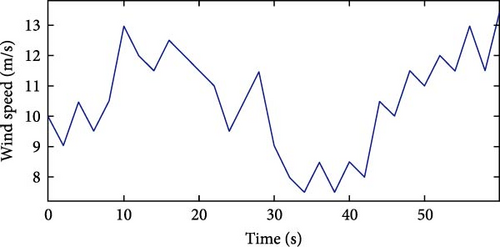
Figure 19 illustrates that when a fault occurs from 20 to 25 s, both optimization techniques (EDO and HSA) increase the pitch angle. However, the EDO optimization maintains a higher pitch angle value for an extended period after the fault occurrence. Specifically, the EDO optimization sustains an elevated pitch angle until 34.6 s, while the HSA optimization’s pitch angle returns to zero at 31.4 s.
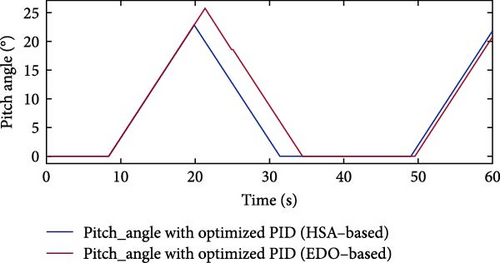
Figure 20 demonstrates the effect of maintaining the pitch angle on the active power curves. The power curve optimized with EDO exhibits lower oscillations while recovering to its rated value compared to the HSA-optimized curve after fault clearance. This is attributed to the prolonged maintenance of the pitch angle value, as mentioned earlier. However, it is important to note that the both power curves drop to zero during the fault period. The system regains efficient operation after the fault, as the wind speed becomes underrated from 27 to 41 s. Consequently, the pitch angle decreases to zero after recovery from the fault disturbance, allowing for increased energy extraction from the system. Both optimizations settle the rated value at same time.
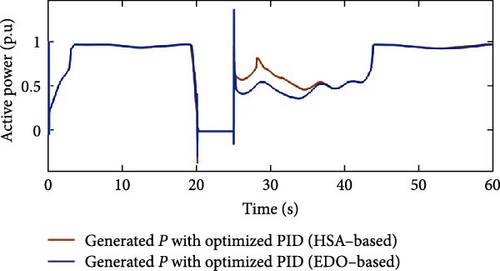
Table 10 presents a summary of the optimization performance comparison for Case Study 4, highlighting the superiority of EDO optimization over HSA optimization after the fault clearance. Comparing these different case studies, the EDO optimization technique outperforms HSA due to faster response to wind speed variations.
| Optimization type | Settling time (s) | Standard deviation | Oscillation after the fault clearance |
|---|---|---|---|
| EDO | 37 | 0.3499 | Low |
| HSA | 37 | 0.3481 | High |
8. Simulation Results for Controllers Comparison
This section presents comparative simulation results for three controllers (PID, API, and PD2) tuned by the EDO algorithm, which emerged as the superior optimization technique from the initial case studies. The PID is focused as it is a robust benchmark controller, while the PD2 as a smoother response due to its double derivative term, finally the API controller is focused due to its auto tune capability. The EDO algorithm is used to tune the PID and PD2 controllers and to initialize the API controller. Four distinct case studies are presented to evaluate the effect on power performance. The first case studies are a typical winter season under normal operating conditions. The second, third, and fourth case studies are normal operation without fault, using a specific wind speed profile
8.1. First Case: Normal Operation, Without Fault, and Winter Wind Speed for a Random Day
Figure 21 illustrates the wind speed over time for a random winter day, showing speed variations from 19.6 to 9.5 m/s within 2 s. This wind speed profile is applied to the model in Figure 3. Table 11 presents the parameter values for the three controllers tuned by EDO optimization.
| Controller type | Parameters value | ||
|---|---|---|---|
| PID controller | Kp = 108.8 | Ki = 8.33 | Kd = 115.2 |
| PD2 controller | Kp = 108.8 | KD1 = 5.48 | KD2 = 107.544 |
| API controller | KC = 18.755 | K1 = 105.34 | K2 = 1287.71 |
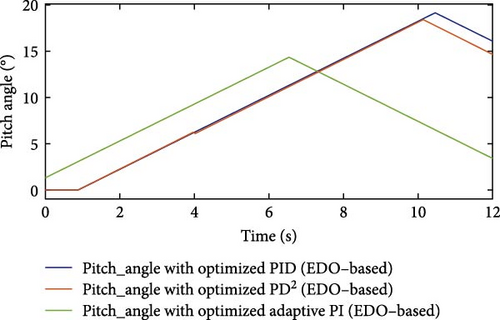
Figure 22 illustrates the pitch angle curves of the three controllers tuned using EDO optimization. Among them, the API controller demonstrates a smoother pitch angle response during wind speed variations compared to the PD2 and PID controllers. This distinction is further supported by Figure 23, which shows the extracted active power curves for the three EDO-optimized controllers.
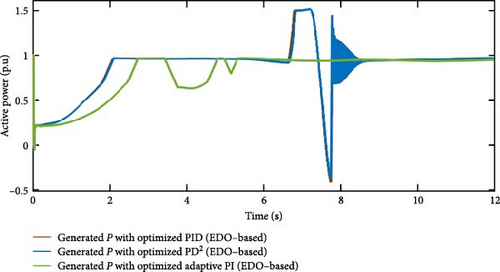
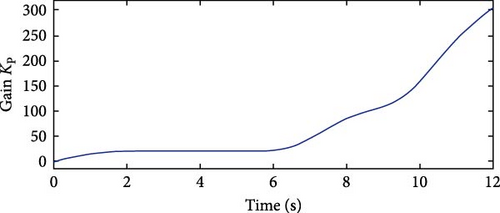
The API controller’s extracted power curve exhibits fewer ripples compared to those of the PD2 and PID controllers. It reaches the rated power value more quickly at 5.3 s and maintains it consistently despite wind speed variations. In contrast, both the PD2 and PID controllers achieve the rated power level at 8.7 s, indicating a slower response. Additionally, their power curves display noticeable oscillations. The PD2 controller experiences a maximum undershoot of −0.37 p.u. at 7.73 s, while the PID controller exhibits a deeper maximum undershoot of −0.47 p.u. at 7.76 s, suggesting that the PD2 controller performs better than the PID in terms of stability. This comparison highlights the superior stability of the API controller, characterized by minimal oscillations and faster response. Furthermore, it confirms that the PD2 controller offers improved performance over the PID controller. The API controller’s advantages over the PD2 and PID controllers are due to their time-varying gains KP and Ki, which provide quick responses to wind profile variations. The time variations of gains KP and Ki are shown in Figures 24 and 25, respectively.

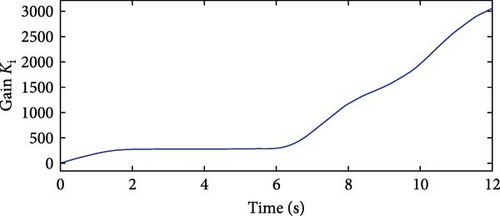
Table 12 presents a summary of the optimization performance comparison for Case Study 1, highlighting the superiority of API controller over PID and PD2 controllers.
| Controller type | Settling time (s) | Standard deviation | Maximum undershoot (p.u) |
|---|---|---|---|
| PID | 8.7 | 0.3865 | −0.47 |
| PD2 | 8.7 | 0.3739 | −0.37 |
| API | 5.3 | 0.3232 | 0.63 |
8.2. Second Case: Normal Operation, Without Fault, and Second Wind Speed Profile
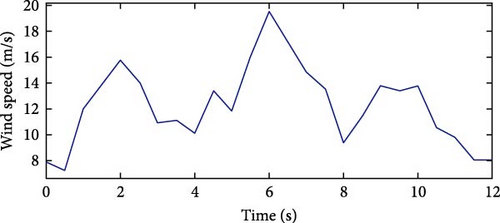
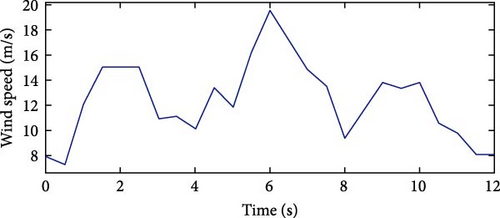
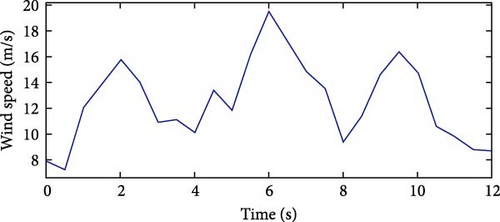
Figure 26 illustrates the wind speed profile for the second normal case study. The wind speed curve starts at a minimum value of 7.3 m/s, increases to a peak of 19.6 m/s at 6 s, and then, decreases again to 7.5 m/s. This wind speed profile is applied to the model presented in Figure 3. Table 13 presents the parameter values for the three controllers tuned by EDO optimization.
| Controller type | Parameters value | ||
|---|---|---|---|
| PID controller | Kp = 108.8 | Ki = 10.064 | Kd = 115.2 |
| PD2 controller | Kp = 108.8 | KD1 = 14.248 | KD2 = 115.2 |
| API controller | KC = 18.675 | K1 = 172.63 | K2 = 580.818 |
Figure 27 displays the pitch angle curves of the three controllers for this second normal case study. The API controller’s pitch angle response exhibits a smoother curve compared to the PD2 and PID controllers throughout the wind speed variations.
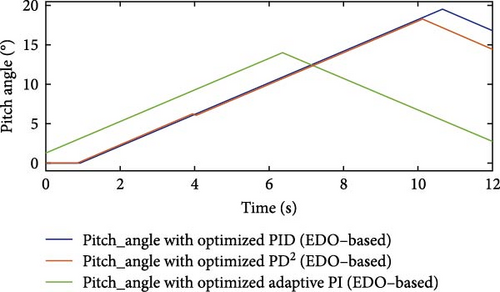
Figure 28 presents the extracted active power curves of the three EDO-optimized controllers for the second normal case study. These curves reflect the influence of each controller’s pitch angle response. The API controller exhibits the least oscillation in its power curve, maintaining stability despite wind speed variations. In contrast, the power curves of both the PD2 and PID controllers show noticeable ripples and oscillations. The API controller reaches the rated power value fastest, settling at 5.3 s and maintaining this value consistently. The PD2 controller achieves the rated power at 8.77 s, while the PID controller reaches it at 8.9 s. In terms of undershoot performance, the PD2 controller experiences a peak undershoot of −0.53 p.u. with relatively low ripple, whereas the PID controller shows a larger undershoot peak of −0.79 p.u.
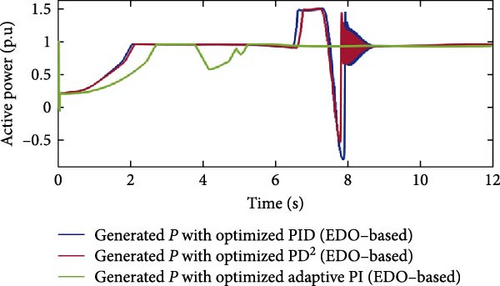
This comparison highlights the superior stability and faster response of the API controller’s power curve compared to those of the PD2 and PID controllers. It also indicates that the PD2 controller outperforms the PID controller in terms of active power tracking and stability. The API controller’s advantages stem from its time-varying gains KP and Ki, which enable quick responses to wind profile variations. The time variation of gains KP and Ki is are shown in Figures 29 and 30, respectively.
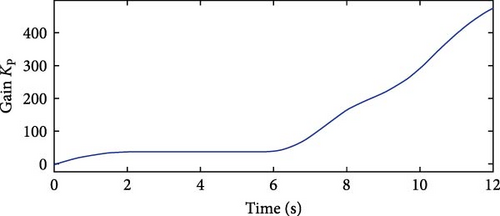
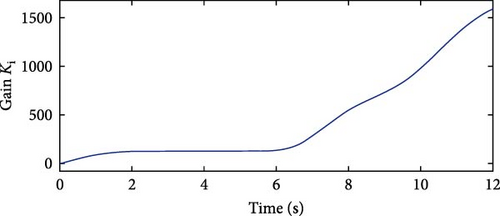
Table 14 presents a summary of the optimization performance comparison for Case Study 2, highlighting the superiority of API controller over PID and PD2 controller.
| Controller type | Settling time (s) | Standard deviation | Maximum undershoot (p.u) |
|---|---|---|---|
| PID | 8.9 | 0.4071 | −0.79 |
| PD2 | 8.77 | 0.366 | −0.53 |
| API | 5.3 | 0.3213 | 0.58 |
8.3. Third Case: Normal Operation, Without Fault, and Third Wind Speed Profile
Figure 31 illustrates the wind speed over time for the third normal case. This wind speed profile was applied to the model shown in Figure 3. The parameters for the three controllers, optimized using EDO, are presented in Table 15.
| Controller type | Parameters value | ||
|---|---|---|---|
| PID controller | Kp = 108.8 | Ki = 5.509 | Kd = 115.2 |
| PD2 controller | Kp = 106.568 | KD1 = 8.22 | KD2 = 99.22 |
| API controller | KC = 21.353 | K1 = 93.15 | K2 = 709.247 |
Figure 32 displays the pitch angle curves of these three controllers for the third normal case study. The API controller exhibits a smoother pitch angle response compared to the PD2 and PID controllers.
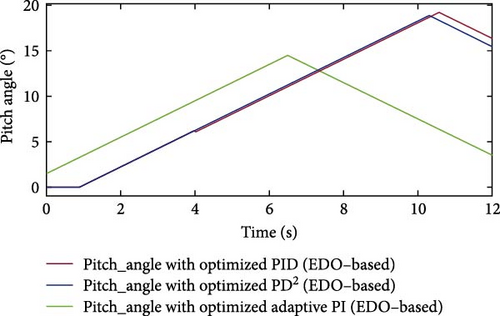
Figure 33 shows the extracted active power curves for the three controllers optimized using EDO in the third normal case study. The API controller exhibits the smoothest power curve with minimal ripples, despite variations in wind speed. In contrast, the PD2 and PID controllers display noticeable oscillations in their power outputs.
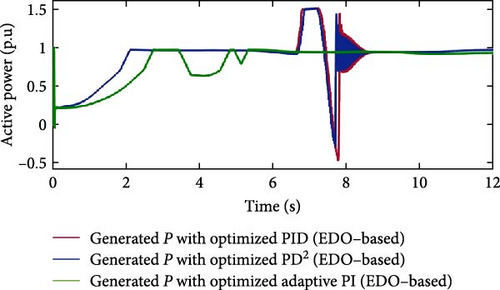
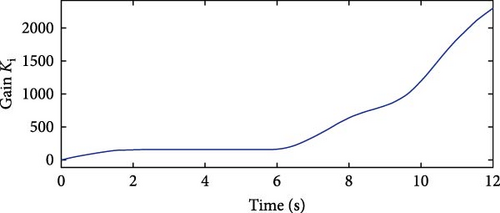
The API controller reaches the rated power level the fastest, settling at 5.33 s and maintaining it consistently. The PD2 controller settles at 8.73 s, while the PID controller reaches rated power slightly later, at 8.8 s. In terms of undershoot performance, the PD2 controller outperforms the PID controller. The PD2 controller experiences a maximum undershoot of −0.3 p.u. at 7.69 s, whereas the PID controller exhibits a deeper undershoot of −0.46 p.u. at 7.77 s. Overall, this comparison confirms that the API controller delivers the smoothest and most stable power response. Furthermore, the PD2 controller demonstrates better performance than the PID controller. The API controller’s advantages stem from its time-varying gains KP and Ki, which allow for quick responses to wind profile changes. Figures 34 and 35 illustrate the time variation of gains KP and Ki, respectively. Table 16 presents a summary of the optimization performance comparison for Case Study 2, highlighting the superiority of API controller over PID and PD2 controllers.
| Controller type | Settling time (s) | Standard deviation | Maximum undershoot (p.u) |
|---|---|---|---|
| PID | 8.8 | 0.3815 | −0.46 |
| PD2 | 8.73 | 0.3724 | −0.3 |
| API | 5.33 | 0.3234 | 0.63 |
8.4. Fourth Case: Normal Operation, Without Fault, and Fourth Wind Speed Profile
Figure 36 illustrates the wind speed profile over time for the fourth normal case. This wind speed data was applied to the model presented in Figure 3. Table 17 displays the parameter values for the three controllers, optimized using EDO.

| Controller type | Parameters value | ||
|---|---|---|---|
| PID controller | Kp = 76.815 | Ki = 5.48 | Kd = 81.333 |
| PD2 controller | Kp = 88.644 | KD1 = 21.92 | KD2 = 64.178 |
| API controller | KC = 10.026 | K1 = 93.15 | K2 = 1308.064 |
Figure 37 depicts the pitch angle curves of the three controllers for the fourth normal case study. The API controller exhibits a smoother pitch angle response compared to the PID and PD2 controllers throughout the wind variations.
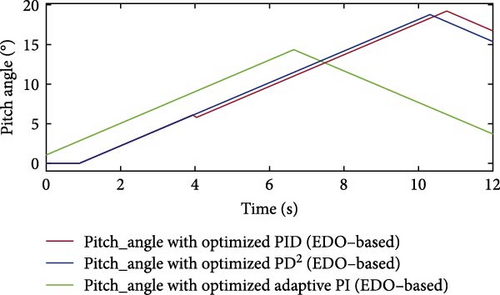
Figure 38 presents the extracted active power curves of the three controllers optimized using EDO for the fourth normal case study. The API controller demonstrates superior performance, characterized by minimal oscillations and the fastest settling time reaching rated power at 5.4 s. This is significantly quicker than the PD2 and PID controllers, which settle at 8.83 s and 9.1 s, respectively. While both the PD2 and PID controllers exhibit oscillatory behavior in their power curves, the PD2 controller shows a lower maximum undershoot. Specifically, the PD2 controller reaches an undershoot peak of −1.0 p.u. at 7.9 s, compared to the PID controller’s more pronounced undershoot of −1.26 p.u. at 8.04 s. This comparison underscores the superior stability and responsiveness of the API controller in terms of active power regulation. It also indicates that the PD2 controller outperforms the PID controller. The API controller’s advantages stem from its time-varying gains KP and Ki, enabling quick responses to wind profile variations. Figures 39 and 40 illustrate the time variation of gains KP and Ki, respectively.
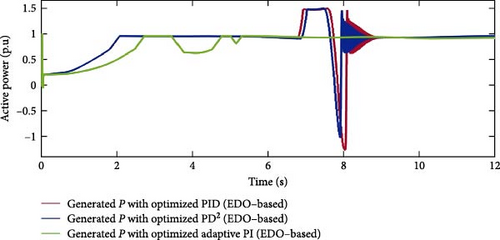
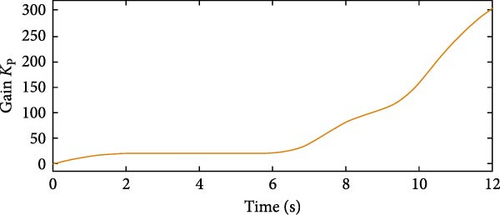
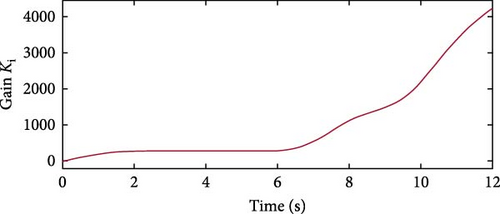
Table 18 presents a summary of the optimization performance comparison for Case Study 4, highlighting the superiority of API controller over PID and PD2 controllers.
| Controller type | Settling time (s) | Standard deviation | Maximum undershoot (p.u) |
|---|---|---|---|
| PID | 9.1 | 0.4431 | −1.26 |
| PD2 | 8.83 | 0.3992 | −1 |
| API | 5.4 | 0.3111 | 0.64 |
9. Conclusion
This paper studies different control strategies to enhance the performance of the wind turbine blade angle system. A MATLAB/Simulink model is used to study the effects of wind speed variability on wind turbine performance. Additionally, EDO optimization is used for tuning the blade angle controller parameters and is compared with HSA optimization to verify its effectiveness. The EDO optimization method is selected to tune the PID blade angle controller due to its superior exploration and exploitation capabilities. The results demonstrate the efficiency of EDO techniques over HSA techniques. Both techniques show that blade angle control affects the active power curve, preventing it from falling to zero. This helps wind farm operators ride through faults without disconnecting from the grid. However, the pitch angle curve with EDO optimization is smoother than with HSA, allowing the system to remain grid-connected for longer periods with low oscillations and to quickly ride through faults, despite sharp variations in wind speed.
The paper also compares the behavior of three different controllers (PID, PD2, and API) tuned by the EDO optimization technique. Results show the superiority of the API controller over PD2 and PID controllers. The pitch angle curve of the API controller tuned by EDO is smoother than those of the other two controllers, helping to maintain the extracted active power at the rated value despite wind variations. Furthermore, the results demonstrate the advantage of the PD2 controller over the PID controller when tuned by EDO. The PD2 controller presents a low oscillation curve and a lower maximum undershoot value.
Nomenclature
-
- API:
-
- Adaptive proportional-integral controller
-
- DFIG:
-
- Doubly-fed induction generator
-
- EDO:
-
- Exponential distribution optimizer
-
- HSA:
-
- Harmony search algorithm
-
- PD2:
-
- Proportional-double-derivative controller
-
- PID:
-
- Proportional-integral-derivative controller
-
- PI:
-
- Proportional-integral controller
-
- PIDA:
-
- Proportional-integral-derivative-acceleration controller
-
- SMC:
-
- Sliding mode controller
-
- SOSMC:
-
- Second-order sliding mode controller
-
- TOSMC:
-
- Third-order sliding mode controller
-
- SMC:
-
- Sliding mode controller
-
- VSWT:
-
- Variable speed wind turbines
-
- WOA:
-
- Whale optimization algorithm
-
- WT:
-
- Wind turbine.
Conflicts of Interest
The authors declare no conflicts of interest.
Funding
This research was funded by the Deanship of Scientific Research at Northern Border University, Arar, KSA, for funding this research (through the project number NBU-FPEJ-2025-2124-03).
Acknowledgments
The authors extend their appreciation to the Deanship of Scientific Research at Northern Border University, Arar, KSA, for funding this research (through the project number NBU-FPEJ-2025-2124-03).
Open Research
Data Availability Statement
The data that support the findings of this study are available from the corresponding author upon reasonable request.


