Designing a Revenue Forecast Scheme for Analog Ensemble Method Applied Solar PV Forecasting in South Korea
Abstract
Power companies have found that solar irradiance forecasting is a reliable method for anticipating and preparing for the intermittent nature of renewable energy sources (RESs). However, when the percentage of RESs in the energy mix rises, there is a negative correlation between forecasting accuracy and process error, which could impact not only the grid but also the whole RES’s economic sustainability. In order to tackle this problem, this paper examines the economic implications of employing the Analog Ensemble (AnEn) forecasting model within Korea’s solar energy sector. The levelized cost of energy (LCOE) model and the revenue prediction model are applied to assess the efficacy of the AnEn. The proposed revenue scheme scheme was initiated on a 1 MW photovoltaic (PV) ground-type power plant deployed in the mainland of South Korea. Various methods have been examined to assess the financial benefit of utilizing the AnEn, such as forecast verification and LCOE and revenue forecast scheme. Key findings reveal that the AnEn model consistently outperforms traditional models in terms of accuracy, particularly during critical solar peak months. This improved accuracy translates into more reliable predictions of solar irradiance, essential for minimizing overestimations and supporting realistic financial planning. Furthermore, the paper explores the economic incentives implemented by the Korean government to encourage precision in energy forecasting, including a structured incentive scheme tied to forecast accuracy.
1. Introduction
The escalating global demand for energy presents a formidable challenge, particularly as conventional, exhaustible resources raise concerns about sustainability. According to the Statistical Review of World Energy, there has been a discernible surge in the demand for renewable energy, marked by a notable increase of 10.97% during the transition from 2021 to 2022. This surge in demand has consequently resulted in a noteworthy contribution of 13.78% to the overall global energy composition [1]. The impetus behind this transformative shift toward renewable energy is intricately linked to the elevated costs associated with fossil fuels and conventional electricity [2]. The escalating economic results stemming from the heightened prices of fossil fuels and electricity have instigated a strategic pivot toward renewable energy sources (RESs), reflecting a rational response to economic necessities and developing a sustainable trajectory in the global energy paradigm [3, 4]. In light of this, the pivotal role of RESs as a viable alternative becomes increasingly evident. Nonetheless, the inherent inconsistency in the availability of renewable resources poses a significant challenge for power producers (PPs) striving to meet the expanding energy requirements [5, 6]. To address this challenge, various methods have been introduced to mitigate the variability associated with renewable resources. Among these methods, forecasting emerges as a preeminent and scientifically rigorous approach, involving the prediction of future resource availability [7–9]. By leveraging advanced modeling techniques, data analytics, and meteorological insights, forecasting provides a robust tool for PPs to anticipate and plan for the intermittent nature of renewable resources. This strategic foresight is crucial for optimizing energy production, enhancing grid reliability, and ultimately fostering the sustainable integration of renewable energy into the global energy landscape.
South Korea has set a long-term objective to substantially diminish greenhouse gas emissions, with a key target being the enhancement of reliability in RESs [10]. As of 2022, the installed capacity of RES stands at approximately 10.5%, and the nation aims to elevate this figure to 20.0% by the year 2030 [11]. Notably, increasing the penetration of photovoltaic (PV) systems is a central aspect of this strategy. However, a delicate balance must be maintained, as reducing exhaustible resources, especially coal power plants, poses challenges to the energy mix [12]. The shutdown of coal power plants can lead to imbalances in power supply and demand, underscoring the critical role of accurate prediction systems for RES [13]. Solar forecasting has proven to be a dependable tool. Forecasting involves the application of predictive models and estimation techniques to anticipate solar energy generation [14]. This process relies on in-depth analyses of meteorological, environmental, and solar radiation data. In South Korea, a diverse array of forecasting models is employed to predict RESs. Specifically, nowcasting [15–17] short-term forecasting [18, 19] and long-term forecasting [20, 21] are prevalent approaches within the realm of solar PV forecasting. These methods collectively contribute to the accurate anticipation of solar energy outcomes, ensuring effective and efficient utilization of renewable resources.
With the increase of RES, in the energy mix, adversely in need of the accuracy in the forecasting as forecasting errors most likely increase in the process affecting not just the grid but the economic viability of the entire RES. To address this phenomenon, several approaches have been introduced to reduce the uncertainty in the forecasting including postprocessing [22–24]. Postprocessing techniques refer to a set of technique and methodologies applied to refine and enhance the accuracy of predictions generated by forecasting models [25]. After the initial forecasts are generated, postprocessing methods aim to correct biases, reduce uncertainty, and improve the reliability of predictions.
An analog ensemble (AnEn), within the context of forecasting, constitutes a methodology rooted in the identification and selection of historical events or situations analogous to the present forecast scenario [26, 27]. This approach relies on the assumption that historical instances exhibiting similarities in atmospheric or environmental conditions are indicative of potential future outcomes. Also, AnEn methods involve the systematic comparison of the current state of the atmosphere or system with past states, identifying historical instances with comparable patterns, and utilizing the associated observed outcomes to construct an ensemble of potential future scenarios. The AnEn technique thus leverages historical data to provide probabilistic insights into the future, acknowledging the intrinsic complexity of atmospheric processes and enhancing forecast reliability through the integration of observed analogs. Later in the methodology section, the AnEn is introduced as one of models for comparison in identifying the revenue model scheme for forecasting in South Korea.
South Korea has implemented various policies to enhance its energy landscape, notably the renewable portfolio standards (RPSs) [28]. This system mandates that a specific portion of the generated power supply must come from RESs. The RPS plays a pivotal role in boosting generation from renewable sources, making options such as PV systems increasingly comparable to commercially established wind resources. To encourage renewable energy adoption, the issuance of renewable energy certificates (RECs) imposes obligatory responses on PPs. These certificates are contingent on the weighted renewable energy share (MWh) and its associated energy sources, contributing to a more sustainable and diversified energy portfolio [29].
Solar forecasting becomes more valuable as we reduce uncertainties in the predictions. Solar PVs stand out as the most cost-effective and reliable energy source [30, 31]. The solar forecasting industry benefits from the widespread adoption and commercialization of solar PV systems, harnessing clean, and limitless energy sources. The main challenge with solar PV systems is their unpredictability, which solar forecasting aims to address by minimizing uncertainties and enhancing plant production. Given the Korean government’s proactive measures to increase renewable resources by 2030, the solar forecasting business is anticipated to grow significantly [32]. Given the promotion of RES, the forecasting business is another factor since renewable energy is restricted to producing more than 65% of the demanded electricity [33]. The erratic behavior of renewable energy is factored in by meteorological and geographical characteristics, including climate change, which tends to hinder the capacity of RES as reliable sources [34]. The Korean government’s solution encourages PPs to invest in RES by eliminating penalties for forecasting errors [35]. Although it is a factor, reliability in forecasting is considered. Forecasting economics was also introduced in studies across the world to check the benefits of forecasting and its effect on capital recovery. Applying this concept in Korea, several works of literature also focused on the advantages of solar forecasting, including revenue stream, profitability analysis, and recovery [36–38]. While these concepts have already been introduced, the paper focused on the revenue model scheme for forecasting using AnEn as a postprocessing technique. This delimits the recovery scheme for capital investment in the RES and thus focuses more on the economic forecasting side of solar energy systems.
The remainder of this paper is structured as follows: The data structure, the AnEn, the theoretical, and the methodological aspects of the revenue model scheme are all presented in Section 2. The validation of the AnEn model’s suitability for the two forecasting models in use in Korea is also provided. In Section 3, forecasting models and the AnEn model are used to assess the forecast verification outcomes. The outcomes of the revenue model scheme’s effectiveness and upcoming work are covered in Section 4. The paper is summarized in Section 5 with a conclusion.
2. Methodology
2.1. Data
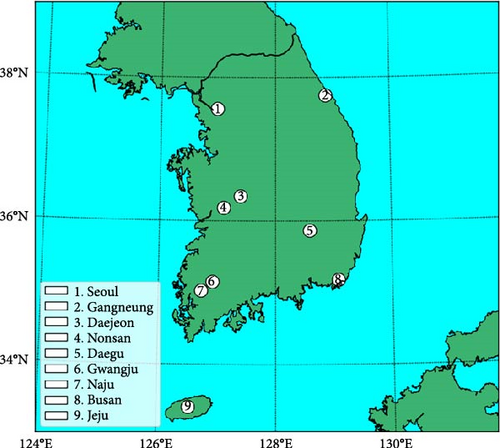
A diverse dataset was collected over a dynamic period from October 2021 to August 2023. This dataset encapsulates a myriad of variables germane to our research pursuits, ranging from demographic information to environmental parameters and intricate behavioral metrics. Our primary data source was the solar irradiance data derived from the University of Arizona Solar Irradiance Based on Satellite–Korea Institute of Energy Research (UASIBS–KIER) model [39], focusing specifically on the global horizontal irradiance (GHI). For the application of AnEn, a sophisticated approach in our methodology, we employed two forecasting models initiated at 03 Korean Standard Time (KST) on the same day: (1) the model from the Unified Model Local Data Assimilation and Prediction System (UMLDAPS); and (2) Weather Research and Forecast Model Version 3.8.1 operated by the KIER-Solar WRF. To ensure the robustness of our ensemble, we utilized a historical dataset spanning 365 days, recognizing this period as optimal for AnEn implementation [40, 41]. Figure 1 delineates the strategic placement of nine ground observing stations across Korea, including key location such as Busan (35.18°N, 129.08°E), Daegu (35.87°N, 128.59°E), Daejeon (36.35°N, 127.38°E), Gangneung (37.75°N, 128.87°E), Gwangju (35.15°N, 126.92°E), Jeju (33.41°N, 126.52°E), Naju (35.03°N, 126.72°), Nonsan (36.19°N, 127.10°), and Seoul (37.57°N, 126.98°E).
2.2. AnEn Model
2.3. Forecast Verification
The forecast, observation, and number of samples are denoted by the letters yp, yo, and N, respectively. Additionally, the skill score validates the comparison between the observational data and the forecast/AnEn.
2.4. Revenue Scheme
The policy landscape for renewable energy startups offers an array of economic incentives, setting it apart as a unique feature of the Korean government’s approach. Unlike many other countries, Korea implements a system where penalties for inaccuracies in energy forecasting are waived, presenting an attractive opportunity for PPs to embrace RES with confidence. This favorable environment encourages a more aggressive adoption of RES. Table 1 provides a concise summary of forecast incentives, serving as a foundational reference for integrating AnEn forecasting into the UMLDAPS/KIER-Solar WRF dataset. With an emphasis on accuracy, forecasts exhibiting a modest error ratio of 6%–8% are eligible for a unit incentive of 3 won/kilowatt-hour (kWh). Beyond this threshold, forecasts with error ratios surpassing 6% are entitled to a higher incentive of 4 won/kWh. This structured approach incentivizes precision in forecasting methods, encouraging stakeholders to prioritize accuracy in their energy projections.
| Incentives (KRW/kWh) | Range of forecast error ration |
|---|---|
| 3 | 6%–8% |
| 4 | ≤6% |
2.4.1. Case Study
Understanding the impact of the application of the revenue scheme model, a case study is introduced. Applying the revenue forecast model and the LCOE model to evaluate the effectiveness of AnEn in solar irradiance forecasting.
The proposed revenue forecast model scheme was initiated on a 1 MW PV ground-type power plant deployed in the mainland of South Korea. The key assumptions in 2023 for optimization model with the plant are listed in Table 2.
| Category | Value |
|---|---|
| Installation cost | 12.93 million Won |
| Annual O&M | 20.8 Won/kW/year |
| Average equipment utilization rate | 15.38% |
| Discount rate | 4.5% |
| Debt ratio | 80% |
| Interest rate | 4.6%/year |
| Inflation rate | 1.6% |
| Corporate tax rate | Based on net income |
| Economic life | 20 years |
| Performance degradation rate | 0.45% |
| REC weight | 1.0 |
| Grid connection costs | 27.83 million Won |
| Land cost at 5% baseline | 585 million for 2.5 acres of land |
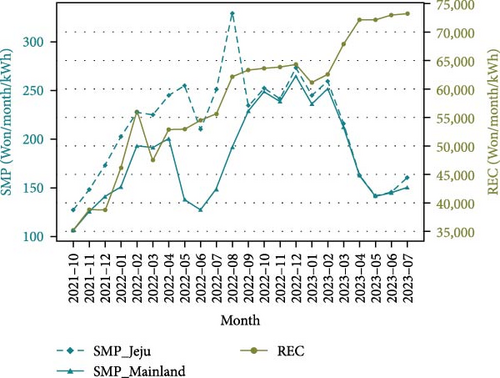
Economic assumptions for calculating solar PV LCOE are determined based on recent performance. Grid-specific SMP and REC prices are to be applied based on the available data on the Korea Electric Power Statistics Information System (EPSIS). Figure 2 shows the actual SMP and REC profile resulted of a solar-fixed price contract competitive bidding. Figure 2 also shows average SMP per month while REC is the monthly spot market price. Grid-connected costs are calculated based on Korea Electric Power Corporation’s (KEPCO) standard facility burden rate, comprising basic facility and distance facility cost. The grid connection cost for a ground-mounted 1 MW solar power system is approximately the base cost and the distance at 500 m plus 10% value-added tax.
3. Analysis
3.1. Forecast Verification
In order to verify that using the AnEn is effective, a forecast verification is done. The disparity between the residual analysis findings for the KIER-Solar WRF and AnEn models is depicted in Figure 3. The mean difference of the logarithmic value between the observation value and the predicted GHI is shown by the solid boxplot line. The resultant’s Q1 and Q3 are represented by the box’s edges, and its 5th and 95th percentiles are displayed by the expanded whiskers. Examining further reveals that the direction of the mean differs noticeably between the two models, even though the length of the whiskers is similar for both. This fact suggests that the model’s predictions routinely outperform the measured results. Such a trend could signify a systematic bias within the model or the presence of unaccounted variables influencing the prediction process. The KIER-Solar WRF model has a positive result suggested to have an overestimated value. The systematic bias in the model is the result of a higher prediction GHI in the model.
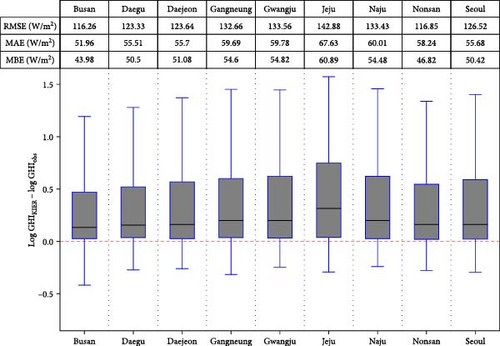
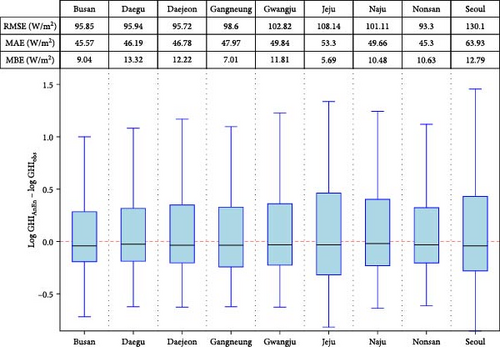
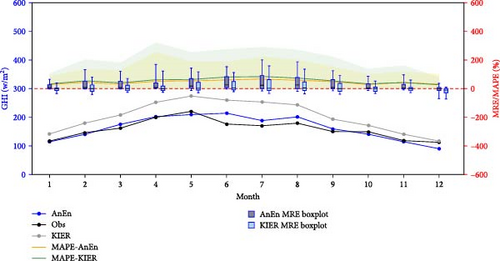
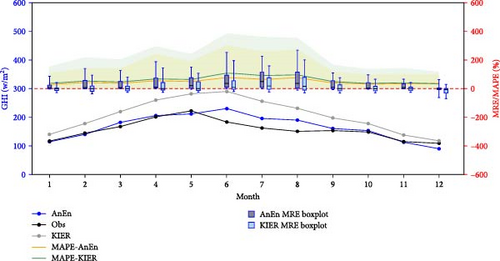
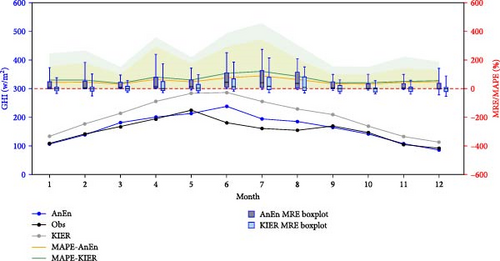
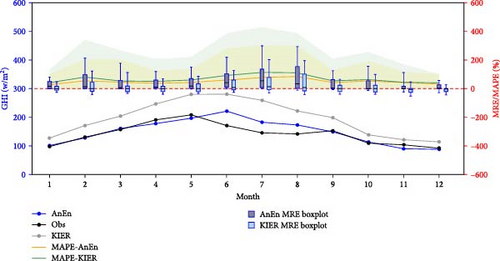
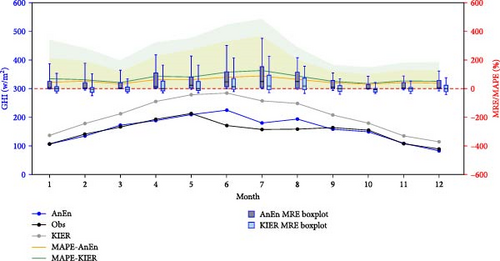
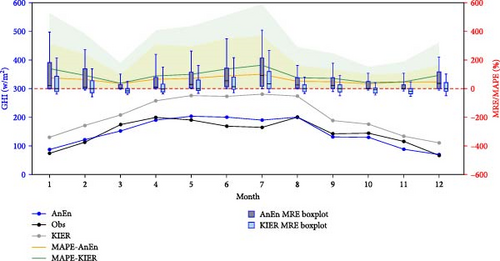
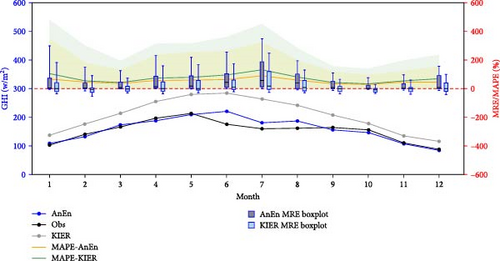
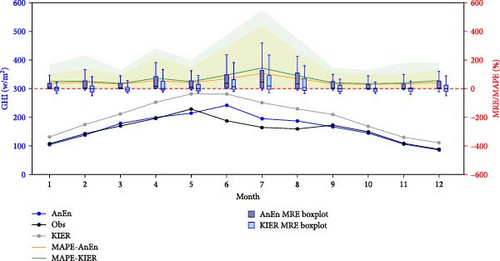
Figure 4 shows the relationship between the average value of the observation, KIER-Solar WRF and AnEn model. The average KIER-Solar WRF model shows an overestimation of 34.02%. While AnEn is applied a reduction of 30% in the overestimation of the KIER-Solar WRF model, although there are some deviation in the forecasting as shown in the figure between the month of May to September across all location, this may be because of the erratic quality of the observation value cause by the seasonal variations. The presence of a significant difference in MRE and MAPE between two models warrants a comprehensive discussion to understand its implications on forecasting accuracy. KIER-Solar WRF model shows a higher MRE which is evidently occurred in the month between May and August which significantly reduced in terms of the resultant of the MRE using the AnEn model. Similarly same occurs in the results using the MAPE, the effect of the AnEn model reduces uncertainty in all months by as much as 30% on the average. The presence of significant differences in MRE and MAPE between models underscores the importance of rigorous validation, critical assessment, and continuous improvement in forecasting methodologies.

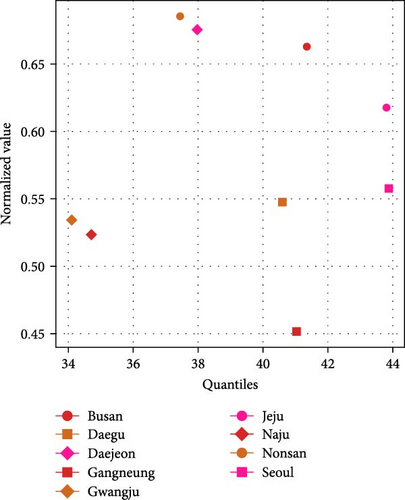
The quantile differences and skill scores were used to gauge the AnEn’s overall performance. The benefits of implementing a postprocessing technique are summed up by skill scores, which gauge an AnEn’s prospective accuracy. The overall error, as described in the preceding figures, is divided into bias and potential accuracy using the skill score and quantile difference, as illustrated in Figure 5. All of the stations’ behaviors, as shown in Figure 5, follow the same pattern, which is declining as the quantile rises. While using the AnEn model, we can deduce that the outcome is unfavorable, but this just indicates that the model’s predicting ability decreases as it approaches the extreme value or the tail ends of the distribution. Generally, the sun irradiance distribution is not usually dispersed throughout the day. When the skill score is between the 60th and 100th quantile, this distribution has an impact on the outcome. Because of the seasonal influence and climatic consistency, which restrict the peak value and increase variability, the impact of the distribution on the skill score will be taken into account. However, the quantile difference also agrees with the skill score result. As the quantile grows, so does the quantile difference. This implies that when the value of the AnEn model increases, its uncertainty grows. Because of this, the AnEn might not be utilized in a longer training datasets. There are a lot of things to take into account here. The first is seasonal variability, and solar irradiance is impacted by climate change, especially at extreme values. The selection of the members of the AnEn is challenged by climate change factors that modify the solar irradiance pattern, such as changes in cloud cover and meteorological conditions. Another contributing issue is that, in comparison to the projected data, the AnEn model yields values that are both understated and significant. This component has a complete impact on the outcome, particularly at sun irradiance extremes. In order to anticipate solar irradiance, we might assume the behavior of the AnEn model under these conditions.

To sum up, the decreasing debiased skill score across all stations suggests that the AnEn’s accuracy rises with the quantile. The application of the AnEn on its capacity to correct overestimation in the forecasting model is indicated by the low to zero outcome in the higher quantile. Conversely, a stronger bias on a high irradiance value is unquestionably implied by the increasing quantile difference as the quantile advances. On an enhanced model employing the AnEn, a normal pattern is indicated by a decreasing debiased skill score on an increasing quantile difference (Figure 6). The junction of the two approaches had the most effect on the irradiance’s median value. The threshold where the AnEn performs similarly is indicated by the point in the figure. The skewed prime skill score and the sharp quantile difference beyond the intersection point suggest that the AnEn began to lose accuracy on a higher quantile.
4. Discussion
We assess the financial feasibility of using an AnEn model using two different approaches. First, we apply the LCOE, a statistic that is frequently used to evaluate the long-term financial viability of solar PV systems. A system that is more cost-effective has a lower LCOE. Second, we use a revenue forecasting scheme to investigate the AnEn model’s predictive accuracy in comparison to the observation data. Our estimates, which center on an estimate of 1 MW solar PV plant, are based on the state of affairs in South Korea at the moment. By using these approaches, we hope to illustrate the AnEn approach’s potential economic advantages and forecasting power in renewable energy systems, especially in situations involving solar power generation.
As can be seen in Table 2, the assumptions made when employing the LCOE are predicated on South Korea’s existing state as of 2023. We examined the LCOE of the observation, forecasting, and AnEn models. We will be able to observe through these comparisons the effects of precise forecasting and how they may influence the power generation industry’s bottom line. Table 3 presents the monthly simplified LCOE ($/kWh) for each of the three models, with comparisons based on observation data. The average findings indicate that the lowest outcome is obtained when the KIER-Solar WRF forecast model ($10.06728 per kWh) is applied, using the same assumptions as all other models. Additionally, the model indicates each month when compared to other models, the KIER-Solar WRF forecast model performs the lowest. Lower LCOE often indicates a better overall system and cheaper electricity generation. We may also assume that, in general, PPs working with solar energy systems should use the KIER-Solar WRF forecast model as a forecasting tool. On the other hand, there are certain questionable aspects to the application of LCOE in the economic evaluation of forecasting models. First, the GHI outcome is overestimated according to the KIER-Solar WRF projection model. This has an impact on energy generation results, which is one of the parameters used in the LCOE computation. Large disparities in the overall error statistics in the preceding section further demonstrate the overestimation. Second, there is a significant discrepancy between the KIER-Solar WRF model and the observation data when comparing its output to the observation data and the observation data to the AnEn data. Using the observational data, the energy generated will be established as standard with the assumptions made in these models. This indicates that a forecasting model will be deemed dependable if its output is more similar to that of other forecasting models. This indicates that the AnEn model is a more accurate forecasting model to utilize because of the reduction in uncertainty that has been achieved.
| Result of LCOE ($/kWh) | Observation | KIER-Solar WRF model | AnEn model |
|---|---|---|---|
| 2022-08 | 11.0010 | 7.4662 | 9.2229 |
| 2022-09 | 11.0393 | 8.5574 | 10.8659 |
| 2022-10 | 11.5877 | 13.7638 | 12.3500 |
| 2022-11 | 16.5610 | 16.5898 | 17.0778 |
| 2022-12 | 19.8377 | 12.8251 | 20.5657 |
| 2023-01 | 16.4897 | 10.9747 | 15.9433 |
| 2023-02 | 13.9915 | 10.9747 | 13.7407 |
| 2023-03 | 10.0271 | 8.3446 | 10.3176 |
| 2023-04 | 11.5262 | 8.3822 | 10.2477 |
| 2023-05 | 10.0306 | 7.6136 | 9.3168 |
| 2023-06 | 10.7513 | 6.9851 | 8.7171 |
| 2023-07 | 13.3921 | 8.3301 | 10.3344 |
| Average | 13.0196 | 10.06728 | 12.3917 |
- Abbreviations: KIER, Korea Institute of Energy Research; LCOE, levelized cost of energy.
While LCOE is an effective method for determining the overall performance of an energy power plant, we cannot rely on its effectivity as a method of determining the economic impact of solar forecasting. Thus, another method is implied for suited to the implication of reduction of uncertainty in forecasting models and that is the revenue forecasting scheme.
The revenue forecasting scheme will rely on the numerical error in the forecasting based on the actual result of the GHI. While this is the common parameter for all renewable energy forecasting, we tend to include the policy developed in South Korea for forecasting scheme. In this sense, we will be able to incorporate the boundaries, penalties, or incentives given by the state for the renewable energy forecasting.
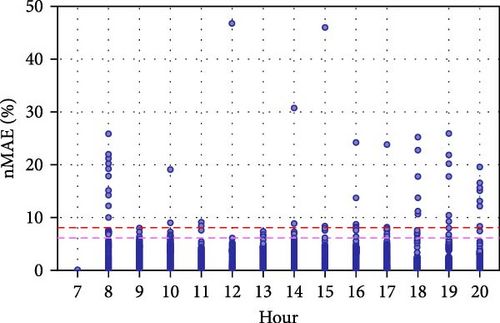
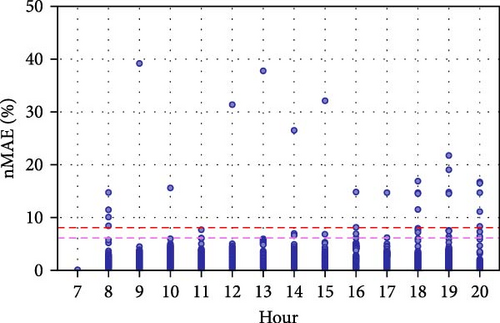
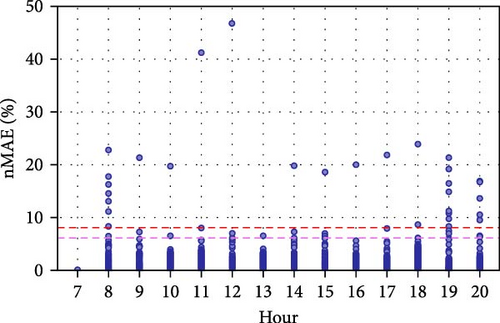
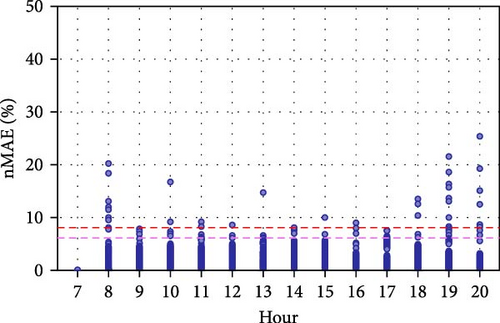
The analysis of the nMAE results is the first crucial step in understanding the revenue forecasting system for solar energy production. By breaking down the nMAE results into different time periods, as depicted in Figure 7, we can fully grasp the impact of employing AnEn in the forecasting model. In this figure, we sample two stations, one being Jeju and the other is Seoul. The comparison reveals that, except for the AnEn model, which shows a slight increase in solar radiation concentration starting around 14:00, both forecasting models generally display a normal distribution of solar radiation. This observed fluctuation in the hourly concentration of solar irradiance is significantly influenced by the seasonality factor, which is why it is integrated into the revenue forecasting scheme. The nMAE in Figure 7a,b behaves essentially identically, with the exception that it decreases when the AnEn is applied over all time intervals. Up to 22% of nMAE has been reduced. There is a clear nMAE at 13:00 in Figure 7c,d, which was fixed with the AnEn technique. With a reduction of roughly 10%–12% over all time intervals, the reduction is likewise noteworthy. The AnEn model stands out by consistently reducing nMAE across all time intervals, a testament to its superior accuracy. This reduction is particularly noteworthy, as it lowers the total nMAE by approximately 15%–20%. Consequently, this enhancement enables PPs to forecast solar energy generation with greater precision and reliability, ultimately leading to more efficient and dependable solar energy production and revenue planning.
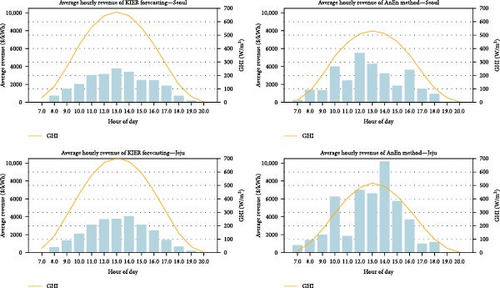
The revenue forecast method took into account many factors that are important for solar forecasting, including nMAE, differences between observed and predicted data, and incentives. The economic benefits of forecasting models must be determined with these factors taken into account. The increase in revenue for both the mainland and Jeju stations using the AnEn model is shown in Figure 8. The revenue increase at the Seoul station is most noticeable between 10:00 and 16:00, when solar peak hours occur. Figure 8 also illustrates how the AnEn model dramatically increases the overall annual revenue, despite the KIER-Solar WRF showing a rather flat line. On the other hand, the AnEn approach in Jeju station yields significant revenue gains during certain hours, most notably around 10:00, 12:00, 13:00, and 14:00. The improvement at 14:00 is particularly noteworthy due to Jeju’s highly variable weather conditions, especially during the summer. The overall data suggests that implementing a solar PV system in Jeju is highly advisable, as the AnEn method can yield a 78% increase in annual revenue. Despite the KIER-Solar WRF indicating a higher average GHI per hour, this does not necessarily translate to higher revenue, highlighting the importance of comparing forecast data with actual observations. Also, in Figure 9, the annual revenue comparison between stations highlights a significant increase in revenue for Jeju’s station when the AnEn model is applied. The correction provided by the AnEn model not only addresses the forecasting challenges posed by the island’s intermittent weather patterns but also demonstrates a notable economic impact on renewable energy production. Overall, the revenue model scheme proves impactful in accurately assessing the economic viability of solar PV systems and can be adapted for evaluating other RESs. This holistic approach ensures that the economic benefits of renewable energy projects are maximized, making them more attractive for investment and implementation. By considering not only the technical aspects but also the economic implications, stakeholders can make informed decisions that support the broader adoption of renewable energy technologies.

5. Conclusion
The comprehensive analysis of the AnEn model versus the KIER-Solar WRF model reveals significant improvements in forecasting accuracy, particularly in reducing overestimation and mitigating prediction biases. The residual analysis demonstrates that the AnEn model consistently provides more accurate GHI predictions, as evidenced by lower MRE and MAPE, especially during critical solar peak months from May to September. This reduction in error underscores the AnEn’s ability to account for seasonal variations and climatic inconsistencies, which are critical for reliable solar energy forecasting.
The evaluation using quantile differences and skill scores further highlights the AnEn model’s robustness, although with some limitations at extreme value predictions. The model’s performance tends to decline as it approaches the tail ends of the distribution, indicating increased uncertainty. This suggests that while the AnEn model is effective for general forecasting, its application might need adjustments or enhancements for predicting extreme solar irradiance values. The AnEn model’s integration into solar forecasting systems offers a substantial enhancement in accuracy and reliability, proving its value in economic assessments and operational planning for solar PV systems.
The financial feasibility assessment of using AnEn model in solar PV systems reveals compelling advantages over the traditional KIER-Solar WRF forecast model. By applying the LCOE approach, we observed that the AnEn model offers a more accurate and reliable prediction of solar energy generation, despite the KIER-Solar WRF model showing a superficially lower LCOE. This lower LCOE for the KIER-Solar WRF model is misleading due to its overestimation of solar irradiance, which can result in inflated projections of energy output and skewed financial evaluations. The revenue forecasting scheme further underscores the superiority of the AnEn model, as it demonstrates reduced uncertainty and greater alignment with actual observation data. This precision is crucial for making informed economic decisions in the solar power industry. The AnEn model’s ability to provide more accurate forecasts not only enhances the reliability of solar PV system performance assessments but also supports more realistic and dependable financial planning. The AnEn model stands out as a more effective tool for predicting solar energy output, ensuring better financial outcomes, and promoting the broader adoption of solar power technologies.
The analysis highlights the significant economic benefits of using advanced forecasting models, like the AnEn method, for solar power systems. By accurately predicting solar energy production and accounting for real-world variables such as weather conditions and incentives, these models can substantially increase revenue. For instance, the Seoul station shows notable revenue gains during peak solar hours, while the Jeju station benefits significantly during certain times, especially in the summer. Overall, the AnEn model can boost annual revenue by up to 78%, making solar investments more profitable and appealing. This approach not only emphasizes the importance of precise forecasting in maximizing the financial returns of solar energy projects but also demonstrates its adaptability to other RESs. By integrating both technical performance and economic factors, this method provides a comprehensive tool for assessing and enhancing the viability of renewable energy initiatives, encouraging wider adoption and investment in sustainable technologies.
Furthermore, even though the revenue forecast scheme has been applied appropriately in South Korea, we can only speculate that it will not be entirely applicable in other countries because the evaluation of its application is reliant on South Korean regulations about renewable energy. Otherwise, in order to evaluate the revenue forecasting scheme, we must evaluate the nation’s laws, sanctions, and rewards in order to obtain a more accurate assessment of the renewable forecasting model. For the purpose of determining the viability and evaluating commercial technologies for renewable energy, LCOE is still accessible in the absence of those factors.
Conflicts of Interest
The authors declare no conflicts of interest.
Author Contributions
del Pozo FE Jr.: conceptualization, methodology, software, validation, formal analysis, investigation, data curation, writing–original draft preparation, writing–review and editing, visualization. C. K. Kim: conceptualization, methodology, validation, formal analysis, writing–review and editing, resources, visualization, supervision, project administration, funding acquisition. H. G. Kim: validation, resources, supervision, project administration, funding acquisition. C. Y. Yun: conceptualization, methodology, resources, supervision. All authors have read and agreed to the published version of the manuscript.
Funding
This work was conducted under the framework of the research and development program of the Korea Institute of Energy Research (C5-2422).
Open Research
Data Availability Statement
The data that support the findings of this study are available upon request from the corresponding author. The data are not publicly available due to privacy or ethical restrictions.


