Multi-Scale Geomechanical Modelling of Unconventional Shale Gas: The Implication on Assisting Geophysics–Geology–Engineering Integration
Abstract
In the development of unconventional shale play, simulation of the performance for wells needs to incorporate sufficient complexity in geology to take fully into account the variabilities in petrophysical and geomechanical properties. These parameters controlling the effective stimulated rock volume (eSRV) represent the heterogeneity and strong-layering nature of unconventional reservoirs: high inter-bedding anisotropy, flow behaviours and pre-existing geological disconnections (bedding planes, faults, fissuring, natural fractures). This realistic simulation model includes direct information and interpreted understanding from data sources in a wide range of resolutions and scales and is finally coupled with hydraulic fracturing and reservoir depletion modelling in terms of mechanical. The multi-scale geomechanical model incorporates processed seismic interpreted data (10 m scale), petrophysical core data (cm scale), routine scalar logs (m scale) and resistivity borehole image (0.25 cm scale). The vital role the multi-scale geomechanical model plays during the entire workflow is to underpin the disconnection among actual well logs, conventional seismic interpretation and geological complexity by calculating and predicting field scale geomechanical parameters and in situ stresses distribution. Multiple research investigations and case studies on such integration include data acquisition and processing methods, modelling upscaling methodologies and data diagnostical techniques from multidisciplinary perspectives. Although these works show great progress in improved understanding of the spatial and temporal distribution of formation reservoir and geomechanical distribution, uncertainty remains as local stress variations and mechanical-flow properties between layers are impossible to capture.
1. Introduction
Unconventional tight and shale resources have been playing an important role in future hydrocarbon contribution as conventional reservoirs are being depleted. However, unconventional reservoirs often share the characteristics of low productivity due to the nature of low permeability and low porosity, if no artificial stimulation techniques are implemented. With the premise of geological investigation and evaluation, unconventional reservoir always requires massive horizontal well drilling and multi-stage hydraulic fracturing in order to build economical production. As unconventional oil and gas wells follow a rapid rate decline pattern, infill drilling and refracturing are common practices during the development process, so is well pad development for shale gas play. To enhance development efficiency, a novel integrated workflow [1–3] focusing on multi-stage hydraulic fracturing design is urgent cooperating geological investigation, petrophysical assessment [4], geomechanical evaluation [5, 6], drilling and completion [7], hydraulic fracturing treatment [8, 9], pre-/post-fracturing diagnostics and model optimisation for the field development plan. In the course of geology–engineering integration [10] workflow, geomechanical modelling [11–13] functions as the vital bridge between evaluation and design scenario by incorporating sufficient geological complexity [14] and pre-existing mechanical discontinuity and anisotropic deformation (faults, bedding planes and natural fractures) coupled with hydraulic fracturing system.
Until recently, the development of unconventional reservoirs still relies on expensive and time-consuming experiments and trials. Solution for the optimization process still requires efforts on geophysics–geology–engineering integration. Hydraulic fracture test site (HFTS) organised by U.S. Department of Energy (DOE), Gas Technology Institute (GTI) and leading operator and service companies initiated in 2013 has constantly released field studies on multidisciplinary subjects [15–17]. Driven by unanswered questions from HFTS-1 in the Permian Midland basin, HFTS-2 used eight newly producing wells and two parent wells in Delaware basin to perform hydraulic fracturing research through advanced diagnostics and expensive collections of through-fracture cores. $25 million and over $30 million were used to perform hydraulic fracturing research on first and second generation test sites, respectively. Phase III of HFTS-1 is a joint field study examining reservoir drainage to investigate if recovery can be improved from existing wells by identifying and accessing extra undrained reservoir through recompletions, infilling drilling and new stimulation technology [18]. Fracture conductivity and geometry models are calibrated using various diagnostics in Wolfcamp in HFTS-2, and then the integrated fracture and reservoir models are used for investigating the impacts of completion designs and well spacing on full section production [19, 20].
Such integrated studies trigger significant advances in reservoir characterisation and understanding of the effective stimulated rock volume (eSRV), whereas the topic remains challenging due to some unsolved complexity [21]: (i) Number of operational variables during unconventional reservoirs development considering the dynamic nature (variations of in situ stresses and pore pressure) (ii) the complicated mechanism of fracturing, (iii) the multi-physics interactions of proppant transport and flow and (iv) operational scale and speed. As geological complexity cannot be avoided, the understanding of the cause (geology–engineering) and effect (production) relationship essentially requires embracement of anisotropy and heterogeneity nature of unconventional reservoirs by means of fine-scale characterisation and engineering innovations.
The article summarises the review of multidisciplinary subjects of geology–geophysics–engineering integration though aspects of industrial workflow on such integrated studies, with the focus on multi-scale reservoir geomechanical model establishment and in situ stresses distribution calculation. Each step of the workflow is discussed and explained using typical curves and models based on data from unconventional shale play in West Canadian Basin.
2. Workflow of Three-Dimensional (3D) Geomechanical Modelling and Stress Calculation
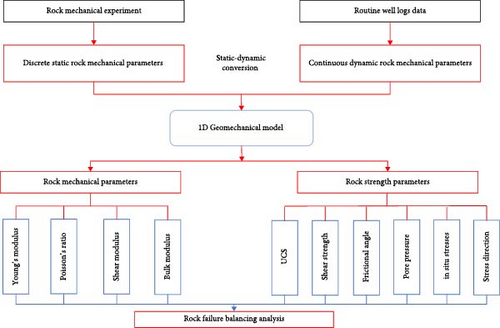
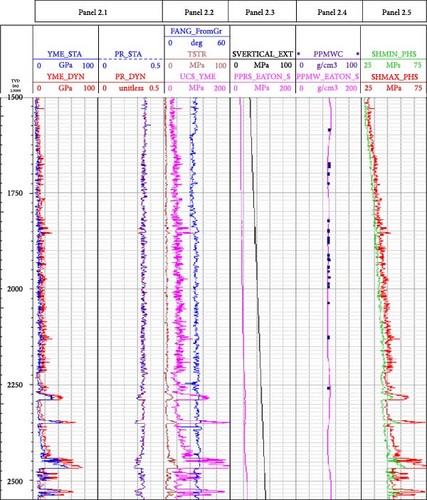
Experimental rock mechanical measurements provide the static mechanical parameters at certain depth while the well logging data predicts continuous dynamic mechanical parameters. Converting coefficient from dynamic to static is needed, the basic logic of one-dimensional (1D) single well geomechanical model establishment is demonstrated in Figure 1. The 1D geomechanical model based on single well location outputs both rock mechanical (Young’s modulus, Poisson’s ratio, Shear modulus and Bulk modulus) and rock strength parameters (uniaxial compressional strength [UCS], shear strength, frictional angle, pore pressure, in situ stresses and directions). After verifications and calibration with core data, the 1D geomechanical outputs elastic properties and strength of rocks, pore pressure distribution and predicts in situ stresses, brittleness for drilling–completion decision and hydraulic fracturing design optimisation. Single well-based geomechanical models are used as referenced real data to upscale the model from 1D to 3D based on assumptions and simulation methods on geostatic. 3D geomechanical model outputs mechanical stratigraphy and interfaces classification upscaled away from wellbore locations and predicts in situ stresses using finite element method (FEM), which provide inputs for hydraulic fracturing design and modelling coupled with flow modelling, thus a more reliable parameters optimisation and finally optimal assessment and development plan.
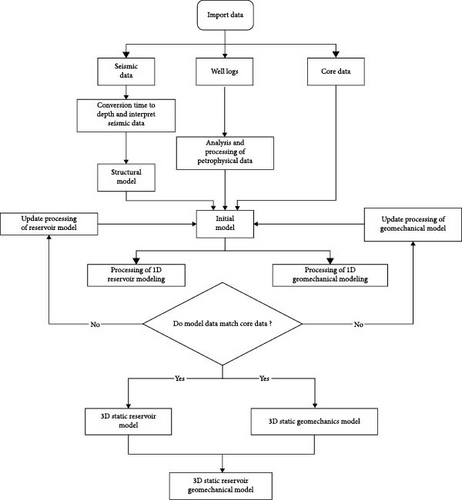
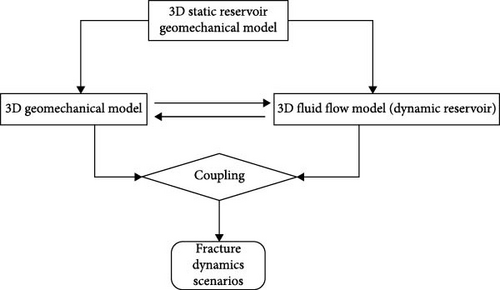
The structure of the 3D workflow is disposed of as follows. First, the 1D geomechanical modelling and reservoir parameters are calculated and computed at well locations by using well logging data. Afterwards, calibration and verification of the calculation are implemented by crosschecking with core data and seismic interpretation results. Third, the 3D geomechanical properties distribution is simulated using geostatistical methods. Fourth, the 3D reservoir pore pressure is presented using geostatistical algorithms. Fifth, the 3D static geomechanical finite element model is built comprised of the 3D geomechanical and reservoir properties parameters. The flowchart of the above processes is shown in Figure 2a. Finally, the dynamic scenarios (Figure 2b): the in situ stress distribution is calculated for perspective stress path dependence simulation, i.e., coupled with reservoir depletion simulation, hydraulic fracture treatment design or re-fracturing/infilling at existing wells. Typical model is used as representative to explain and discuss the workflow in each step.
2.1. 1D Single-Well Geomechanical Parameters Calculation
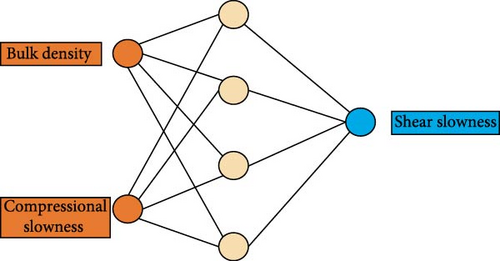
Empirical formulation cannot take reservoir characterisation specifically and usually predicts DTs far from normal if heterogeneity and anisotropy are high. Under the circumstance of insufficient real petrophysical input, [23, 24] neutral network method is utilised in predicting shear slowness for missing segments. The basic logic of neutral network method applied to missing sonic log prediction is following the diagram in Figure 3. Density log (RHOB) data and DTc data are chosen as the top related parameters with DTs. First of all, data are collected from wells with complete sonic logging, despite the fact the well count could be low. Density log and DTc data are then trained for wells. The predicted DTs are compared with the real-time one to determine if the model works for the reservoir. After verification of the neutral network model, reliable DTs can be used to calculated basic geomechanical parameters.
2.2. 3D Elastic and Strength Properties Distribution
Volumetric mechanical properties in 3D model are upscaled using the 1D geomechanical model based on single-well logging data. The distribution of volumetric geological variants is modelled using geostatistical methods, which is the mainstream workflow for most geological upscaling modelling software. One of the top issues for geostatistical modelling is to involve the analysis of spatial data and pattern. One of the top issues for geostatistical modelling is to involve the analysis of spatial data and pattern, including spatial distribution of geomechanical and reservoir properties. For the case of reservoir properties modelling, continuous variants such as porosity, permeability and saturation are circumscribed by conditional data from well seismic interpretation. Once the well logs are upscaled, variogram modelling is then used to describe the spatial variability of these properties. Investigating the variability of a field property using the variogram requires sufficient amount of data located at different distances and in different directions. Back to 90s, Verly [26] uses Monte Carlo method (sequential Gaussian simulation [SGISM]) to generate models of possible reservoir properties heterogeneities. The simplicity and flexibility make the SGISM particularly appropriate for simulating petrophysical properties such as porosity and permeability. As prediction of reservoir geomechanical parameters plays an increasingly important role in unconventional play development for drilling–completion and productivity optimisation, physically reliable 3D elastic properties model is urgent.
Ostad, Niri, and Darjani [27] proposes a methodology for mechanical modulus modelling using laboratory measurement and well-logging data as primary variable, conditioned by seismic acoustic impedance as auxiliary variable. After comparison on real case study, the results indicate that turning band co-simulation (TBCo-Sim) has less error in reproducing variograms and observed data compared to sequential Gaussian co-simulation. Eze and Hu [28] proposed a workflow for natural fracture predictions in unconventional shale (HFTS-1 case) using machine learning and geostatistical methods. Another case study on 3D upscaled reservoir geomechanical properties model is presented for Volve oil field in centre part of North Sea [22], and the upscaling results based on Kriging method and SGSIM method are compared. Other case studies on SGISM for locally varied anisotropy [29] and machine-learning-based SGSIM [30].
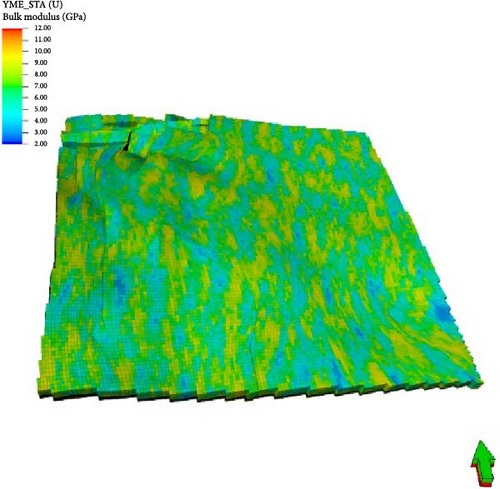
Based on elastic properties and strength parameters from single-well-based calculated geomechanical model and geological grids, it is applied to simulate the distribution of discrete and continuous variations such as saturation, permeability, porosity and elastic properties, with known conditions at well locations and seismic data. The gird system of the 3D geomechanical elastic model is following the original geological model (Figure 5 shows the 3D distribution of Young’s modulus).
2.3. 3D Overburden Stress Distribution
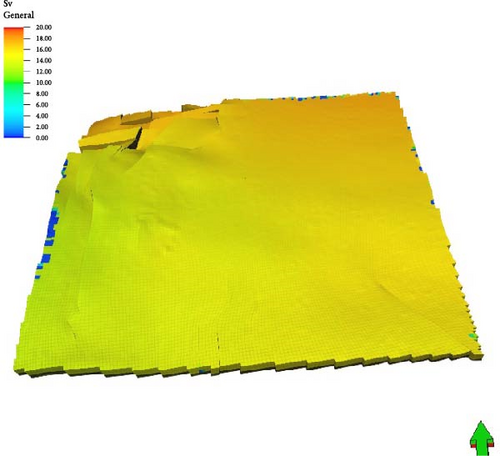
- i.
Gardner coefficient acquirement through matching from well-logging data;
- ii.
Density is calculated accordingly from seismic interval velocity by the Gardner equation;
- iii.
Seismic-interpreted density is locally constrained by log-interpreted density;
- iv.
The density volume is finally inversed from seismic-interpreted density.
2.4. 3D Pore Pressure Distribution
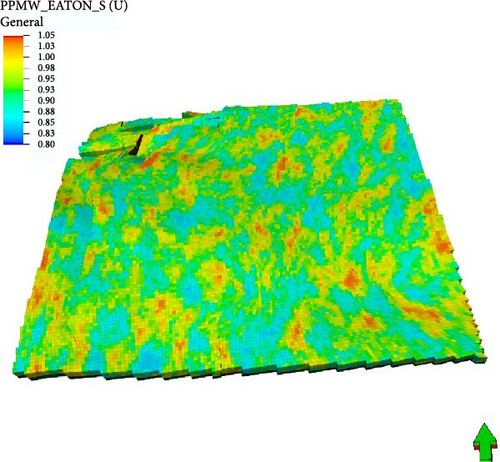
Conventional seismic velocity-based prediction [32, 33] provides indirect predrilling pore pressure, and the uncertainty soars with increased geological complexity. Current seismic-based interpretation requires a sufficient high-resolution seismic velocity model, and the following inputs are prerequisite: (1) 3D seismic velocity model; (2) locally calibrated transforms from compressional velocity to vertical effective stress to generate a 3D pressure model from the seismic velocities; and (3) high-quality seismic interpretation horizon [34]. Recent case studies showcase pore pressure prediction using machine learning [35] and coupled geomechanical and thermodynamic models [36].
The typical interpolated 3D pore pressure distribution is shown in Figure 7.
2.5. 3D Finite Element System of Geomechanical Model
The FEM has been widely applied in multiple engineering and science disciplines and has achieved great success in geotechnical engineering [39]. Typical in situ stress analysis methods are mainly based on 3D FEM, combined with regression method [40], neural network and machine learning [41]. Multi-scale FEM is proposed by Castelletto, Hajibeygi, and Tchelepi [42] for linear elastic geomechanics equilibrium problem of heterogeneous porous media. For field scale 3D FEM, geological complexity in shale play remains one of the top prioritised issue due to anisotropy caused by variations of interlayer properties and existence of multi-scale natural fractures. Markou and Papanastasiou [43] develops a 3D geomechanical reservoir model with faulted and compartmentalised geometry, based on non-linear finite element analysis (FEA) (Figure 8) and field information located in the offshore deepwater in the Eastern Mediterranean. The FEA follows the basic consequence of reservoir inputs, finite element modelling, analysis and the processing output for pressure, stress and displacement, etc. Markou also points out one of the key issues in dealing with reservoir finite element modelling is the mesh size, which is related to the accuracy of the model, the computational efficiency and surface contact interactions caused by complex geometry.

Specific element type used in the typical finite element geomechanical model has been addressed in this workflow for ABAQUS. Basically, the choice of the hexahedron 3D or rectangular 2D elements are predominated by the need of coupled pore fluid diffusion and stress analysis in ABAQUS, tetrahedral (3D) or triangular (2D) do not work for this coupled calculation.
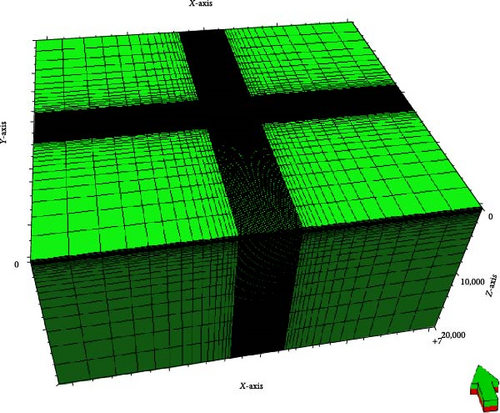
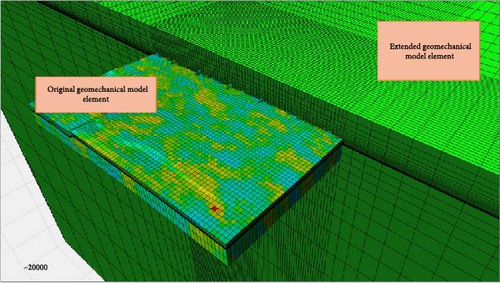
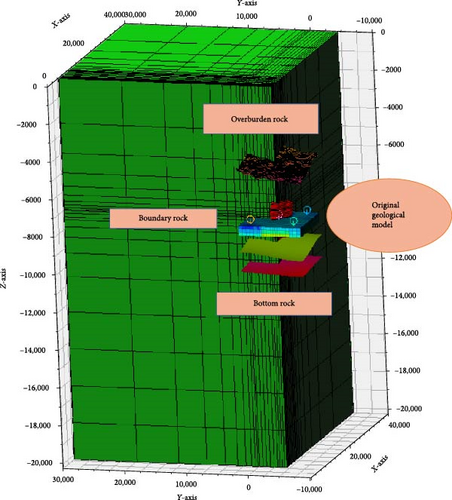
In order to calculate the original stress distribution for target model using FEM, extended elements are inserted to represent boundary conditions and overburden/bottom stress conditions (Figure 9 shows the 3D view of the entire geomechanical model). Specially, boundary rock elements are extended away from the target model far enough to avoid unexpected stress concentration and the exterior boundary effect and are set as rigid body for peripheral elements of extended geomechanical boundary component (Figure 10). All components of finite element geomechanical model are listed in Figure 11 in details with a quarter view of the whole 3D model. The extended geomechanical elements consist of overburden rock, the boundary rock and the bottom rock.
A geostatic stress field procedure is used to verify that the initial geostatic stress field is in equilibrium with applied loads and boundary conditions and to iterate, if necessary, to obtain equilibrium. Geostatic can be linear or nonlinear and is usually the first step of a geotechnical analysis, followed by a coupled pore fluid diffusion/stress or static analysis procedure.
The mesh size system is the key for calculation accuracy and efficiency. The size of element involved in geostatic calculation is required to meet the following criteria: (I) The ratio of length–thickness of geomechanical elements should be over 3; (II) the transition of geomechanical elements from those of the target model should be smooth even both in transverse and longitudinal directions (Figure 10 demonstrates how mesh size transits from the original elements to the extended elements); (III) the geomechanical element near pay zone should be finer and become thicker away from the target layer to save computational efficiency and (IV) the extend boundary condition elements are mandatory to be volumetrically enough to avoid any unexpected boundary effects and stress concentration inside the target model (direct view of the volume contrast between the original elements and the extended element in Figure 11).
Element materials include sandstone, mudstone, faults, overburden rock, boundary rock, bottom rock and rigid body with rock geomechanical properties. Material properties are then assigned to elements in accordance. Geomechanical attribute models remain anisotropic at the original geological model element for density, porosity, Yong’s modulus, Poison’s ratio, UCS and uniaxial tensile strength (UTS) properties.
2.6. 3D Initial In Situ Stress Distribution Calculation
Dynamic scenarios of 3D geomechanical modelling deal with the coupling issue of geomechanics with fluid flow behaviours (Liu 2021; Luo 2022). Modelling of stress distribution provides pre-operational [44] wisdom for the investigation of hydraulic fracture design, parent–child well intervention by visualising the heterogeneity and anisotropy capturing local stress variation and faults [45]. Prioul, Bakulin, and Bakulin [46] presents a concise but comprehensive methodology of modelling 3D stress field by anisotropic seismic velocities, based on non-linear elasticity theory.
Field formation stress and pore pressure depletion could be verified by measured data. Zhang et al. [47] build the 3D in situ stress field model by applying the stochastic modelling method. The co-processing uses multi-information from laboratory experiments, fracturing results, experienced formula and logging information. Real-time field data is quantified by Liu et al. [48]. Formation stress and pore pressure change are caused by production depletion from existing parent wells in the Athabasca oil sands. Alatrach et al. [49] proposes a multiphyscis integrated workflow for field stresses estimation in Gulf of Mexico (GOM) deep-water formation. At the near-wellbore region, Lin and Zou [50] presents an alternative method for estimating complete 3D stresses using back analysis of convergence measured in multiple boreholes, even though the current method is capable of measuring the full 3D stresses is over-coring uniquely. A seismic scale 3D geomechanical finite element stress analysis is accomplished using commercial software VISAGE [51], with real-world dataset from the Gulf of Mexico.
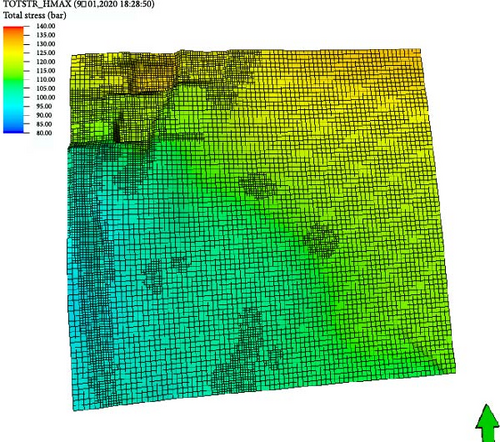
The 3D initial stresses distribution are calculated automatically through the geostatic step once initial conditions and boundary (constraint) conditions are applied to the geomechanical model: initial condition is inherited from the overburden stress distribution in step 3 and initial pore pressure distribution calculated in step 4; stress calculation is constrained by 1D in situ stresses calculated at single-well location derived from real-time well-logging data in section step 1. Figure 12 demonstrates the typical field scale maximum horizontal stress distribution based on the original geological structure model, unit in bar. As no direct measurement of maximum horizontal stress can be achieved from the field or lab, the calculation based on finite element geomechanical model is mainly constrained by results from 1D geomechanical modelling.
The geological model is built with a fine grid to depict characteristics of geological structure and geological layering using drilling data and reservoir attributes and geomechanical properties are then calculated and embraced within each geological grid. The accurate way for calculation in situ stresses distribution is through FEM. Overburden stress, bottom stress and infinite-acting stress boundary conditions are created through extra element body attached to the target model before geostatic calculation step is run. However, in practical operation, the fine grid system would also cause a devastating high demand on computation efficiency and rare cases to reach a reasonable converging result. Numerical tools for computational efficiency improvement include reduced order modelling and machine learning tools. (Reference needed)
Moreover, in situ stresses can vary significantly from one to another place, owing to a number of reasons. Finite element modelling is useful when fairly good understanding of the geological structures and rock property variations exist, which unfortunately is often impossible even with the latest technologies, including high-resolution seismic survey.
3. Conclusions and Perspectives
Development of unconventional resources such as shale gas and tight gas has become one of the largest challenges for the oil and gas industry. Principal logistics for unconventional play characterisation and development are much the same as its conventional counterpart, except that characterisation and modelling efforts involved are complicated by heterogeneous and anisotropic nature of the reservoirs and by limited operational and dynamic time scale from development to depletion. The industry is on the highway of learning for an integrated cross-functional process where the optimal development plan is dependent on a multi-scale and multidisciplinary workflow.
Prediction and calculation of geomechanical model have always been the pivotal input for hydraulic fracture design optimisation and the output of petrophysical analysis demonstrating geological complexity and anisotropy in unconventional shale and tight gas reservoir developments. Advanced hydraulic fracturing and flow simulation incorporate multiple phenomena at a time through increased geologic complexity. Failure in capturing the fine-scale formation properties inputs will result in questionable predicted HF and eSRV. 3D in situ stresses distribution, local stress and properties variation between layers and mechanical and flow properties of the interfaces between layers are calculated and validated using stress-coupled pressure. Original pore pressure is introduced to calculate original stress distribution through geostatic procedure instead of certain pore pressure gradient.
Conflicts of Interest
The authors declare no conflicts of interest.
Funding
The study is supported by CNPC fundamental and perspective program, “Key Technologies for Canadian Shale Gas High-efficiency Development”, No. 2021DJ3303.
Acknowledgments
CNPC (PetroChina) and RIPED (Research Institute of Petroleum Exploration and Development) are thanked for permission to publish this work. Opinions presented in this paper represent only the author’s personal viewpoints. Contribution from Chong Liang, Dawei Zhu, Chunmei Zou, Jun Yan and Yu Bai are greatly acknowledged.
Open Research
Data Availability Statement
The authors have nothing to report.


