Synthetic Data–Based Approach for Supercapacitor Characterization and Areal Capacitance Optimization Using Cyclic Voltammetry Data
Abstract
Optimizing areal capacitance for supercapacitors (SCs) using cyclic voltammetry (CV) involves complex, iterative experiments. Multiple tests are necessary to account for variations in electrode–electrolyte interactions and environmental factors, ensuring thorough characterization. However, this process is time consuming and labor intensive. This study leverages machine learning (ML) to streamline the procedure by generating reliable synthetic data, thereby reducing the time and resources required by traditional methods. The reproducibility of synthetic data makes it a valuable tool for research and validation. Various ML models are used for synthetic data generation, selected based on the characteristics of the real data. This research specifically employs the XGBoost (XGB) ML model to introduce variations in scan rates, enriching the dataset within the range of 5–600 mV/s. Results show that ML algorithms effectively preserve the statistical properties of CV data for laser-induced graphene (LIG) SCs, evidenced by a high R2 value of 0.97 for the synthetic dataset, confirming the data’s fidelity. Additionally, the study introduces a Python module for calculating areal capacitance, facilitating assessment in both real and synthetic datasets. This approach accelerates SC analysis while maintaining data integrity, paving the way for future research and development.
1. Introduction
Voltammetry is a widely used electrochemical technique that is employed for both qualitative and quantitative analysis of electrode reaction mechanisms. This dynamic technique is useful for investigating and comprehending diverse electrochemical processes. Voltammograms are generated and analyzed as part of the study approach. Despite the presence of numerous different voltammetric techniques, cyclic voltammetry (CV) is generally recognized as the major technique used in the analysis of electrode processes.
CV is one of the methods used to determine the performance of a supercapacitor (SC) and improve either the electrode composition or the material characteristics of the SC [1]. When doing an experiment on an SC using CV, the scan rate plays an essential part in defining the performance and behavior of the SC [2]. It is feasible to analyze the behavior of the SC at various potential change rates and gain a more comprehensive performance by changing the scan rate. This may be done to achieve the best possible results. The conventional approach to optimize various scan rates through electrochemical techniques has been reported [3]. Utilizing a machine learning (ML) methodology can facilitate the process. ML is being used extensively to improve the accuracy of data models by allowing them to identify the nonlinear relationships between variables, detect patterns and correlations, and capture complex interactions between input features [4]. This type of analysis is critical to improving accuracy in regression models, as traditional approaches are limited in their ability to account for nonlinear effects or nuanced relationships between inputs [5]. The study can also help determine if the design has flaws or problems, like slow ion transport or low stability, which can be fixed later.
An SC is a kind of energy storage device that, compared to conventional power sources, can store and discharge electrical charge faster [6, 7]. Since miniaturized flexible SC devices are better for quick charging and discharging applications, they can endure more charge–discharge cycles for applications requiring higher power than batteries [8, 9]. An SC combines the high energy density of a battery with the high-power density of a capacitor [10]. It works well with wearable electronics and machinery that need to bend or flex [11]. To characterize the SC, different electrochemical techniques can be used, such as CV, galvanostatic charging and discharging (GCD), and electrochemical impedance analysis (EIS).
In the initial investigation into ML conducted by Alan Turing regarding the potential of machines to demonstrate human-like intelligence, significant advancements have been made in ML and artificial intelligence [12]. ML, a subfield of artificial intelligence, has witnessed widespread utilization in a multitude of disciplines, encompassing social science [13], chemistry [14], physics [15], and notably, in addressing formidable obstacles such as the quest for a cure for COVID-19 [16]. Nevertheless, despite the significant contributions made by DePalma and Perone, where they utilized pattern recognition techniques and early laboratory computers to extract important parameters from voltammograms, the widespread integration of ML methods in voltammetry has surprisingly been limited. The researchers employed a methodology encompassing system training by utilizing synthetic and experimental data. This comprehensive approach yielded favorable outcomes in accurately predicting electron transfer rates, coefficients, and electrode mechanisms. By leveraging larger datasets and incorporating ML algorithms into regression models, the underlying relationships between inputs and outputs can be identified, leading to more accurate predictions and improved results [17]. ML techniques are widely used in micro electromechanical systems (MEMS) devices, such as detecting biomarkers [18, 19]. Also, the SC includes the remaining useful life and SC capacitance [20], prediction of specific capacity and cyclic stability, comparison of the experimental results, and the predicted values generated using artificial neural network (ANN) and random forest (RF) [21]. Supercapacitance behavior for codoped Ceria/rGO nanocomposite has been done using ML [22].
In the presented work, laser-induced graphene (LIG)-based electrodes are paired with various electrolytes, including sodium hydroxide (NaOH), sodium chloride (NaCl), potassium hydroxide (KOH), polyvinyl alcohol (PVA)-KOH, and PVA-NaOH. CV was employed to characterize SCs at different scan rates. ML models were utilized to predict the impact of the CV scan rate, aiding in the design of novel materials, conserving time and resources, and enhancing accuracy. MEMS devices, such as SCs, leverage ML to detect biomarkers, predict remaining usable life and capacitance, evaluate cyclic stability, compare experimental data, and forecast specific capacity. Employing ML to generate synthetic CV data opens new application opportunities, such as developing and optimizing data analysis algorithms, investigating electrode reaction mechanisms, and designing specialized signal processing techniques for different scan rates. Additionally, integrating ML-generated synthetic data has improved the design and testing processes for novel electrochemical sensors and devices, leading to more effective and precise electrochemical systems.
2. Experimental Section
2.1. Chemicals and Materials
LIG was used as an electrode material. The commercially available polyamide (PI) film (Kapton 125 mm) was acquired from Dali Electronics in Mumbai, India, and used to fabricate the SC device using PI. NaOH, KOH, and NaCl are bought from Sisco Research Laboratories Pvt Ltd and Sigma–Aldrich Co. (St. Louis), which is used for this experiment. Potentiostat (from Origa Flex) is the equipment used for electrochemical analysis.
2.2. Device Fabrication
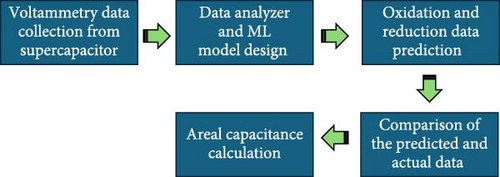
The previously reported method of formation of LIG on the flexible PI substrate has been used to fabricate electrode material. Isopropyl alcohol (IPA) and DI water were used to clean the PI sheet, and then it was subjected to a 5-minute ultrasonic treatment. Laser scribing on the PI sheet was done directly using a CO2 laser at optimal power and speed of 2.4 W and 175 mm/s in a vacuum [3]. A miniaturized interdigitated electrode (IDE) structure with different electrolytes has been used for the electrode fabrication. LIG with different electrolyte aquas (NaOH, KOH, and NaCl) and gel (PVA-KOH and PVA-NaOH) experiments have been carried out. The process is illustrated in the flow diagram in Figure 1.
2.3. Data Collection
Using the CV technique, ~97,000 data points were collected from a combination of five electrolytes (NaCl, NaOH, KOH, PVA-KOH, and PVA-NaOH) across 30 different scan rates ranging from 5 to 600 mV/s. The data generated was used to characterize the SC device, with the potential window for the experiment set at 0–0.8 V.
3. Data Synthesis and Analysis
Synthetic data refer to artificially generated data that mimic real data but are not derived from actual observations or measurements. It is created using various mathematical and statistical techniques to simulate the characteristics and patterns of real-world data. Synthetic data generation is a reproducible process. This means the researchers can repeatedly reproduce the synthetic dataset for ongoing research and validation as and when needed.
Different ML models and techniques can be used for synthetic data generation, each with strengths and limitations [23]. The choice of the model depends on the specific characteristics and patterns of the real data you want to replicate. Kuchin et al. [24] experimented with various ML models (including linear regression (LR), K-nearest neighbor (KNN), support vector machine (SVM), XGBoost (XGB), multilayer perception (MLP), and long short-term memory (LSTM)) to generate synthetic datasets and compared them with the real dataset on various parameters. XGB performed the best, followed by the LSTM.
A series of works published by this group also concluded that XGB had performed better than the other ML models for regression mapping for multiple use cases across MEMS devices including electrochemiluminescence (ECL) devices, Biomorph Cantilever design, and fuel cell power density optimization, respectively [18, 25, 26]. As per the work published by Kahar et al. [27], the relative performance of various regression models, including LR, decision tree (DT), RF, KNN, gradient boost (GB), and XGB are listed in Table 1 below.
| ML models | Power Prediction (Regression Accuracy Metrics) | |||
|---|---|---|---|---|
| MAE | MSE | RMSE | R2 | |
| LR | 0.36 | 0.20 | 0.45 | 0.70 |
| DT | 0.28 | 0.19 | 0.44 | 0.72 |
| RF | 0.21 | 0.11 | 0.33 | 0.84 |
| KNN | 0.23 | 0.11 | 0.34 | 0.83 |
| GB | 0.20 | 0.11 | 0.33 | 0.84 |
| XGB | 0.19 | 0.09 | 0.31 | 0.86 |
- Abbreviations: DT, decision tree; GB, gradient boost; KNN, K-nearest neighbor; LR, linear regression; ML, machine learning; RF, random forest; XGB, XGBoost.
XGB is one of the efficient ML algorithms applied to regression tasks, especially nonlinear ones. It is predicated on the gradient boosting model and has become a robust option for fitting the curve. Given that the XGB is an ensemble technique, it leverages several DTs to deliver a better fit. It builds an additive model, where each new tree successively corrects the errors made by the previous ones. This results in a strong predictive model by iteratively minimizing the error between the predicted and actual values [28]. The ensemble approach adapted by the XGB technique helps capture the complex relationships and dependencies in real-world data, making it suitable for creating synthetic datasets. XGB also includes regularization techniques to prevent overfitting. When generating synthetic data, controlling the complexity of the model is important to ensure that the synthetic data resemble the real data while avoiding unrealistic details. While generating synthetic data, the model must remain reproducible. XGB allows the consistent creation of the same synthetic dataset, which is especially advantageous for research and testing. XGB algorithm offers robustness, efficiency, and flexibility, along with its ability to capture complex patterns and relationships. Because of these inherent advantages, XGB becomes a suitable choice for synthetic data generation, especially when creating synthetic data that closely resemble real-world data characteristics.
This research uses XGB algorithms to create variations in scan rates, ranging from 5 to 600 mV/s, to generate oxidation and reduction curves, known as voltammograms or cyclic voltammograms. These voltammograms plot the current (or current density) against the applied potential (voltage) during CV experiments. The oxidation curve, typically shown on the forward scan of the CV, indicates the increase in current as the potential is swept in the positive direction. Conversely, the reduction curve, displayed on the reverse scan, shows the decrease in current as the potential is swept in the negative direction. By analyzing these CV results, the characterization of an SC is achieved.
Following the generation of synthetic CV scan rate data, the areal capacitance was calculated for different scan rates and electrolyte combinations. Areal capacitance measures the electrochemical capacitance of an electrode material per unit surface area. The optimization of areal capacitance is carried out in two key modules: (a) Data Generator and (b) Areal Capacitance Calculator. Both modules are explained in the following sections.
3.1. Synthetic Data Generator
- 1.
n_estimators: 100 (the number of boosting rounds or trees to build)
- 2.
learning_rate: 0.3 (also known as eta, controls the step size during the boosting process)
- 3.
max_depth: 6 (the maximum depth of the deciss)
- 4.
reg_alpha: 0 (L1 regularization term on weights)
- 5.
reg_lambda: 1 (L2 regularization term on weights)
To understand the relative importance of various features used in this data model, a feature analysis was carried out to identify which features have the most impact on the predictions of the model in nonlinear curve-fitting scenarios. For this purpose, the F-score (also known as F1-score) is calculated for scan rate, oxidation potential, and reduction potential for all the electrolytes (NaCl, NaOH, KOH, PVA-NaCl, and PVA-KOH). As per the results listed in Figure 2, scan rate (mV/s) returned the highest F-score across the electrolytes, therefore confirming it as the most important feature for the analysis.

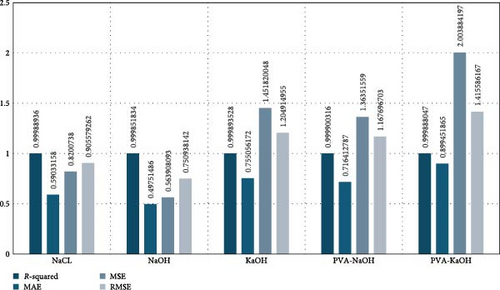
A total of 96,956 data points were considered across 5 electrolytes (NaCl, NaOH, KOH, PVA-KOH, and PVA-NaOH) and 30 different scan rates between 5 and 600 mV/s. The XGB regression model (xgb_Reg) was trained on 75% of the data and tested on 25%. A trained XGB model was used to create the simulated dataset for multiple scan rates between 5 and 600 mV/s. A detailed performance analysis indicated R-squared value of above 0.999 for all the electrolytes confirming that the simulated data mapped to the actual data with a high degree of accuracy.
Mean absolute error (MAE), mean squared error (MSE), and root mean squared error (RMSE) are crucial metrics for evaluating the performance of ML models, particularly in regression tasks. The lower value of these metrics typically indicates the better performance of the ML models. For the five electrolytes, MAE ranged from 0.497 to 0.899, MSE ranged from 0.563 to 2.00, and RMSE ranged from 0.750 to 1.415.
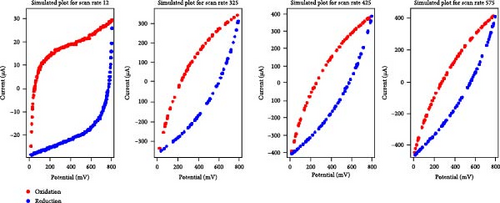
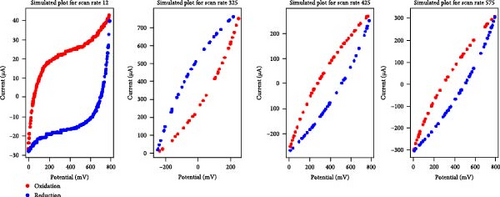
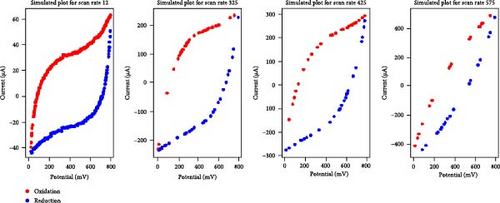
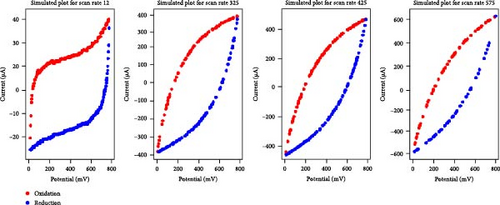
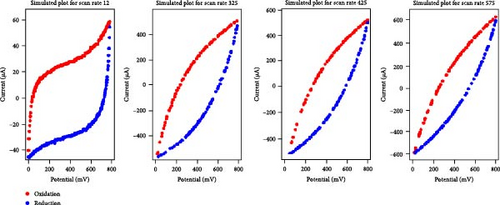
Given the high performance of the XGB algorithm, this model was applied to create synthetic data for various electrolyte and scan rate combinations, as shown in Figure 3.
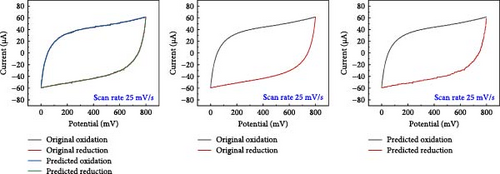
A comparative analysis of the original oxidation and reduction curves for a scan rate of 25 mV/s demonstrated a perfect match of the curve generated by the original data and synthetic data, proving the hypothesis that the XGB model can create synthetic data for various combinations shown in Figure 4a–e.
3.2. Areal Capacitance Calculator
The areal capacitance provides information about the ability of SCs to store charge per unit area of the electrode material. It is an important parameter for evaluating the performance of SCs and comparing different electrode materials or designs.
3.3. Under Curve Area and Areal Capacitance Calculation
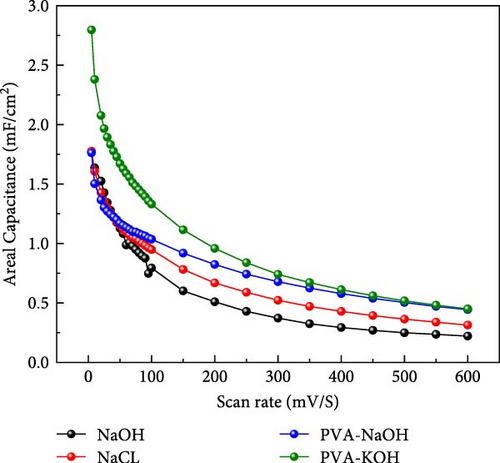
SCs are electrochemically characterized to obtain a thorough performance study of the electrode material. CV was used as an electrochemical approach to characterize SCs. The CV results at different scan rates, from 5 to 600 mV/s. The curve has a quasi-rectangular shape, especially at higher scan speeds of up to 600 mV/s. The electric double-layer behavior of electrode materials for use in SCs is also shown. Additionally, Equation (1) was used to calculate the areal capacitance from CV. Figure 5 presents the original plot alongside the predicted plot for a scan rate of 25 mV/s, comparing different electrolytes. Specifically, Figure 5a–e illustrates the results for NaCl, NaOH, KOH, PVA-NaOH, and PVA-KOH, respectively.
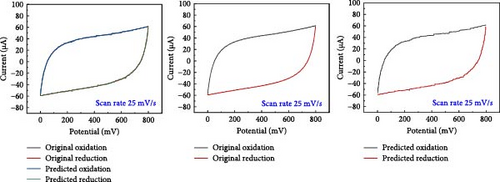
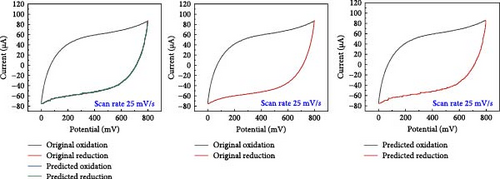
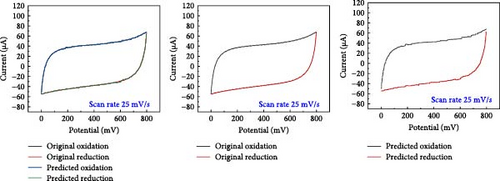
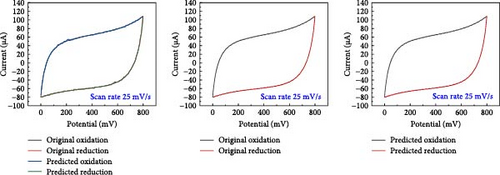
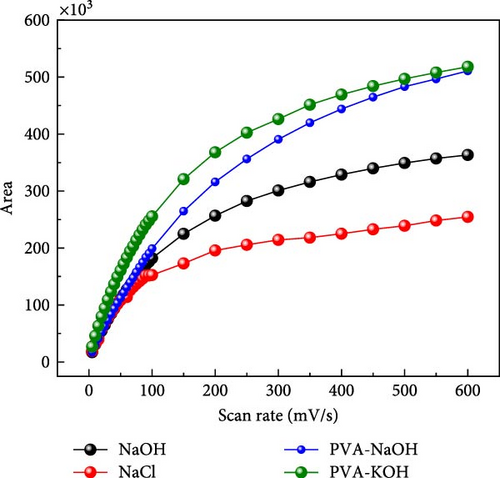
A comparison study involving five different electrolytes reveals that three are aqueous based, while the other two are gel based. The gel-based electrolytes demonstrate superior connectivity in wearable devices without any leakage issues. Specifically, the PVA-based electrolyte enhances electron penetration between electrodes, resulting in improved capacitive behavior compared to the aqueous electrolyte. The analysis involved comparing the area under the curve derived from experimental data and that predicted by a model, revealing a striking similarity in their behavior, as depicted in Figure 6. The software “Origin” was utilized for the manual calculation of areas, illustrated in Figure 6a, b. Following this manual calculation, the areal capacitance was determined using Equation (1). Figure 6b distinctly illustrates that the areal capacitance of the PVA-KOH electrolyte is 2.8 mF/cm2. Figure 6a presents a comparative analysis of all electrolytes based on the area under the curve.
4. Conclusion and Future Work
- 1.
Synthetic data with areal capacitance curves yield an R-squared value above 0.97, illustrating the ML algorithms’ ability to replicate actual CV data intricately.
- 2.
Introducing scan rate variations from 5 to 600 mV/s enhances the adaptability of the synthetic dataset in different scenarios.
- 3.
ML-enabled computation of areal capacitance helps accelerate the experimental process, facilitating the assessment of real-world and simulated datasets.
- 4.
The innovative approach improves reproducibility and validation in scientific inquiries, accelerating advancements in SC research and development.
- 5.
Exploration of various electrolytes reveals the superior areal capacitance of the PVA-KOH-based electrolyte.
The proposed model offers extensive capabilities, including predicting the area under different loads at any scan rate and calculating the areal capacitance. Future work can focus on automating the characterization cycle for the SCs.
Nomenclature
-
- SC:
-
- Supercapacitor
-
- ML:
-
- Machine learning
-
- XGB:
-
- Synthetic data, XGBoost
-
- CV:
-
- Cyclic voltammetry
-
- LIG:
-
- Laser-induced graphene
-
- GCD:
-
- Galvanostatic charging and discharging
-
- EIS:
-
- Electrochemical impedance analysis
-
- ANN:
-
- Artificial neural network
-
- RF:
-
- Random forest
-
- MEMS:
-
- Micro electromechanical systems
-
- MLP:
-
- Multilayer perception
-
- LTSM:
-
- Long short-term memory
-
- IDE:
-
- Interdigitate electrode.
Conflicts of Interest
The authors declare no conflicts of interest.
Author Contributions
Sanjeet Kumar Srivastava and Himanshi Awasthi contributed equally to this article.
Funding
There is no funding source for this research.
Acknowledgments
The authors thank the MEMS, Microfluidics and Nanoelectronics Lab, Birla Institute of Technology, Hyderabad Campus, for facilitating this research work.
Open Research
Data Availability Statement
The data that support the findings of this study are available from the corresponding author upon reasonable request.


