An Experimental and Theoretical Carbon Dioxide Capture-Based Investigation of Methyltrioctylammonium Trifluoromethanesulfonate Ionic Liquid
Abstract
An alarming elevation of anthropogenic carbon dioxide (CO2), primarily responsible for global warming and its drastic effects on climatic conditions, must be challenged on a priority basis. Various types of absorbents capture as much CO2 as possible to minimize the harsh effects of environmental and climatic changes. In this study, one such compound, methyltrioctylammonium trifluoromethanesulfonate ionic liquid (IL), was analyzed experimentally and theoretically. The COSMO-RS, a type of conductor-like screening model, is an advanced fast method to predict the thermo-physical properties of IL. It depends upon unimolecular, statistical thermodynamics, molecular structure, and conformation, which provides the required information for estimating interactions in ILs. The COSMO-RS, not dependent on data, coefficients, or parameters, was used to calculate the sigma surface, profile, and potential. These parameters are crucial for predicting high-absorbing CO2 materials, such as ILILs. Spectroscopic methods, such as Fourier transform infrared spectroscopy (FTIR), proton nuclear magnetic resonance (1H NMR), and carbon-13 NMR (13C NMR), verified the structure confirmation. In addition, spectrochemical characterization of the IL was performed using FTIR, NMR, ultraviolet–visible (UV–Vis) spectroscopy, and fluorescence. The thermal integrity of IL was measured by thermogravimetric–differential thermal analysis (TGA-DTA) over the temperature range of 323–773 K in an oxygen ambiance with a ramp rate of 283 K/min. Due to its high potential for gas absorption, as confirmed by COSMO-RS calculations, IL was investigated for CO2 absorption and desorption studies at 298 K and 4.5 MPa. The maximum CO2 absorption obtained was ~ 6.0 mmol/g, performed at similar experimental conditions. The high uptake of CO2 might be due to fluorinated anions, as CO2 has a high affinity for fluoroalkyl groups. According to a hysteresis-based classification, the hysteresis formation during CO2 absorption and desorption follows type H3, indicating the presence of both microporous and mesoporous characteristics in the sample. A detailed study of the excess Gibbs energy of sorption and the activity coefficient of the IL indicates a strong sorption capacity under moderate conditions.
1. Introduction
Global warming and climatic fluctuations are ramifications of greenhouse gases created by the emission of CO2 by using an intimidating scale of fossil fuels for energy production [1–3]. Every year, a vast amount of CO2 is emitted globally. A quick and efficient reduction of CO2 is essential to avoid the harmful effects of greenhouse gases, especially CO2 [4, 5]. Recently, literature reported that 41% of CO2 emissions are from power plants, 23% from transport, 20% from industries, 4% from building construction, and 12% from other sectors [6]. The electricity and heat produced by combustion used for various purposes are the primary source of CO2 emission [7, 8]. The alarming increase in CO2 emissions in the atmosphere has raised severe concerns worldwide regarding the need for a rapid and efficient reduction of CO2 [1–3, 9]. Precombustion, postcombustion, and oxy-combustion are three key methods widely employed to reduce CO2 emissions [10–12]. Related impurities are removed to accomplish pure methane in terms of low CO2 content emission so that methane can be used as a biomethane [13–15].
During amine-based technology, three unique and efficient types of amines, such as methyl diethanolamine (MDEA), diethanolamine (DEA), and monoethanolamine (MEA), were used for CO2 capture [16–18]. Earlier, 30% of MEA with water was considered an industrial standard for CO2 capture [19]. During CO2 uptake by MEA, the chemical reaction uses higher CO2 enthalpy, which indicates high-energy expenditure in the evolution step [20]. Utilizing an amine-based technique during embedding CO2 uptake units into the present power sector would decrease energy consumption by 25%–40% [21]. Furthermore, amine-scrubbing technology faces shortcomings such as insufficient CO2 uptake, steep absorbent volatility, instrument decomposition, and immense energy requirement-like shortcomings [22]. Economically, the MEA-based postcombustion CO2 capture method involves enormous expenditure, another drawback of amine-based technology [23]. The alternative to volatility, corrosiveness, and decomposition-based amine solvents is new stable ILs because of their unique characteristic required for efficient and cost-effective CO2 capture technology [3, 24, 25]. Recently, researchers shifted focus from amines to a new type of stable solvents, such as ILs, owing to their lower energy requirement in their regeneration stage. Green-based solvents, such as room temperature ionic liquids (RTILs), possess unique properties and are used as an alternative for amines due to their substantial positive effect on CO2 capture. Furthermore, RTILs capture CO2 and other gases, requiring less energy in the regeneration process than amine-based solvents [26]. Department of Energy (DOE) in the United States of America has set a cost target of 40 $/tCO2 for new stable, innovative generation solvents [27, 28].
Based on the density functional theory (DFT) concept, a screening conductor-like model known as COSMO-RS (COSMOtherm version 19.0.0/2019) is used to screen solvents for efficient CO2 capture [29–31]. No experimental data, coefficients, or parameters, only the molecular structure of the ionic liquid (IL) or any other compound, is the only requirement for COSMO-RS calculations [32–34]. It calculates the sigma surface, profile, phase equilibrium, activity coefficients, and sigma potentials [35–37]. The molecular conformation obtained from electronic calculations is a requirement for COSMO-RS, which only needs chemical structure data. Furthermore, the minimal data requirement for COSMO-RS makes it more desirable for ILs than thermodynamic calculations, which require multiple parameters to fit the mixture data and achieve the desired results. COSMO-RS uses statistical thermodynamics to acquire this property and understand the solubility technique, which depends upon quantum calculations. All these advantages make COSMO-RS a perfect substitute for determining surface charge density, sigma-based profile, and potential of ILs.
This work is intended to highlight several details of methyltrioctylammonium trifluoromethanesulfonate IL. This solid IL, having a melting point of 328–333 K, was chosen for the following reasons: (1) the presence of fluorinated anions is suitable for high CO2 solubility, (2) fluoroalkyl-type groups are CO2-phillic, (3) fluorine anions embedded with three octyl bulky alkyl chains and an ammonium group boost CO2 solubility. This report aims to provide a detailed analysis to understand thermal, physical, and chemical characteristics, quantitative and qualitative calculations, and rapid discovery of compounds in the IL. These measures were performed using advanced characterization techniques, including thermogravimetric analysis (TGA)/differential thermal analysis (DTA), Fourier transform infrared spectroscopy (FTIR), proton nuclear magnetic resonance(1H NMR), carbon-13 NMR (13C NMR), fluorescence, and UV–visible (UV–Vis) spectroscopy. In addition, the computational-based conductivity screening model of solvents, such as the COSMO-RS model, was utilized to examine charge density distribution, sigma profiles, and sigma potential. Quantum mechanical measurements generate these sigma profiles and sigma surfaces. These measurements utilize molecular and confirmation details as input data for the analysis. Another essential purpose of this work was to develop IL as a solid adsorbent for CO2 capture at 298 K. Reducing CO2 emissions is necessary to mitigate the adverse effects of global warming and climate change. This study examines the effectiveness of CO2 capture under high-pressure conditions, reaching pressures of up to 45 bar. These conditions are typical in gas processing applications, such as precombustion capture and natural gas purification, unlike flue gas treatment, where the CO2 partial pressure rarely exceeds 0.2 bar. It is important to note that methyltrioctylammonium trifluoromethanesulfonate is solid at 298 K, with a melting point of approximately 328–333 K. Although this study demonstrates its effectiveness in capturing CO2 under controlled laboratory conditions, its solid-state form presents practical challenges for large-scale commercialization. Issues such as solvent handling and mass transfer efficiency must be addressed. Further research is needed to explore modifications, such as eutectic mixtures or IL blends, that can maintain a high sorption capacity while achieving liquid-phase behavior at ambient conditions.
2. Materials and Methods
2.1. Adsorbent
The IL, methyltrioctylammonium trifluoromethanesulfonate was procured from Sigma–Aldrich. The IL samples were dried at 313 K for 1 h before characterization. The samples were activated by outgassing under ultrahigh vacuum conditions for 24 h at 298 K before absorption/desorption calculations.
2.2. Computational Technique
The COSMO-RS application is a cost-effective, fast, and efficient technique for predicting the physical, molecular, and thermodynamic properties of ILs [38]. This model is based on unimolecular and static thermodynamics, providing exact information that is mandatory for evaluating molecular interactions [39]. In this study, COSMO-RS, utilizing the BVP86/TZVP/DGA1 level of theory, was used to monitor charges on the surface of IL. The COSMO-RS-based model was used to calculate chemical structure in 2D/3D with proper color coding, surface charge density, sigma potential, and profile [40]. This theory for natural solvents utilizes state-of-the-art thermodynamics to explain the solubility established on the result of quantum chemical data. Additionally, these characteristics make COSMO-RS a logical choice for determining activity coefficients.
2.3. Characterization
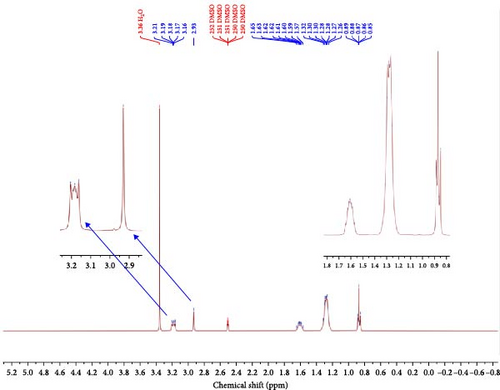
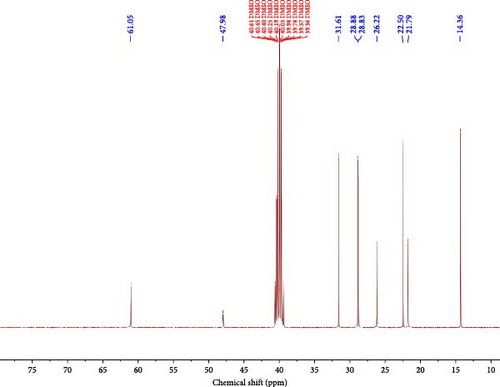
FTIR spectroscopy of the IL was studied by a Bruker ALPHA FT-IR spectrometer (Eco-ATR) using the KBr pellet technique. The wavenumber range of the FTIR spectrum of IL is 500–4000 cm−1. The 1H NMR and 13C NMR using Bruker AVANCE 400 NMR spectrometer were measured in a 5 mm precision glass NMR tube at 298 K. The deuterated solvent and internal standard used for this measurement were DMSO-d6 or CDCl3 and tetramethylsilane (TMS). In the splitting arrangement, “s” is designated as a singlet, “d” as a doublet, “dd” as a doublet of doublets, “t” as a triplet, and “m” as a multiplet. The NMR’s coupling constant (J) is expressed in hertz (Hz). The Delta software package analyzes the 1H NMR and 13C NMR patterns. The 1H NMR and 13C NMR analysis of the IL are as follows: 1H-NMR (DMSO-d6), δ, ppm: 0.87 m (9H, 3CH3), 1.29 m (30H, 15CH2), 1.61 m (6H, 3CH2), 2.93 s (3H, NCH3), 3.18 m (6H, 3CH2); 13C-NMR (DMSO-d6), δ, ppm: 14.36 q, 21.79 t, 22.50 t, 26.22 t, 28.63 t, 28.88 t, 31.61 t, 47.98 q, 61.05 t [40–42].
Thermal analysis using NETZSCH-Gerätebau GmbH, TG209 F3, was used to investigate the thermal characteristics of IL . TGA of the sample was performed using NETZSCH Proteus, thermal analysis software. Approximately 30 mg of sample was used in an experiment. Before the experiment, the IL sample was placed in a crucible loaded in a furnace. The temperature in the furnace was raised to 773 K in flowing nitrogen at a rate of 100 mL/min. The temperature was maintained at 373 K until a consistent sample weight was achieved. This process for continuing to flow nitrogen at 373 K for 1 h ensures the sample’s surface is clean before commencing the absorption experiment. The DTA results, which are associated with TGA, were obtained using Igor software. The fluorescence spectrum of the IL sample was documented on a Cary Eclipse fluorescence spectrometer (Agilent, USA) in a 1 cm cell equipped with a 150 W lamp and a water bath. The emission spectra were calculated in the wavelength range of 290–600 nm with 280 nm excitation wavelength utilizing slit width 5 nm. The fluorescence spectra were recorded in different solvents while the sample concentration of the solution was constant. The UV–Vis absorption was obtained in a T80 UV/visible spectrophotometer running from 300–650 nm at 298 K.
2.4. Carbon Dioxide (CO2) Capture (Adsorption/Desorption)
High-pressure CO2 capture measurements of IL were performed at 298 K in a customized manometric apparatus designed and built by the LMA group, also known as the isograph Quantachrome apparatus [40, 43]. Before absorption/desorption measurement, the samples were activated by being outgassed under an ultrahigh vacuum environment for 24 h at 298 K. Absorption isotherms were acquired at 298 K and 45 bar using the iSorpHP Quantachrome Instrument. The iSorp HP apparatus expands gas from a thermostat-dosing manifold of established volume into the sample cell. The apparatus automatically calculated the internal volume of the cell by utilizing a helium-expansion calibration step. The manifold’s pressure change determines the volume of the gas vented into the cell. After the equilibrium is attained, the absolute pressure in the sample cell is noted. The instrumental setup was put in an isothermal-based bath, and the internal temperature was monitored and controlled by a proportional-integral-differential (PID) composed thermostat. The Redlich–Kwong equation was utilized for each CO2 uptake experiment to determine the exact dead volume of the iSorpHP instrument. ≈200 mg of IL was taken for each adsorption experiment. The CO2 was commenced into the apparatus and maintained until equilibrium pressure was accomplished. After attaining equilibrium in the instrument, the CO2 gas was isothermally discharged into the IL sample containing a steel reactor, and the pressure decrease in the CO2 was recorded. The CO2 capture capacity of the IL sample was determined from the pressure drop using the ideal gas equation PV = nRT, where P, V, T, R, and n have their usual meaning.
3. Results and Discussion
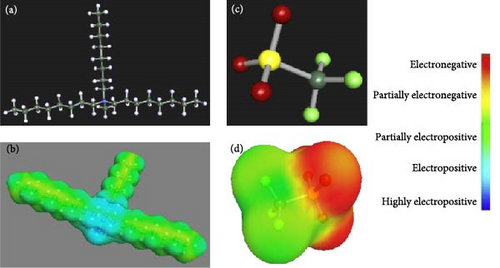
Chemical structure in terms of 2D/three-dimensional (3D) with proper color-coding along with its COSMO-RS surface charge density of IL is displayed in Figure 1. The essential parameters associated with the qualitative description of the IL are polarity, hydrogen bonding, lipophilicity, and hydrophilicity, estimated using COSMO-RS 3D sigma surface or screen charge distribution. The sigma surface comprises cations and anions with different colors, indicating the intensity of the hydrogen-bond donor, hydrogen-bond acceptor, and nonpolarity. The color scale shows the electropositivity and electronegativity of the cation and anion of IL. The blue area in the cation offers a positive charge due to acidic hydrogen, and the red surface indicates a negative charge due to fluorine and oxygen, which are highly electronegative. The sigma profile in Figure 2 shows the division of polar charges associated with the molecular sigma surface. The σ-profile displays charge densities, expressed to show the relative quantity of surface with polarity σ for a given IL molecule. The graph where ρ (s) is plotted against σ , displays how deep the molecular surface has few intervals of polarity (σ).
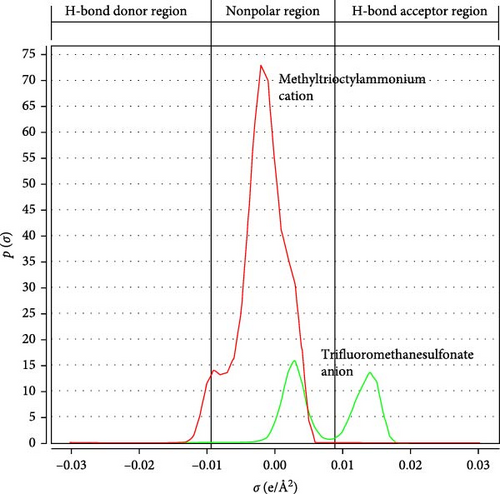
The sigma profile recorded by COSMO-RS provides more information about the effect of cations and anions in the compound. The representative σ-profile of IL shown in Figure 2 extends from −0.03 (donor) to 0.03 (acceptor) e/Å2 with a maximum spike at about −0.008 e/Å2. The σ region covering beyond + 0.01 e/Å2 and –0.01 e/Å2 are considered intensely polar with the possibility of achieving hydrogen bonds (HBs). The area between ±0.01 e/Å2 is treated as nonpolar. The highly polarized region beyond + 0.01 e/Å2 belongs to the hydrocarbon chain and methyl. Similarly, the highly polarized region beyond −0.01 e/Å2 belongs to the anion trifluoromethanesulfonate. The two peaks corresponding to the anion may be due to highly harmful oxygen and fluorine elements. Furthermore, the σ-profile indicates that the anion contributes to hydrogen bond acceptor regions, whereas the cation, due to its long nonpolar hydrocarbon chains, exhibits minimal polarity and is unlikely to participate in hydrogen bonding. The peak intensity of cation in the nonpolar region is higher than that of anion [44]. Figure 3 displays the sigma potential of the IL .
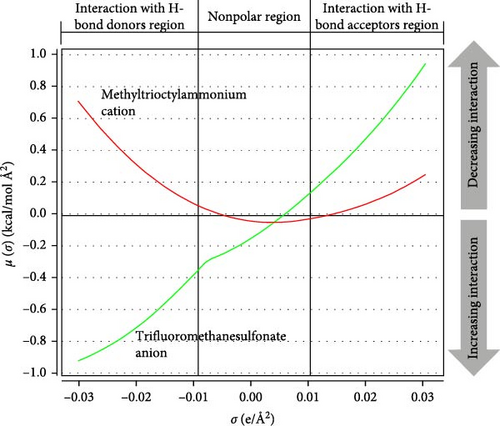
The total energy determined from the sigma potential is composed of two sections. (1) regaining free energy helps reinstate the molecule to its originality, and the energy is positive then. (2) uninhibited hydrogen bonding energy, negative in nature, because of the hydrogen bond between the hydrogen bond donor and the hydrogen bond acceptor. The final negative charge shows control of hydrogen bonding, while the final positive charge indicates the influence of free energy recovery. According to the COSMO-RS histogram, there are three main areas: (a) hydrogen bond donor beyond –0.01 e/Å2, (b) hydrogen bond acceptor beyond +0.01 e/Å2, and (c) nonpolar region between –0.01 e/Å2– +0.01 e/Å2. Regions lying below +0.01 e/Å2 and –0.01 e/Å2 are nonpolar and take part in CH–π interaction [45].
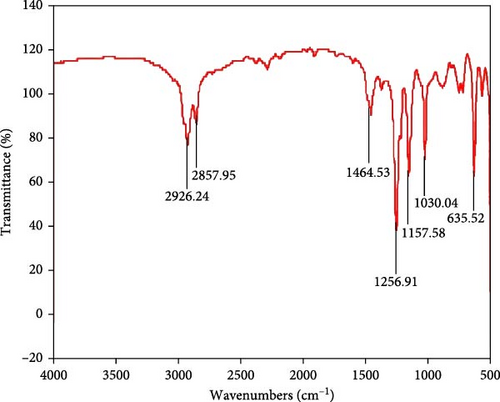
The presence of different types of mixed peaks in the plot% transmittance Vs. wavenumbers (cm–1) are presented in the FTIR, as displayed in Figure 4. As shown in Figure 4, the broad characteristic band at 2857–2926 cm−1 is ascribed to the symmetric and asymmetric vibrational state of C─H stretching in CH2 and CH3 groups. Table 1 summarizes different types of vibrational bands observed in the spectrum. The absorption bands of C─C stretching, C─H bending, C─H bending, C─N stretching, C─N bending, C─F stretching, and C─S stretching vibrational correspond to 1464.53, 1256.91, 1157.58, and 1030.04 cm−1 respectively is the confirmation of the presence of IL [46, 47]. This kind of FTIR result of the IL sample was expected, as no significant sample modification was performed before using it for different characterizations. In addition, no red-shift or blue-shift of the IL sample was observed in the FTIR spectrum displayed in Figure 4.
| Type of molecular vibrations | Wave number (cm−1) |
|---|---|
| C − H stretching of CH2 and CH3 groups | 2926.24 |
| C − H stretching | 2857.95 |
| C − C stretching, C − H bending | 1464.53 |
| C − C stretching, C − N stretching | 1256.91 |
| C − N bending | 1157.58 |
| C − F stretching | 1030.04 |
| C − S stretching | 635.52 |
The residual proton in deuterated solvent DMSO-d6 observed at 2.50–2.52 ppm is called the 1H NMR external reference. The exact positions and ambient of distinct hydrogen atoms or protons present in the IL are displayed in Figure 5 and Table 2. The 1H NMR spectrum of IL displayed characteristic distinct chemical shifts that confirm the actual structure of the IL sample. The chemical shift at 0.87 ppm shows protons associated with carbon and hydrogen in the form of the CH3 group in the structure. The broad and medium chemical shifts at 1.29–1.61 ppm show protons related to carbon and hydrogen in the form of the CH2 group. Similarly, the chemical shift at 2.93 and 3.18 ppm shows protons associated with carbon and nitrogen in the form of the CH2–CN group in the structure.
| Chemical shift (ppm) | Proton environment |
|---|---|
| 0.87 | (Medium) –CH3 |
| 1.29 | (Broad) –CH2, (broad) –CH2–CH3 |
| 1.31 | (Broad) –CH2 |
| 1.61 | (Broad) –CH2 |
| 2.93 | (Small) –CH2–CN |
| 3.18 | (Small) –CH2–CN |
The 13C-NMR spectra of IL were also performed using the Bruker AVANCE 400 NMR spectrometer with N2 as a carrier gas to settle the position and environment of distinct carbon atoms in the IL sample. The typical chemical shifts of different kinds of carbon present in the DMSO-d6 and IL are shown in Figure 6 and Table 3. Figures 7 and 8 show 13C chemical shifts at 39.36–40.61 ppm of the IL sample, which belongs to DMSO-d6. The 13C chemical shifts at 14.36, 21.79, 22.50, 28.88, and 31.61 ppm show the existence of carbon atoms in the form of –CH3, –CH2, –CH2-R and –CH2–CH2-R groups of IL . The 13C chemical shifts at 26.22, 47.98, and 61.05 ppm show the presence of carbon atoms in the form of –NCH2–CH2–, –NCH3, and –NCH2 groups of the IL sample. Furthermore, different types of carbon atoms at different ppm confirm the structure of IL .
| Chemical shift (ppm) | Type of C-atom |
|---|---|
| 14.36 | –CH3 |
| 21.79, 28.88 | –CH2 |
| 22.50 | –CH2–R |
| 26.22 | –NCH2CH2– |
| 31.61 | –CH2–CH2–R |
| 39.50 | DMSO-d6, reference peak |
| 47.98 | –NCH3 |
| 61.05 | –NCH2 |
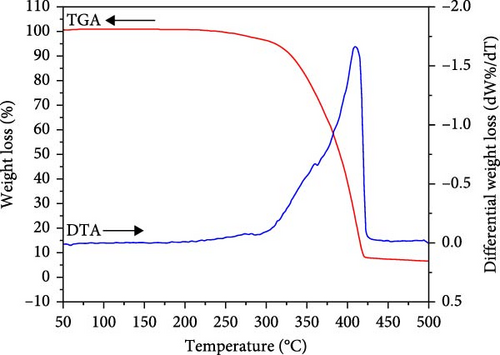
Figure 7 displays the TGA and DTA profiles of IL . The analysis is observed in an oxygen ambiance using a ramp rate of 283 K/min. The red curve in the figure corresponds to TGA, while the blue curve corresponds to the differential thermal plot of IL . The IL shows the sole monotonous drop in the weight loss profile at 623–773 K. The lone weight loss observed at ≈ 683 K is due to the single-stage decomposition of the IL sample. The observed weight loss suggests that 6.56 wt.% corresponds to residual charred material. The Tmax, that is, the temperature during which the decomposition rate becomes ultimate, is ≈ 683 K as recorded from the differential weight loss curve shown in Figure 7 (blue curve) [48]. TGA and its derivative are performed to understand the short-term thermal stability of the IL sample. The onset temperature (Tonset) of ≈588 K, which is a cross mark among tangent straight lines to the TGA curve before and postdecomposition started, is calculated to analyze the thermal stability of the IL sample [49]. Another temperature of the TGA curve, known as the starting temperature (Tstart) of ≈523 K, is usually used as a thermal degradation at a lower temperature [50]. In addition, the Tonset may not show the maximum operating temperature of the sample; in that case, Tonset may overestimate the maximum operating temperature. The water content influences thermal decomposition temperature, including Tmax and Tonset in the IL. In addition, pans (Al or Pt), heating rate, and time may also affect the decomposition temperature [51].
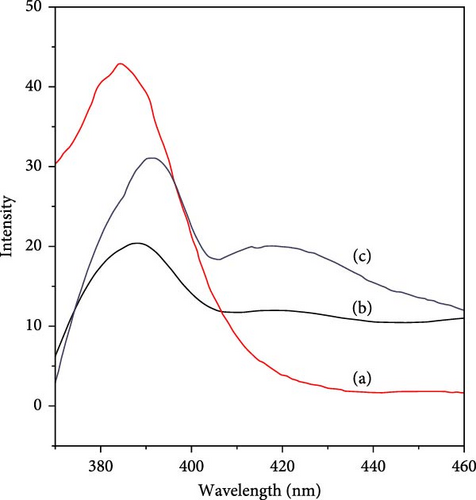
Fluorescence measurements of the IL sample were carried out using three different polar solvents, including methanol, acetonitrile, and acetone, as shown in Figure 8. The fluorescence intensity of IL shows variation in all three solvents. The fluorescence intensity of methanol is higher than that of acetone and acetonitrile. The peak intensity of these solvents is methanol > acetone > acetonitrile, which shows interaction with the IL. The emission peaks of methanol, acetone, and acetonitrile related to interaction with IL are found at 384, 391, and 389 nm, respectively. The minor fluorescence peaks at approximately 420 nm of acetone and acetonitrile were observed. The increase in the intensity of methanol as compared to acetone and acetonitrile can be attributed to the interaction of methanol with IL via cation-π-interactions and hydrogen bonding [52]. In addition, the high peak intensity of methanol suggests that the solubility of the IL in methanol may be due to fluoro-groups in the anion segment. The observed behavior of the other two solvents, including acetone and acetonitrile, in the fluorescent intensity suggests little binding interaction or solubility with the IL sample. The excitation spectra of IL match in shape and position and are almost similar to the absorption spectrum for all three solvents, indicating measured emission origins from the same compound.
The spectrophotometric study in terms of UV–Vis in the range of 300–650 nm of IL is shown in Figure 9. The absorption spectra were performed in a 1 cm quartz cell. In addition, the absorbance behavior of the IL sample in the UV–Vis range in methanol solution was monitored at RT. The IL sample shows a prominent broad absorption peak at 345 nm corresponding to π → π ∗ transition of the CH2 unit and the group of C═N and S═O under the condition.

The CO2 capture studies of the IL sample are illustrated in Figure 10. The chosen values for CO2 absorption and desorption of IL methyltrioctylammonium trifluoromethanesulfonate are listed in Table S1. The CO2 capture was carried out within a pressure range of 0–45 bar. The filled circles indicate absorption, whereas the open circles signify desorption. The CO2 capture was executed at high pressure using a static high-pressure instrument at 298 K. The Benedict-Webb-BVP Equation (mBWR) equation of state (EOS), which is an extension of the virial EOS, was used for CO2 sorption studies [53]. Helmholtz EOS for absorbate was utilized for CO2 capture measurements [40, 54]. The maximum CO2 absorption of the sample is found to be approximately 6.0 mmol/g at 298 K and 45 bar. CO2 adsorption increases with pressure touching over 6.0 mmol/g at 4.5 MPa. It was reported that CO2 uptake in the IL sample is entirely dependent on the power of bonding of CO2 with the anion of the IL, as spectroscopic and molecular simulation studies suggested. The outstanding amount of uptake of CO2 presented in this report may be due to fluorinated anions, as CO2 has a high solubility in fluoroalkyl groups [55]. It is important to note that while fluorinated ILs often show enhanced CO2 solubility, the use of fluorine-containing species raises concerns due to their environmental persistence and potential toxicity, which are independent of their thermal stability. Furthermore, it is a well-known fact that fluoroalkyl-type groups are CO2-phillic; however, the exact mechanism of this process is not well accepted yet.
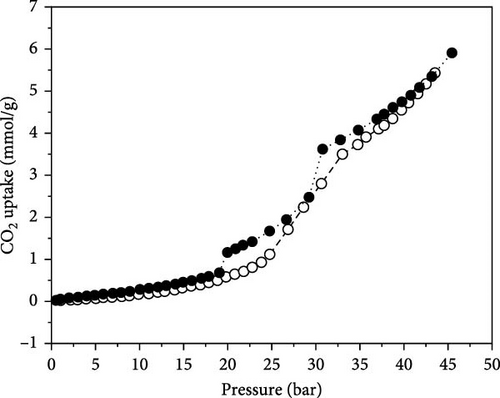
Nevertheless, many researchers have adopted the practice of embedding fluorine atoms in the anions of IL to obtain supportive bonding between CO2 and fluoroalkyl substituents in the anion. Furthermore, more fluorine atoms in anions and an ammonium group with a bulky alkyl chain group in the cation may also reinforce the absorption of CO2 in the IL. The absorption depends upon the type of CO2 interaction with the anion in the IL [56]. Klahn et al. found that increasing the length of the alkyl chain in cations improves the solubility of CO2 due to enhanced free volume and dispersion interactions. For instance, the IL [HMIM][Tf2N] shows a higher CO2 solubility of up to 0.95 mol/kg at 10 bar and 298 K, in comparison to [EMIM][Tf2N]. A lower Henry’s constant related to longer alkyl chains suggests a stronger tendency for CO2 absorption [57]. Moreover, Keskin et al. [58] reported that at 313.15 K, the CO2 solubility of [OMIM][BF4] is ~0.6 mol CO2 per mol of IL (equating to 1.0–1.1 mol/kg) at 70 bar, indicating favorable compatibility with CO2 at higher pressures. Furthermore, Gutkowski et al. [59] reviewed several studies that show ILs with fluorinated anions, notably [Tf2N]−, significantly enhance CO2 solubility. For example, [BMIM][Tf2N] achieves a solubility of around 0.8 mol/kg at 10 bar and 298 K, while [BMIM][PF6] demonstrates lower solubility, ~0.5 mol/kg under similar conditions [59]. The substituents present in the cation, besides the anion, can also affect the uptake of CO2. Zoubeik and Henni also observed the presence of bulky and longer chains of alkyl groups of cations compared to anions that absorb more CO2 [60]. The CO2 adsorption increases with bulky alkyl chain length at all pressures. In addition, at high pressure, the absorption of CO2 is significantly higher compared to low pressure, as confirmed by our results, which show more than 80% absorption at high pressure. To further reinforce our claim that the bulky alkyl chain of the IL boosts CO2 absorption. Peter et al. also found an elevation in the solubility of CO2 in ILs when the alkyl chain length group was enhanced from ethyl to hexyl [56]. Furthermore, Muldoon et al. also reported that CO2 solubility was enhanced when the alkyl chain length was elevated from butyl to octyl for ILs [54].
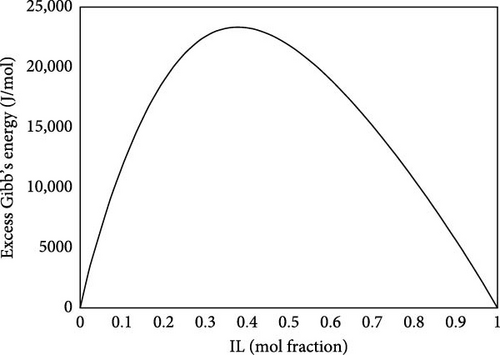
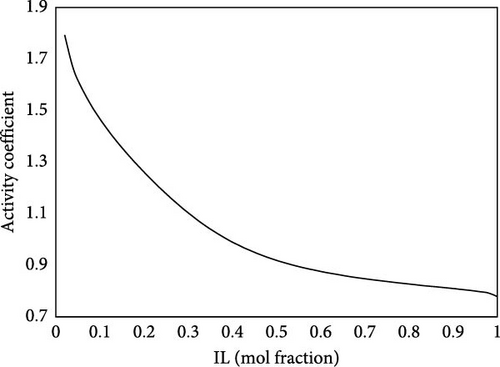
Gibb’s sorption energy can be estimated based on the sigma potentials of ILs and CO2. Figure 11 presents this energy at 298 K and 1 bar. The excess Gibbs energy of sorption refers to the deviation of the Gibbs energy from an ideal solution behavior. It accounts for the interactions between the IL and CO2 that differ from the expected behavior in a simple mixture. This information is crucial for understanding how well CO2 is sorbed and how the system behaves under varying conditions. A strong affinity suggests that the IL can effectively capture CO2, making it a suitable medium for carbon capture technologies. The stability of CO2 in the IL can lead to higher uptake capacities, which is desirable for effective gas separation processes. For desorption, as the system is in a high excess Gibbs energy due to strong interactions, achieving this condition can be challenging without significant external energy input, necessitating extreme conditions. This can also be inferred from the activity coefficients of the ILs, after the sorption of CO2, as shown in Figure 12. The activity coefficients of ILs can change significantly after the sorption of CO2. A decrease in the activity coefficient of the IL upon CO2 sorption suggests that CO2 alters the interactions within the IL. The IL activity coefficient at infinite dilution is experimentally estimated at 1.88. CO2 significantly decreases IL activity, thus indicating IL’s strong sorption capacity. The strong interactions may involve various forces, such as ionic interactions and van der Waals forces, contributing to the stability of the CO2 within the IL. Such analysis provides the basis for tailoring the best IL for sorption processes.
4. Conclusions
To minimize the effects of environmental and climatic changes produced by the high concentration of CO2 in the atmosphere, a high CO2-absorbing material such as IL was chosen. The IL m was preferred to other commercially available ILs because of its high potential to adsorb CO2 at 298 K. The chosen IL was evaluated theoretically by COSMO-RS, a conductor screening model to calculate different parameters for predicting promising absorbing materials. This model obtained various parameters, including the sigma surface, profile, and potential. The most important about the model is that no experimental data, coefficients, or parameters are required to calculate these properties. The 1H NMR, 13C NMR, and FT-IR were utilized to confirm the structure of the IL. The spectrochemical characteristics were obtained using FTIR, 1H-NMR, 13C-NMR, UV–Vis, and fluorescence. The TGA and DTA data were used to check the thermal stability over the 323–773 K temperature change in an oxygen atmosphere. The maximum CO2 absorption obtained at 298 K and an equilibrium of 4.5 MPa was ≈6.0 mmol/g. According to hysteresis-based classifications, the hysteresis during CO2 absorption and desorption for IL follows type H3, indicating the material’s microporous and mesoporous nature. The CO2 adsorption of IL increases as the pressure increases from 1 to 45 bar. These pressure conditions are more applicable to high-pressure gas processing than to postcombustion flue gas capture, where CO2 partial pressures typically remain below 0.2 bar. The Gibbs energy of sorption study shows strong affinity, indicating that the IL can effectively capture CO2, making it a favorable medium for carbon dioxide capture technologies. The activity coefficients indicate that CO2 significantly reduces IL activity, demonstrating IL’s strong sorption capacity.
Conflicts of Interest
The authors declare no conflicts of interest.
Author Contributions
Hisham S. Bamufleh: visualization, investigation, writing – original draft, software. Sami-ullah Rather and Aqeel Taimoor: conceptualization, methodology, software. Faheem A. Sheikh: methodology, writing, investigation. Yahia A. S. AlHamed: visualization, validation. Walid M. Alalayah and Usman Saeed: supervision: software, validation. Ayaz Mohamad Nawaz and Arshid M. Ali: writing – reviewing and editing.
Funding
This project was funded by the King Abdulaziz University (Grant 370-135-1433).
Acknowledgments
This project was funded by the Deanship of Scientific Research (DSR), King Abdulaziz University, Jeddah, Saudi Arabia, under Grant 370-135-1433. The authors, therefore, acknowledge with thanks DSR’s technical and financial support.
Supporting Information
Additional supporting information can be found online in the Supporting Information section.
Open Research
Data Availability Statement
Data are available on request.


