

Emerging Passive Cooling Technologies and Their Multidisciplinary Applications: An Integrative Review
Abstract
The persistent rise in temperature driven by the emission of greenhouse gases presents a pressing contemporary challenge, fostering innovative cooling techniques. Currently, passive cooling technologies have gained attention in various research fields for their effectiveness in combating heat accumulation. Compared to traditional active cooling methods, which rely on electricity or other energy sources, passive cooling significantly reduces energy consumption and electricity demand. These technologies have demonstrated the potential for temperature reductions of ~1°C–24°C, translating to substantial electricity savings of about 2–300 kWh/year. This paper uses an integrative review approach to highlight the fundamental principles and design strategies underlying passive cooling technologies, such as phase change materials, radiative cooling, and evaporative cooling. Special emphasis is placed on their potential implementation, from preserving biological materials to cooling buildings, electronics, and personal clothing. Passive cooling methods offer cost savings over time due to lower maintenance and operational costs and potentially simpler designs.
Summary
- •
The effectiveness of evaporative cooling (EC), phase change materials (PCMs), and radiative cooling (RC) varies depending on the specific application area.
- •
Hybrid cooling methods, combining two or more technologies, can significantly improve cooling efficacy and extend operational time.
- •
The m-cycle EC technique presents favorable cooling properties over direct EC systems, although it requires a complex structure for optimal flow patterns.
- •
RC techniques have a wide range of applications across clothing textiles, buildings, electronics, covering of cars, swimming pools, etc., offering a more straightforward application than other techniques.
- •
PCMs, despite their obvious limitations, their cooling effectiveness in cold chain is mostly influenced by packaging dimensions, arrangement within the box, product loading percentage, and the materials used in cold storage design.
1. Introduction
The ever-developing modern lifestyle, urbanization, and industrialization have led to a high demand for energy resources, which is expected to increase by 56% in the next two decades [1]. Current energy resources rely on electricity, natural gas, and fossil fuels, resulting in substantial energy demand and the emission of greenhouse gases, which are key contributors to global warming [2, 3]. Figure 1 shows annual carbon dioxide (CO2) emissions worldwide from 1993 to 2023 [4]. The sudden drop in 2020 can be attributed to COVID-19 restrictions [5]. In line with this report, the global temperature increased from 0.3°C to 1.2°C between 1993 and 2023, as shown in Figure 2 [6]. The persistent rise in greenhouse gases under the current economic policies will likely result in temperatures surpassing 1.5°C, making it harder to maintain warming below 2°C after 2030 [7–9]. In recognition of this, various countries have pledged and revised strategies and measures to counteract carbon emissions, aiming to limit temperature rises to below 1.5°C and possibly render the world carbon neutral by 2050 [10–13].


However, under the current circumstances of rising ambient temperature, there is a high energy demand for cooling buildings, food products, cold-chain transportation, electronics, and more, in order to maintain the modern-day lifestyle [14]. In response, researchers have developed passive cooling strategies that use water, outside air, the night sky, the earth, temperature-regulating materials, etc., to create cooler environments and reduce the high energy demands.
Passive cooling methods provide thermal comfort with minimal or no energy consumption [15, 16], thereby reducing energy demands. Additionally, they are cost-effective and require low maintenance [15, 17]. In this regard, passive cooling technologies have the potential to simultaneously reduce CO2 emissions and the energy demand for thermal cooling [18]. Among passive cooling technologies, evaporative cooling (EC) increases water vapor content and produces cool air [19, 20], and phase change materials (PCMs) absorb, store, and release heat as they change phases [21, 22]. Radiative cooling (RC) dissipates heat from inner spaces to the outer sky by exploiting infrared radiation [23, 24]. These technologies show great potential to meet high cooling demands. They effectively cool buildings for thermal comfort, reducing internal temperatures by ~5°C–10°C [15, 25]. Furthermore, they have great potential to replace active refrigeration for keeping food and biological products chilled during cold-chain transportation and domestic refrigeration, ensuring food safety even with a low power supply or during outages [26].
With the existence and documentation of different passive cooling techniques in the open literature, passive cooling has found application in various fields of thermal science and management, medicine, environmental science and engineering, building and thermal management, material science, etc., which by extension has evolved into personal, building, and battery thermal management, photovoltaic (PV), data center, flexible electronics, and roof cooling, electric vehicle cooling, graphic processing units in automobile, food and chemical preservation, etc. Previous passive cooling-related review works have focused on the development of materials (PCMs, synthetic-, polymetric-, biological-, nano-materials, etc.) for passive cooling and a compilation of passive cooling techniques and mechanisms and individual passive cooling applications. However, this work identified the gap in the literature concerning the need for reviewing scholarly works encompassing different applications of passive cooling. In addition, in-depth and updated studies on passive cooling techniques and applications in human thermal comfort, building thermal management, transportation of biological and pharmaceutical materials, and electronics with emphasis on different novel materials deployed in this concern. Conclusively, this review summarizes current technologies for passive cooling and their applications in buildings, food preservation, cold storage of biologicals and electronics, and cooling of PV panels using an integrative literature approach in which scholarly articles available in the open literature on the subject of passive cooling are utilized. Scholarly articles strongly connected to the focus of this present work, as mentioned above, are utilized.
2. Passive Cooling Techniques
2.1. PCMs
PCMs can be categorized as thermal energy stores (TESs) that use latent heat storage to achieve thermal cooling [27–29]. Ji et al. [30] revealed that by increasing the thickness of the PCMs, more heat is absorbed, and the building’s energy consumption is reduced. The mechanism of cooling by PCMs involves three stages: charging, storing, and discharging. During the charging stage, the PCMs transfer heat to the ambient air as it solidifies. In the storing stage, the PCMs have fully transitioned to a solid. During the discharging stage, the PCMs change from solid to liquid, cooling the air as it absorbs heat, thereby maintaining a constant temperature (Figure 3) [32–34]. Selecting or designing PCMs with the desired properties, such as phase change temperature (melting point), thermal conductivity, and latent heat, is crucial for suitable cooling applications. For example, building cooling typically requires PCMs with a higher melting point of ~22°C [35].

Xiong et al. [36] employed paraffin RT28HC, a commercially available PCM, to create two phase-change composites: one containing copper foam and the other with graphene nanoplatelets. The composites exhibited melting points at 27.6°C and 27.7°C, and they were intended for indoor cooling in tropical climates. The composite with graphene nanoplatelets maintained a stable temperature of 29.5°C for ~6 h, while the one with copper foam lasted for 5 h. Tong et al. [37] developed TES plates filled with commercial RT5 PCM, which have a melting point of 4.96°C, for use in real-time cold chain transportation of perishable foods. When placed in a container, the TES plates kept the internal temperature stable for 94.6 h, despite external temperatures ranging from 35°C to 13°C. This helped to maintain the quality, pH, and color of lettuce, mango, and strawberry. PCMs are widely classified as eutectic, inorganic, and organic according to their chemical composition [38–41]. Table 1 summarizes the classification of PCM, along with their advantages and disadvantages.
| Organic | Inorganic | Eutectic | |
|---|---|---|---|
| Examples |
|
|
|
| Advantages | Wide melting point range, physical and chemical stability, noncorrosive, high enthalpy of phase change, nontoxic, cost efficient, etc. [42, 43] | Have large latent heat of fusion, inexpensive, nonflammable, good thermal conductivity, relatively higher fusion heat, etc. [27] | No or little supercooling, high heat capacity, wide range of phase change temperature, etc. [42] |
| Disadvantages | Highly volatile, flammable, low thermal conductivity, large volume change during phase change, etc. [43, 44] | Poor nucleating ability, incongruent melting point, corrosive, subcooling, etc. [27, 45] | Low-thermal conductivity, leakage during phase change [42, 46] |
2.2. RC
As seen in Figure 4, RC is a unique cooling technique that dissipates heat into the sky without consuming electricity [47–49]. Atmospheric radiation outside of 4–85 μm waveband is almost insignificant, and the strong solar heat flux within the 0.3–2.4 μm waveband range makes it difficult to achieve passive daytime RC [50]. Nevertheless, to achieve daytime RC, materials with high solar reflectance (0.3–2.4 μm) and high emissivity (8–13 μm) within the atmospheric window (where the atmosphere is highly transparent) are ideal [50–53]. RC is particularly suitable for applications in energy-efficient buildings, PVs, fluid cooling, coatings, and clothing [54]. Chen et al. [55] reported dielectric microsphere coatings that induced 80 W/m2 net cooling power when their radius was 0.5 μm, with a thermal solar reflectance of 0.986 and a 300 μm thickness. Thermal-gated bilayer hydrogels loaded with aluminum oxide nanoparticles displayed a midinfrared emissivity of 0.95 and achieved temperature reductions of ~5°C [56].

Yang, Chen, and Zhang [57] produced a dual-layered material with 0.99 solar reflectance and a high emittance of roughly 0.9 in the midinfrared region, making it an ideal material for daytime RC. Fu et al. [58] developed porous aluminum oxide membranes that promoted 64 W/m2 cooling power at 70% humidity. These materials exhibited temperature drops of 2.6°C under direct sunlight irradiance (AM1.5 solar spectrum). Passive daytime RC was achieved by attaching a 20 μm thick polydimethylsiloxane film to a reflective metal substrate [59], leading to a significant temperature reduction of 3.2°C. Wang, Wu, and Shi [60] designed a polymer-based film that exhibited 0.95 solar reflectance and 0.98 emittance. The outdoor experiment with these films on a simulated house model displayed temperature reductions of 6°C–8.9°C during midday and 8.2°C at night. Moreover, under ~900 W/m2 solar intensity, an average of ~85 W/m2 cooling power was recorded. Nonetheless, RC has its limitations, such as unfavorable cooling during cold days, which can make it counterproductive for year-round application [61].
2.3. EC
While EC is similar to PCMs in that they both involve phase transitions, they are categorized separately because they operate through different cooling mechanisms. There are various types of cooling systems, and EC functions by supplying cool air to the occupants without energy consumption. It is divided into three categories: direct evaporative cooling (DEC) systems, indirect evaporative cooling (IEC) systems, and multistage (m-cycle) cooling systems [62–65], as illustrated in Figure 5. The principle of EC is that when unsaturated, hot, dry air comes into contact with water, the water begins to evaporate, cooling the air while increasing its relative humidity (RH) [19, 66, 67]. EC systems serve as an excellent replacement for active air conditioners, which currently consume more than 20% of building energy [19, 64]. Abdullah et al. [68] suggested that simplified and hybrid EC systems are the best options for future developments to better understand the current energy, economic, and environmental implications, allowing them to penetrate the market more effectively. Most recently, Khan et al. [69] developed a hybrid EC system that employs both DEC and IEC channels, demonstrating a cool capacity of 16.8 kW. Furthermore, the reported system achieved significant air temperature drops of 24.8°C with a maximum coefficient of performance (COP) of 35.2. In a recent review by Cengiz, Kayri, and Aydın [70] carbon disulfide, diethyl ether, and dichloromethane were identified as viable alternatives to water in cooling PV systems due to their low boiling points, provided that safety measures and proper precautions are taken.


3. Application of Passive Cooling Techniques in Various Industries
3.1. Passive Cooling of Buildings
With the rapid expansion of urbanization and industrialization, deforestation rates have increased, leading to imbalanced gas management, heightened energy demand, and climate change [71–73]. The building sector accounts for over 33.33% of global energy consumption, making it the largest energy-consuming sector and contributing significantly to CO2 emissions [74]. Ali et al. [75] and Waqas and Ud Din [76] reported that ~40% of global building energy is used for heating and cooling in residential and commercial sectors. It is estimated that by 2050, buildings’ air conditioning systems will consume around 6200 terawatt per hour (TW/h) of electricity globally [77]. In response to this challenge, researchers have developed new free-cooling strategies to reduce the high energy demand in the building sector. Some of these strategies include architectural design elements such as optimizing the window-to-wall ratio, incorporating shading, planting trees near buildings, using daytime RC, natural ventilation, and integrating cement plaster or paint with PCM [61, 75, 78–81].
3.1.1. Evaporative and RC in Building Cooling
Xu et al. [23] developed nanocomposite hydrogels that combine evaporative and RC for passive thermal comfort in buildings. The hydrogels, which contained ZrO2 and polytetrafluoroethylene nanoparticles, exhibited swelling ratios of 292% after 24 h, which was 2.5 times lower than that of the hydrogel without nanoparticles. This suggests that encapsulation of nanoparticles significantly reduced the water absorption capacity of the hydrogels. Additionally, solar reflectance decreased from 0.95 to 0.8. Nevertheless, a high-value atmospheric window emissivity (~0.92) was maintained, which was attributed to the high emissivity of water.
The developed hydrogels were termed NPs/NADES@PAAm/PVA, and their outdoor cooling efficacy when covering copper sheets was compared to that of swollen NPs/NADES@PAAm/PVA and hygroscopic NPs/NADES@PAAm/PVA at ambient temperatures of 35°C. Temperature drops of 6.2°C, 3.6°C, and 2.9°C were reported for swollen NPs/NADES@PAAm/PVA, hygroscopic NPs/NADES@PAAm/PVA, and NPs/NADES@PAAm/PVA, respectively, as shown in Figure 6a. The higher temperature drops exhibited by swollen and hygroscopic hydrogels can be attributed to combined evaporative and RC mechanisms. Additionally, when wood chips were covered with these hydrogel formulations, the following temperatures were captured using infrared images: 41.9°C, 28.1°C, 27.3°C, and 24.3°C, corresponding to temperatures recorded at the center of the uncovered wood chip, NPs/NADES@PAAm/PVA, hygroscopic NPs/NADES@PAAm/PVA, and swollen NPs/NADES@PAAm/PVA.


Using a custom-made house model, as depicted in Figure 6b, the experiment was conducted under direct sunlight with an average outdoor temperature of 35.2°C and an internal house temperature of 34.5°C. A higher temperature drop of 6.2°C was observed when the roof was covered with swollen NPs/NADES@PAAm/PVA compared to other experimental groups. The findings presented in this paper suggest that these hydrogels have significant potential for enhancing thermal comfort and building cooling due to their high solar reflectance and atmospheric emissivity.
More recently, Liu et al. [82] reported aerogels for RC of buildings and investigated their energy-saving potential across various cities. Using the setup as seen in Figure 7a, during the day, the aerogels demonstrated a 9.15°C temperature drop, 97% emissivity, and 96% solar irradiation reflectance. These aerogels maintained their cooling effect through the night, resulting in a 5.28°C temperature drop. To evaluate the energy-saving efficacy of the aerogels, the researchers built a house model with a baseline roof covered with aerogels (A) and another model with both the roof and walls covered with aerogels (B), as seen in Figure 7b. As shown in Figure 7c, the aerogels exhibited efficient energy savings across all tested cities, with model B achieving higher energy savings compared to model A. Notably, high energy savings were observed in Abu Dhabi, with potential electricity savings of 21.02 kW/m2/year for model A and 24.69 kW/m2 for model B. These results confirm that the aerogels induce greater energy savings in cities with elevated temperatures and high cooling demand. Additionally, these findings suggest that these materials align with global policies aimed at reducing carbon emissions and limiting global warming to below 2°C.


3.1.2. PCMs in Building Cooling
Yang et al. [83] investigated how the shape of panels “pyramidal and tetrahedron (Figure 8a)” encapsulated with PCMs affects the thermal performance and phase change behavior of the loaded PCM. The tetrahedral panels exhibited a longer phase change time (353 min) compared to pyramidal panels, which lasted for only 292 min. They further discovered that the distance between the panel base and ceiling surface significantly affects the cooling time of the materials. As the distance increased, both the tetrahedral and pyramidal panels exhibited a decrease in melting time. Figure 8b illustrates different protrusions-to-base ratios of 30%, 50%, and 70% PCM proportions. The melting time decreased with an increase in PCM proportions, indicating enhanced heat transfer in the PCM panels due to the larger contact surface area with ambient air. The findings suggest that the heat transfer was also influenced by the design and dimensions of the panels, with the cooling effect being less dominant at 30% protrusion compared to 70%. Rešetar et al. [84] developed a transparent ceiling prototype with dendritic geometry, loaded with PCM macroencapsulations, and compared its indoor cooling efficacy to that of spherical encapsulations [84], as depicted in Figure 8c. When comparing the cooling efficiency of the dendritic and spherical geometries, which were both loaded with bio-based PCM, temperature drops of 2.86°C and 0.92°C were observed, respectively. These findings demonstrate that in comparison with spherical-shaped ceiling prototypes, dendritic-shaped ceiling prototypes have higher passive cooling potential when encapsulated with PCM.


In a study by Nor Ali et al. [85], PCMs were integrated with gloss paint and applied to the external wall (concrete panel and cement plaster). This resulted in a significant decrease of the external temperatures by 9.5°C, followed by temperature drops of 9.2°C, 8.1°C, and 5.4°C for walls covered with gloss paint, wrapped PCMs, and blank walls, respectively. These findings confirm that wall coatings are crucial in heat transfer and maintaining the building’s internal thermal comfort in hot climates. The experimental setup included: (a) a concrete panel covered with cement plaster; (b) a concrete panel integrated with wrapped PCMs followed by plastering; (c) a concrete panel covered with cement plaster and coated with gloss paint; and (d) a concrete panel covered with cement plaster and painted with a mixture of eutectic PCMs and gloss paint.
During the night, the painted walls exhibited higher internal temperatures compared to the external environment, suggesting an ineffective release of the heat stored during the day. Notably, the gloss-painted walls displayed a +4.7°C temperature difference, making the internal space hotter and uncomfortable. This indicates that while the gloss-painted walls successfully induce thermal cooling during the day through solar reflectance, they could not release the stored heat effectively at night into outer space.
Piselli et al. [86] investigated the synergistic energy-saving potential of the Knauf PCM SmartBoard combined with natural ventilation in various climates across Italian cities. Integrating PCMs in the external building walls and the innermost layer of the roof resulted in efficient energy savings of 300 kWh/year in mild temperatures. Additionally, they reported that both temperature-controlled natural ventilation and night-time ventilation significantly improve the charge–discharge cycles and thermal energy storage of the integrated PCMs. Ong et al. [87] reported the cooling efficacy of mortar panels painted with a combination of 20% glass bubble (GB) and microencapsulated phase change material (MEPCM) for buildings in tropical regions. The dual performance exhibited by the 30% MEPCM-20% GB mixture resulted in temperature drops of 7°C during outdoor experiments, while temperature drops of 3.2°C were observed in lab-based experiments.
Tunçbilek et al. [88] externally embedded walls with 3-cm PCMs loaded with different concentrations of aluminum oxide nanoparticles (1, 2, 3 vol%) to evaluate their energy-saving potential for buildings. The increase in the concentration of nanoparticles negatively impacted the energy savings of the PCMs. The PCMs containing 1 vol% of nanoparticle showed a 0.6% reduction in energy consumption for heating. However, this was significantly lower than the energy savings demonstrated by pure PCMs, which achieved a 37.5% reduction for heating, corresponding to 20% annual energy savings. This implies that improving thermal conductivity using aluminum oxide nanoparticles is not ideal for building wall applications.
Maytorena et al. [89] reported a hybrid rectangular earth-to-air heat exchanger (REAHE) for cooling extreme desert temperatures. The model consisted of REAHE assisted by PCM and a ceiling room covered with PCM, and they realized that this model achieved 33% temperature drops. Desirable cooling efficacy was achieved when the PCMs were placed on top of the ceiling with a thickness of 2 and 1.5 cm. Zhang et al. [90] reported a hybrid cooling technique employing a cool roof coupled with PCMs and reported it to lower the heat entering into rooms by 52.9% and indoor temperatures by 6.6°C, showing the best energy-saving effect. Ji et al. [30] reported that encapsulation of PCMs outside the building wall and roof increases the energy-saving efficiency compared to internal encapsulation, meaning that the PCMs play an adiabatic role.
3.2. Transportation of Biological and Pharmaceutical Agents
The cold-chain transportation of biological products ensures their safety and maintains their optimal conditions during transit from the manufacturer to healthcare facilities [91]. The ideal temperature range for the cold-chain delivery of most biological agents is between 2°C and 8°C, with some requiring deep-freeze conditions at −70°C [92–96]. Therefore, to sustain the optimal conditions of biologicals, passive cooling technologies that can sustain the cold-chain supply between 2°C and 8°C for several hours are urgently needed to simultaneously limit CO2 emissions and promote long-term delivery of biological and pharmaceutical agents.
3.2.1. PCMs in Transportation
Gan et al. [97] evaluated the factors influencing the cooling efficacy of a commercially available PCM (RT5HC) for vaccine transportation using a portable cold box storage. Two cold storage boxes: one cubic and the other cuboid shaped, both with equal internal volumes, were used to assess their cooling performance. The internal temperature was measured at different box sections, as depicted in Figure 9a. Using the same layout of PCM bottles (Figure 9b), the cubic box exhibited ~25% longer cooling times than the cuboid box, likely due to its smaller surface area. Additionally, the number and arrangement of PCM bottles inside the box had a significant impact, as more PCM bottles presented longer cooling times in both cold storage boxes. Additionally, the impact of different layouts was evaluated using eight PCM bottles distributed inside the box in four different layouts (Figure 9c). Using a cuboid box, layout 4 exhibited the longest cooling times, maintaining the temperature between 2°C and 8°C for ± 45 h, followed by layout 3 at an average of 40 h on all temperature collection points.


However, they noted that vertical section III presented the lowest cooling time across all layouts compared to sections II and I, suggesting that there is a higher heat transfer from section III compared to section I. Additionally, vertical section III had higher exposure to solar radiation compared to section II, the middle section, and section I located at the base and receiving minimal solar radiation/sunlight. These variations in cooling performance across the sections can be attributed to the differences in direct solar exposure and its influence on heat absorption and dissipation. Lastly, they investigated the impact of vaccine load relative to the number of PCM bottles (Figure 9d) and discovered that the cold storage capacity increased with an increase in vaccine loading from 25% to 100%. The findings presented in this work suggest that proper arrangement of the PCMs during cold-chain transportation is crucial. Additionally, the loading efficiency of PCM bottles should correspond to the vaccine load to avoid excess weight in the box, waste, and a reduction in effective cold storage capacity. The positioning (vertical or horizontal) of the PCM bottles inside the container also displays a feasible impact on their charging and discharging times [36].
Fauer and Cremaschi [98] thermally coupled two PCMs with different phase change temperatures (0°C and 4°C) to prevent temperature abuse. These materials were developed for the storage of vaccines between 2°C and 6°C. As shown in Figure 9e, the PCMs were loaded in a plastic box, and 0.9% NaCl saline bags were used to evaluate the cooling effect of the materials. The reported PCM maintained a cooling effect of saline bags, keeping the temperature around 2°C for 6–18 h. After 18–24 h, this effect intensified before stabilizing again at around 6°C for 15 h. The initial pause at 2°C can be attributed to the melting point of water (PCM 1), while the second pause at around 6°C is due to the PCM coupled with water. These findings demonstrate that using thermally coupled PCM with two different melting points can potentially prolong storage time compared to using a single PCM.
Zhao et al. [99] developed a eutectic-based PCM using tetradecane (TD) and lauryl alcohol (LA), incorporating expanded graphite (EG) to enhance its thermal conductivity. Among the various formulations prepared, the one with a ratio of 66 : 34 (TD:LA) exhibited the lowest freezing point, a solidification process lasting 9280s, and a stable transformation platform. This formulation was selected for further experimental tests, and its phase change temperature was recorded at 4.3°C with 0.2737 W/(m‧K) thermal conductivity and 247.1 J/g latent heat of phase change. The addition of EG at a 15 : 1 ratio (TD/LA:EG) significantly improved the thermal conductivity to 0.9657 W/m‧K, while maintaining the phase change temperature, with the latent heat of phase change slightly reduced to 245.1 J/g. After 400 cycles of charging and discharging, the materials showed excellent stability, with a latent heat of 243.1 J/g and a slight increase in phase change temperature to 4.9°C, making it suitable for cold chain storage.
As shown in Figure 10a, the vaccine cold storage box with dimensions of 200 × 95 × 55 mm was designed. Reagent tubes filled with yogurt were placed in designated holes to ensure consistent temperatures for each vaccine reagent tube, reduce transportation temperatures, and minimize fluctuations during storage. The TD/LA:EG formulation was filled into cold storage plates and the cold storage box, then frozen at −20°C for 12 h before being placed in the heat preservation box, as depicted in Figure 10b. Prior to the experiment, the yogurt-containing reagent tubes were precooled and placed in the holes of the vaccine cold storage box. During the experiment, the ambient temperature ranged from a maximum of 40.6°C to a minimum of 21.4°C, with an average dynamic temperature of 28.8°C. The cold storage box (Figure 10a) maintained the target temperature range of 2°C–8°C for an average of 52.36 h, which was significantly longer than the individual cooling times measured for the top plate (44.05 h), side plates (43.86 h), and bottom plate (45.31 h). This extended time can be attributed to the combined insulation effect of the cold plates (Figure 10b), which slowed the temperature rise inside the box. The insulation time for the yoghurt-containing reagent tubes was reported to be 50.02 h. Additionally, the viscosity and pH of the yogurt remained unchanged compared to pre-experimental values, confirming effective preservation. Figure 10c shows images of the reagent tubes used. These results suggest that the developed PCMs and their arrangement within the cold storage equipment are promising for preserving temperature-sensitive products and vaccines during extended transportation.


Cong et al. [100] developed PCMs using ternary salt-based solutions for cold chain applications. Using sodium chloride (NaCl) as the base solution, three formulations were prepared: NaCl–KCl–H2O, NaCl–Na2SO4–H2O, and NaCl–NaNO3–H2O solution, with KCl, Na2SO4, and NaNO3 solutions employed as additives. The combination of these solutions significantly lowered their phase change temperature, which was recorded as −21°C, −23°C, and −27°C for Na2SO4–H2O, NaCl–KCl–H2O, and NaCl–NaNO3–H2O solutions, respectively, compared to the base material or PCM-additives NaCl/H2O (−21°C), NaNO3/H2O (−18°C), KCl/H2O (−11°C), and NaSO4/H2O (−4°C). Additionally, the reported ternary salt solutions exhibited fusion heat values ranging from 150 to 260 kJ/kg. These findings suggest that the materials can be effectively employed for freezing applications in cold chain transportation with temperatures between −20 and −30°C.
3.2.2. Hybrid Evaporative-RC in Transportation
Xu et al. [101] developed hydrogel packaging materials, employing combined daytime radiative and EC to minimize the degradation of enzymes and polyphenols during noncold chain transportation, as shown in Figure 11a. The hydrogel packaging described was created by combining polyacrylamide and polyvinyl alcohol polymers, then filling it with zirconium dioxide and polytetrafluoroethylene nanoparticles. These hydrogel packaging materials displayed high solar reflectance, desirable swelling behavior, and strong atmospheric emissivity to realize daytime radiative and EC synergistically. The hydrogel packaging materials were tested under different humidity and temperatures to study the daytime radiative and EC potential. As shown in Figure 11b–f, when the RH was kept at 30%, the NPs@PAAM/PVA hydrogel exhibited temperature drops of 11.7°C at an ambient temperature of 40°C followed by 10.3°C, 8.2°C, and 7.9°C when ambient temperatures were 35°C, 30°C, and 25°C, respectively. These results signify that the higher the ambient temperature, the higher the hydrogels’ daytime radiative and EC. However, an increase in RH significantly inhibits the cooling effects of the hydrogels as lower temperature reductions are observed, as shown in Figure 11g,h. Figure 11i–k shows the temperature drops of amber, aluminum foil, PAAM/PVA, and NPs@PAAM/PVA compared to those of the blank at an outdoor experimental temperature of 32°C and 30% RH. It can be noted that vials packaged with NPs@PAAM/PVA exhibited the highest temperature drops compared to other groups. Moreover, NPs@PAAM/PVA hydrogel significantly preserved the contents of anthocyanins and trypsin solutions, showing minimal degradation as compared to other treatment groups, as shown in Figure 11l,m.


3.3. Human Body
The rise in global warming poses a threat to outdoor workers and athletes [102–105], including cricket players who often compete in hot, dry conditions while wearing protective gear like pads and helmets, which can cause heat discomfort. A paper by Omara, Mohammedali, and Dhivagar [106] recommended conducting ergonomic assessments, utilization of solid–solid PCMs, and determining the optimal quantity of PCM usage. In another study, Rahimi et al. [107] reviewed recent passive cooling techniques for wearable devices, as shown in Figure 12a–k. Xu et al. [108] suggested incorporating hybrid PCMs with different phase change temperatures for cooling garments and improving thermal comfort. Wan, Fang, and Udayraj [109] found that hybrid personal cooling clothing provided better thermal comfort and cooling performance compared to approaches using only air ventilation fans or PCMs. Liu et al. [110] developed a RC material for potential application in wearable devices and reported it to provide 10.35°C subambient temperature reductions during daytime hours from 13 : 00 to 16 : 00. Additionally, the material showed strong RC activity, with emissivity of 0.9163 and solar reflectivity of 0.9465.


Li et al. [111] designed pearl-string-like microfiber films (PCZ8-ES) via electrospinning with fiber diameters ranging from 0.1 to 0.8 µm, as shown in Figure 13a–d, for RC of wearables. These films exhibited 94.9% emissivity and 98.1% average solar reflectance. The films further displayed a self-cleaning function and good moisture permeability, exhibiting 79 W/m2 average RC power and 6.1°C ambient temperature reductions. Figure 13e–l shows the experimental application of the microfiber films (on the left) compared to a protective cloth (on the right side) attached to a human’s cotton T-shirt as viewed under infrared when exposed to direct sunlight. During the experimental period from 11 : 00 to 13 : 00, the films achieved a thermal comfort level by decreasing the outside temperature by 9.2°C, with the protective cloth showing −7.1°C compared to the T-shirt, as shown in Figure 13m. Geng et al. [112] discovered that PCMs with a suitable melting temperature and high latent heat could enhance body cooling efficiency.


3.3.1. RC in Personal Cooling
Zhang et al. [113] recently developed self-cleaning nanofiber membranes (SNM-PTFE) for potential use in body thermal cooling applications. These nanofiber membranes demonstrated excellent stretchability, flexibility, and breathability, as depicted in Figure 14a–e. Additionally, they exhibited an average pore size of 1.0 μm, 95.8% midinfrared emissivity, and 95.4% solar reflectance. Outdoor experimental results revealed that the nanofiber membranes reduced the subambient temperatures by 14.4°C and provided a 9.5°C temperature reduction under direct sunlight in natural weather conditions. As depicted in Figure 14f,g, covering a house model and a car model with SNM-PTFE led to temperature reductions of 2.8°C and 15.3°C, respectively, compared to uncovered models. Moreover, midinfrared imaging of human arm skin covered with SNM-PTFE versus cotton revealed a −3.9°C temperature difference compared to cotton and a 6.4°C reduction compared to uncovered skin (Figure 14h). These findings suggest that the nanofiber membrane offers excellent cooling performance, making them promising for clothing materials on sunny days.

Polyethylene-based textiles exhibited ~1.6°C–1.8°C temperature drops on the covered skin area, with 80% emissivity, and maintained good stability after washing [114]. Photonic-engineered textiles with 95.8% emissivity and 91.7% solar reflectance exhibited ~4.4°C temperature reduction compared with cotton textiles [115]. Chen et al. [116] developed chitosan-based textiles with 82.3% and 95.6% solar reflectance and emissivity, respectively, as wearable textiles. These textiles displayed great comfort by showing high breathability, strength, and flexibility. Moreover, when compared to cotton, they exhibited 11.2°C temperature drops, with cotton showing −5.4°C during the day. The daytime and night-time power savings demonstrated by the textiles were recorded at 95.7 and 103.3 W/m2, respectively. A study by Pan and Zhu [117] revealed that encapsulation of aluminum oxide nanoparticles in silk can effectively improve the cooling efficiency of natural silk fabrics, showing 8°C temperature reduction compared to natural silk. The high-temperature difference is linked to the high solar reflectance induced by the aluminum oxide nanoparticles, leading to high heat dissipation.
Feng et al. [118] developed a transparent iridescent coating using cellulose nanocrystals and coassembled it into commercial textiles for personal cooling. The coating exhibited 75% transparency, 95.2% solar reflectivity, and 96.5% emissivity, resulting in high RC efficiency (119 W/m2). They found that the color of the textiles had no significant impact on the cooling efficacy of the textiles, though a notable difference was observed when using cotton cloth, as shown in Figure 15a. Additionally, the coated textiles achieved a 15°C temperature reduction under direct sunlight irradiation and exhibited excellent self-cleaning and hydrophobic properties. Zeng et al. [119] developed a metafabric textile characterized by high solar reflectivity (92.4%) and emissivity (94.5%) for passive daytime cooling [120]. A human body covered with the metafabric showed approximately a 4.8°C temperature drop compared to the one covered with commercial cotton textiles. Furthermore, the metafabric displayed desirable breathability, waterproofness, and mechanical strength, as depicted in Figure 15b–d.


3.4. Electronics
Recently, there has been a notable rise in the utilization of cloud computing, big data applications, and mobile internet, increasing incidents of devices overheating and even exploding [121, 122]. Researchers predict that heat flux levels in consumer and commercial electronics will gradually exceed the 100 W/cm2 threshold [123, 124]. This growing challenge has created an urgent need for cooling technologies that offer high-temperature uniformity, rapid cooling rates, and substantial cooling capacity to reduce energy consumption and prevent overheating [125]. Recently, various passive cooling techniques, such as using PCMs, air cooling with finned heat sinks, liquid cooling with various nanofluids, etc., have been of interest [126]. Nanofluids, in particular, have shown promise as effective coolants for addressing the high cooling demands of electronic technology [127, 128]. Li et al. [129] reported a cold-fog direct EC system for the relative cooling of data centers. They found that ideal air conditions occurred when the RH was under 40% at 35°C temperatures, lowering the air temperatures to less than 27.6°C and keeping the RH below 80%.
3.4.1. Evaporative and RC in Electronics
Liu et al. [130] investigated sorption-based EC materials for the thermal management of electronic devices, particularly state-of-the-art 5G base stations. Their study revealed that finned heat sinks achieved temperature reductions of up to 20°C and delivered an impressive cooling power of 602 W/m2 compared with the original device in both the simulation and experimental results. Temperature reductions of 5°C–8°C were observed when using a well-developed base station [130]. Zeng et al. [119] developed a moisture thermal battery (MTB) coated with a superabsorbent hydrogel for the passive cooling of electronics. This MTB enhances the cooling of electronics by utilizing water evaporation’s high latent heat and exceptional thermal conductivity during peak periods, while during off-hours, it absorbs atmospheric moisture to store it as water. The reported MTB exhibited a record-high heat transfer coefficient of around 1000 W/m2 K with a thermal capacity of ~200 kWh/m2 for EC. Meanwhile, Mu et al. [131] developed a smart color-changing hydrogel for passive cooling of electronic devices. Compared with findings from other researchers, the reported hydrogels induced a cooling effect of 20°C in solar cells. Additionally, the hydrogels managed to cool the central processing unit of a smartphone after being used for 1 h by ~12.9°C. Table 2 illustrates various applications of passive cooling technologies across different fields.
| Phase change materials | ||||
|---|---|---|---|---|
| Application | Phase change temperature | Temperature difference | Product | References |
| Cooling of downhole electronics | 80°C | 1.59°C | 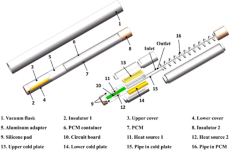 |
[132] |
| Passive building cooling | — | 2.22°C | 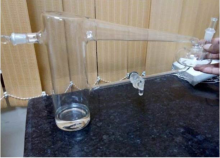 |
[133] |
| Cold supply in vaccine refrigeration | 2–8°C | — | 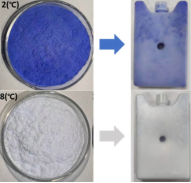 |
[134] |
| Vaccine cold-chain logistics | 2.08°C | 1.7527 W/m‧K | 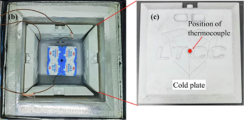 |
[135] |
| Cooling of portable electronics | 32.5°C | 8.8°C/21 W/m‧K | 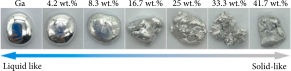 |
[136] |
| Electronic chip thermal management | 62.5°C | 23°C |  |
[137] |
| Evaporative Cooling | ||||
| Application | Heat flux | Temperature difference | Product | References |
| Computing device cooling | 75 kW/m2 | 11.5°C |  |
[138] |
| Building cooling | — | ~13°C |  |
[139] |
| Thermal regulation of PV and water harvesting | 1000 W/m2 | 7–16.18°C | 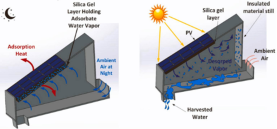 |
[140] |
| House cooling | — | 10.2–12.9°C | 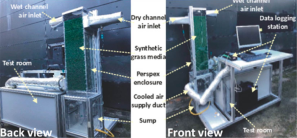 |
[141] |
| Radiative Cooling | ||||
| Application | Reflectance and emissivity | Temperature difference | Product | References |
| Thermal building comfort | ± 94% | 12°C |  |
[142] |
| Personal cooling fabrics | 96% and 85.7% | 5.2°C | 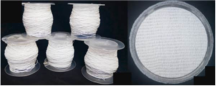 |
[143] |
| Outdoor personal cooling | 90.2% and 98.1% | 6.5°C |  |
[144] |
| Outdoor personal comfort | 98.67% and 98.63% | 8.8–14.7°C |  |
[145] |
4. Conclusion and Future Perspectives
This review may not encompass all the available emerging passive cooling technologies due to access issues, variations in experimental setup, and the fast-paced nature of research in this field, resulting in inconsistent conclusions. Nevertheless, this paper has reviewed various passive cooling techniques across different research fields. In terms of experimental evaluations, the focus was primarily on the materials, design, optimization of existing cooling systems, melting temperatures, and geometry of these passive cooling techniques. The cooling effects of EC, RC, and PCMs vary depending on the area of application. However, applying two hybrid cooling methods could potentially enhance cooling efficiency for longer durations. PCMs are most effective in passive refrigeration systems, with building cooling and wearables as subsequent applications. The key factors influencing cold storage with PCMs include the size of the PCM packaging relative to the cold storage box, the arrangement of the PCMs within the box, the product loading percentage, and the materials used to construct the cold storage box. Although PCMs have great potential for use in building cooling, they are often limited by leak issues. As a result, using PCMs in coatings or mixing them with paint has proven to be the most effective approach for application in building cooling. The distance of PCMs from the building ceiling and their geometry should be carefully considered to enhance their cooling capacity. Additionally, implementing dual-phase change PCMs with different melting points can potentially extend the product’s usability. Alternatively, RC is vital in efficiently cooling buildings with minimal restrictions. Incorporating walls and roofs with RC materials has been proven to save electricity and promote optimal thermal cooling. Moreover, RC has gained employment in the design of cooling textiles for personal cooling, with these textiles exhibiting self-cleaning properties, flexibility, and breathability, making them suitable for large-scale applications. However, the mechanical strength, emissivity, reflectivity, and self-cleaning properties of the RC textiles need improvement to extend their lifespan. On the other hand, EC materials offer the potential to significantly reduce energy consumption, leading to electricity savings and a reduction in CO2 emissions. The m-cycle EC technique offers more favorable cooling properties compared to DEC systems but achieving the ideal flow pattern requires complex construction. Overall, the EC system shows potential for use in cooling buildings, electronics, and wearable devices. Despite the advancements made in passive cooling technologies, there are still numerous opportunities to develop new cooling materials that can address issues related to environmental sustainability, energy needs, and reduction of greenhouse gas emissions. These innovations could involve utilizing discarded waste to synthesize potential passive cooling materials. In conclusion, passive cooling materials should be designed with large scalability, low cost, environmental and economic viability, durability, and commercial or market appealing in order to align with global policies aimed at limiting CO2 levels and maintaining temperature increases below 1.5°C.
Nomenclature
-
- PCM:
-
- Phase change material
-
- RC:
-
- Radiative cooling
-
- EC:
-
- Evaporative cooling
-
- COP:
-
- Coefficient of performance
-
- PV:
-
- Photovoltaic
-
- CO2:
-
- Carbon dioxide
-
- TES:
-
- Thermal energy storage
-
- DEC:
-
- Direct evaporative cooling
-
- AM1.5G:
-
- Spectrum used in terrestrial solar cell research
-
- IEC:
-
- Indirect evaporative cooling
-
- 5G:
-
- Fifth generation
-
- MTB:
-
- Moisture thermal battery
-
- Units
-
-
- °C:
-
- Degrees celsius
-
- W/m2:
-
- Watts per square meter
-
- TWh:
-
- Terawatt hour
-
- kW/h:
-
- Kilowatt per hour
-
- W/m‧K:
-
- Watts per meter Kelvin
-
- µm:
-
- Micrometer.
Conflicts of Interest
The authors declare no conflicts of interest.
Author Contributions
Xhamla Nqoro was responsible for the conceptualization, investigation, and writing–original draft and editing. Thabo Hasheni and Solomon Giwa were responsible for investigating and writing–original draft and editing. Raymond Taziwa was responsible for the supervision, conceptualization, reviewing, writing, funding acquisition, and editing. All authors have read and agreed to the published version of the manuscript.
Funding
No funding was received for this research.
Open Research
Data Availability Statement
Data sharing is not applicable to this article as no new data were created or analyzed in this study.

