Cross-Border Cooperation to Mitigate Wake Losses in Offshore Wind Energy: A 2050 Case Study for the North Sea
Abstract
Offshore wind energy is integral to Europe’s climate and energy goals, with plans to install 500 GW of capacity by 2050. However, wake effects, which involve reductions in wind speed and energy yield caused by upstream turbines, pose a significant efficiency challenge, particularly in dense wind farm clusters in the North Sea. This study examines the implications of large-scale wakes, focusing on cross-border effects and mitigation strategies. Through an assessment of the kinetic energy budget of the atmosphere (KEBA), it identifies wake-induced yield reductions of 30% for the German Bight in the North Sea, with half of these being attributed to the cross-border accumulation of wakes. The findings demonstrate that redistributing wind farm capacities across borders could reduce wake losses to 18%, thereby enhancing energy yield. This could prevent the equivalent of about 8 GW offshore wind generation capacity being lost due to wakes and reduce the levelised cost of electricity. This study highlights the importance of cross-border collaboration and sea basin wide planning to optimise wind farm placement, enhance production efficiency, and ensure the economic viability of offshore wind energy.
1. Introduction
Offshore wind energy is expected to be a central pillar in Europe’s efforts to achieve net-zero targets and secure a reliable power supply for the future [1]. With higher capacity factors compared to its onshore counterpart [2], a contribution to a more balanced energy mix [3], and improving economic viability [4], offshore wind farm development has recently accelerated across the continent [5]. Along with recent geopolitical developments, it is for the reasons stated above that the latest pledges of the EU member states, Norway, and the United Kingdom have increased to nearly 500 GW by 2050 [6].
In the past, wind farm development has been focused on maximising wind energy resource utilisation. While this allowed to reach high amounts of full load hours (over 4000 full load hours [FLH]) per year for modern offshore wind farms situated in good locations [7], it also lead to increasingly centralised and large clusters, some reaching several gigawatts [8]. With the majority of wind farm development still ahead (37 GW in operation in January 2025 [5]), and an unequal distribution of offshore wind potentials and available sea space [9], countries with high energy demand but limited sea space might be compelled to over exploit their domestic potential. Already today, existing wind farms in Europe exhibit peak installed wind power capacity densities exceeding 14 MW km −2 in some cases (e.g., in Belgium and Germany), with the majority falling within the range of 5..6 MWkm−2 [10] (c.f. Figure 1). Future projections suggest this trend will continue, with high power densities expected in regions with limited offshore renewable energy potential (e.g., Germany [11]) and lower densities in regions with ample offshore renewable resources (e.g., Denmark, Norway [12] or the Baltic States [13]).
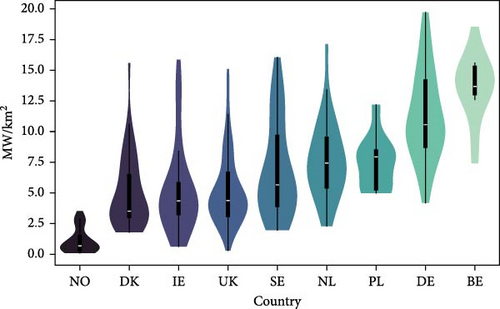
This could result in inefficiently dense spacing of wind farms with respect to the natural refreshment of kinetic energy in the atmosphere compared to its depletion by wind farms [14]. It exacerbates a phenomenon known as wake effect [15] that is likely to evolve from an individual challenge for wind farms into a regional scale, where clusters of wind farms impact each other, even across jurisdictional borders [16, 17] and up to a scale, where turbine performance is affected more by upstream wind farms than by other local turbines [18].
While wake losses are extensively studied at the level of individual wind farms or clusters, regional and cross-border effects have only recently begun to gain attention [19, 20]. This growing interest is also driven by concerns of wind farm developers that the assumed capacity factors for both existing and future wind farms may be overestimated, partly due to the insufficient accounting of cross-border wake effects [21, 22]. Moreover, regulatory concerns have been raised regarding the construction of new wind farms in one country as this may be perceived as “wind theft” for already existing wind farms in countries being placed further downwind [23].
In other words, wake is both a challenge inside wind farms with respect to optimal turbine spacing [24] and operation [25], and a challenge for adjacent and distant wind farms, should they be placed within a similar corridor of wind direction. This analysis is mainly concerned with the latter one and is linked to the discourse on wind resource assessments [26]. The purpose of this paper is to broaden the scope of existing wake loss assessments by substantially widening the focus from individual wind farms and their immediate neighbours to a regional, cross-border perspective. It aims to facilitate the offshore energy system planning of the future by applying a tangible, yet sufficiently accurate workflow on the quantification of wake losses caused by large-scale offshore clusters and discussing means to mitigate them.
The following question is addressed: How is the expected energy yield of offshore wind farms towards 2050 affected by wake losses both within and across national jurisdictions and to what extent can cross-border alignment of installed wind farms mitigate these losses?
- 1.
Quantifying possible implications of the national offshore wind ambitions on the expected energy yield at the example of the German Bight in the North Sea—one of the most pertinent regions for large-scale wake assessments.
- 2.
Disentangling national and cross-border contributions to wake losses and discussing mitigation options.
- 3.
Expanding a previously validated workflow on the kinetic energy budget of the atmosphere (KEBA) to a sea basin-wide perspective.
The remainder of this paper is structured as follows. Section 2 provides an overview on existing work on the study of wake losses in the context of large scale offshore wind development and derives the approach of this study. It is described in Section 3 and applied in a case study of the German Bight in the North Sea in Section 4. Model limits are discussed in Section 5 along with an outlook to further research before a conclusion in Section 6 closes this report.
2. State of Work on Large Scale Offshore Wake Analysis
The following section introduces relevant evidence for the occurrence and magnitude of wake losses for offshore wind farms and motivates the cross-border relevance of the matter. In a second step the existing literature on the matter is briefly summarised to derive and introduce the methodological approach of this work.
Wake primarily refers to the natural phenomenon where wind passing through turbine blades slows down due to the momentum transfer from the air inflow to the rotor. This process also increases the degree of turbulence and wind shear which is driven by the mixing effect of the rotor’s movement [15]. In this way, upstream wind turbines act as resistants, reducing the remaining wind power potential for downstream turbines within their wake. Besides reduced energy yields, the fatigue load on downstream wind turbines also increases due to the turbulence that causes vibrations [27] and due to wake meandering, which causes downstream turbines to repeatedly switch between free flow and wake conditions [28]. While wake is not a challenge exclusively known for offshore wind, it can persist for longer distances over the sea surface compared to conditions on land and still notably impact distant wind farms, since atmospheric stratification is generally more stable compared to onshore [29].
2.1. Evidence of Wake Losses
In Europe, the study of wake losses involving in situ measurements [17], optical and grid infeed measurements [30], satellite analyses [31] as well as theoretical simulations [32] has been most pronounced in the eastern North Sea (mainly Denmark and Germany). But there is also evidence for Baltic Sea offshore wind farms [33]. The reason for this focus is historically tied to the commissioning of the first wind farms in these areas, which were, at that time, also the largest offshore wind farms exhibiting the most distinct wake effects (e.g., Horns Rev I in the Danish North Sea and Nysted in the Danish Baltic Sea) [31]. While these areas remain the centre of offshore wind farm development, a significant uptake of offshore wind can be seen in other areas as well. The map in Figure 2 reveals, for the current projections towards 2050, that about 30% of the offshore capacity in the North Sea could be located within the same wind corridor stretching from the southwest to northeast. Consequently, wake losses will increasingly become a matter of inter-wind farm (cluster) interaction, as is also reflected by recent research [20, 34–36].
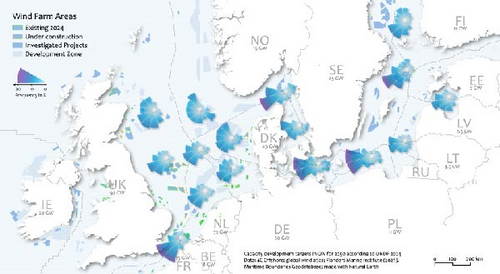
Within wind farms and close behind them (i.e., downstream in the main wind direction), losses in power generation due to wake range from 10% [31, 37] to 30% [38]. The wake length behind wind farms (defined as the distance at which the wind speed has recovered mostly compared to a free-flow wind) reaches 50 km on average [17], with maxima between 70..100 km being reported in [32, 39]. Taking into account the position of the designated wind farm areas (c.f. Figure 2), these findings underscore the importance of a long-distance and indeed cross-border perspective on wind resource assessments under wake conditions.
2.2. Quantitative Assessments of Wake
The study of wake losses is as old as the construction and operation of (onshore) wind turbines [40–42] and some of the early-stage models are still being used today in refined configurations (e.g., the model of [43] is being deployed in established open software such as Floris [44], Foxes [45] and PyWake [46]). In the context of offshore wind, the attention to this topic has risen in parallel to the ramp-up of power capacity and growing wind farm sizes [19, 26]. Whilst one stream of analyses focuses on engineering problems such as (experimental) optimisation of turbine and blade design [47], a wealth of literature focuses on the development and improvement of analytical (kinematic) wake loss models for the simulation of wake losses with the goal to optimise the layout of turbines to improve production efficiency and reduce material fatigue [48, 49]. Another stream of analyses is referred to as field models as they are based on computational modelling fluid dynamics. They are most complex as they simulate the regional weather and climate (i.e., at mesoscale) along with the entire flow in a given wind farm (e.g., the weather research and forecasting model by Skamarock et al. [50] as applied in [17, 18, 51, 52]).
Intensity and length of the wake are highly dependent on atmospheric conditions such as wind speed, direction, ambient temperature and stratification [51]. In conjunction with various possible turbine layouts, the wake analysis of an individual wind farm quickly becomes complex, even for modest wind farm sizes [53]. It is for this reason that most existing studies remain at a local to regional level by considering groups of adjacent wind farm clusters. Only few research exist that adopt a more holistic approach, covering entire sea basins [32].
2.3. Approach of This Study
For the importance of a cross-border perspective on wake as derived from the previous considerations, this study entertains a large-scale analysis approach. It takes the system planner perspective, that is, the high-level interactions of wind power capacity allocation at sea, annual energy yield and maritime spatial planning are of interest. Such an approach is justified by the fact that the allocation of wind farms and their grid connection is usually not determined bottom-up by individual wind farm developers but instead pre-investigated and centrally planned by maritime planning authorities and national regulators.
The analysis strikes to find a balance between numerical accuracy, modelling complexity and applicability in a larger energy system planning context that needs to be concerned with a wealth of other complexities such as regulatory challenges [23], spatial planning [9], and economic feasibility of offshore infrastructure (both, wind farms and transmission systems) [54]. In contrast to the existing literature, the focus here is on providing a broader description, emphasising the cumulative effects of all wind turbines within a region in depleting the kinetic energy of the boundary layer, rather than concentrating on individual turbines and incomplete mixing. The goal is to achieve a first-order estimate, which, while not as precise, remains sufficiently simple to be adopted by a broader range of system planners and researchers from other disciplines. This approach offers a transparent method, grounded in physical concepts, to estimate regional wind energy potentials for a relevant future scenario (c.f. Section 4).
The framework previously introduced in [55] is found to be a good fit for such a contribution and is developed further in this work. The next section details the methodological setup before applying it to a practical case study.
3. Assessment of the Kinetic Energy Budget of the Atmosphere Across Borders
This analysis computes regional-scale wind energy resource potentials that explicitly account for the wind speed reductions and lower yields due to wake losses. To do so, the KEBA is examined [55]. The objective of the KEBA model is to deliver a straightforward and transparent, yet physically grounded, approach for estimating wind energy potentials across various scales for a given set of neighbouring regions. This model aims to replicate the wind speed reductions observed in more complex numerical simulation models (such as [50]) and is proven to be accurate as demonstrated in [56–58].
KEBA calculates an effective wind speed within an environment of wind turbines (i.e., a bounding box of air volume that stretches from the sea surface high up to the atmospheric boundary layer) by considering all energy influxes and removals as illustrated in Figure 3. It utilises information regarding the unaffected (free-flow) wind speed that enters the environment in conjunction with several meteorological parameters (e.g., drag coefficient) as well as turbine characteristics (number and density of turbines, rated capacity, rotor-swept area, power coefficient, as well as cut-in and cut-out velocities) to derive predictions of wind speed reductions and electricity yields. Its simplicity enables an implementation in a spreadsheet, which is provided in Kleidon and Miller [55] along with a detailed overview of the model sets, parameters and variables and how these are specified or computed, respectively.

3.1. Expansion of the Existing KEBA Model
The box-like representation of kinetic energy budgets enables modular expansions to assess multiple regions. This work extends the KEBA workflow to evaluate wake effects not just for an isolated set of wind turbines but rather for the coupling of several sets, as depicted on the right side of Figure 3. The horizontal outflux of energy from the first box, resulting from dissipation, electricity production, and some refreshment through mixing, serves as the influx for the second box (aligned with the prevailing wind direction). This process continues similarly for injection into subsequent boxes. The coupling of boxes is achieved by using the computed outflow wind speed of one box as an input wind speed for the next one. Other parameters, such as turbulence levels and increased downward momentum fluxes downstream, are not transferred between boxes. Moreover, the model assumes stationary conditions, that is, only average values for longer time intervals (e.g., annual energy yields) can and will be discussed. Ultimately, the common limitations of top-down wake analysis approach like the KEBA analysis apply as discussed in [59].
In the context of the North Sea case study being introduced in Section 4, the three coupled boxes represent the exclusive economic zones (EEZs) of the Netherlands, Germany and Denmark (without Skagerrak and Kattegat) respectively. The coupling is setup in a southwest → northeast direction, resembling the prevailing wind direction in this corridor (as illustrated in Figure 2 with data provided by Davis et al. [60]). To take into account weather conditions in which the wind direction is different, the frequency of these weather conditions is calculated based on historical records. It is subsequently used as a weighting factor fred for the energy yield results. The areas where the boxes adjoin each other are set at a width of 170 km, while the height is fixed at 700 m [55] and the length is a variable parameter to represent different deployment intensities in the three respective EEZs (i.e., installed capacity and density).
This model enhancement enables the investigation of two phenomena. First, it allows for the disentanglement of internal wake losses caused by wind farm clusters inside national jurisdictions (i.e., within a single box) from the cross-border wake losses that accumulate across adjacent wind farm clusters (i.e., between two box boundaries). Secondly, it introduces a new possibility for optimisation, shifting the focus from minimising wake losses locally to identifying the joint optimum for electricity production across neighbouring countries. This optimisation is achieved by reallocating some generation capacity between different regions to determine the global optimum for production, considering both internal and cross-border wake. Both phenomena are assessed with the help of a case study in the next section.
4. The Case of the North Sea
The North Sea is at the centre of offshore wind development in Europe, both historically [61] and in the future [62]. In the German Bight alone (jurisdictions of the Netherlands, Germany and Denmark), a designated offshore wind capacity of 173 GW is planned by 2050 [6]. Considering that the three countries’ EEZs are faced with very different spatial constraints for the allocation of offshore wind farms (and resulting power densities to satisfy national development targets) [9], makes this region a relevant case to assess for cross-border wake losses and possibilities to mitigate them.
4.1. Scenario Setup and Input Data
As part of this analysis, three scenarios are investigated. Scenario one is denoted as the “base case,” resembling the continuation of current planning of wind farm capacities and respective densities towards 2050. This planning status is a result of maritime spatial planning and pre-investigations by national planning authorities that define wind farm development areas following a public consultation process. This paper takes the current state of planning as an input and relaxes it in two alternative scenarios to discuss wake mitigation measures from a spatial planning point of view.
A first relaxation is applied in scenario two. It involves the spreading of wind farms domestically within each of the countries’ EEZs to achieve lower power densities and less shading. In other words, it is assumed that additional space is dedicated in the sea to install the targeted national offshore wind generation capacity by 2050. This can either be achieved by reducing the space for other maritime interests or through the adoption of co-use [63], co-location [64] and co-existence [65] of wind farms with other activities. While this is a rather optimistic assumption for Germany [66], in the Dutch and Danish waters it could be achieved more easily [58, 67].
For scenario three, a redistribution of offshore wind capacity between Germany and Denmark is investigated. While the total generation capacity target of both countries is kept constant, some wind farm capacity is moved with the objective to maximise the total energy yield (hence the shown ranges in Table 1). Note, that the system planning perspective of this work does not allow a concrete backtracking of actual wind farm (projects) being under consideration for such a redistribution. Instead, the calculations are meant for an illustration of the general effect.
| Scenario | Offshore wind capacity (GW) | ||
|---|---|---|---|
| NL | DE | DK | |
| 1. Base case | 72 | 66 | 35 |
| 2. More space | 72 | 66 | 35 |
| 3. Redistribute | 72 | 0..101 | 0..101 |
Two different box configurations are setup for this analysis to replicate the power densities accordingly. While width and height are kept constant, the length is varied, to achieve the respective power densities per country and scenario. The dimensions are calibrated based on the spatial analysis in [9] and summarised in Table 2. Moreover, the boxes are simulated both, in a coupled and in an isolated case (c.f. Figure 4)1 to allow for a disentanglement of the national versus the cross-border contribution towards the total wake loss. The isolated setup assumes a “fresh” free-flow wind resource entering each box individually is if there were no upstream interference, while the coupled setup propagates the (reduced) wind resource exiting one box into the subsequent one. The isolated box approach further allows to compute a reference situation for all three scenarios with no wake occurring, which allows to have a common denominator to compare the numerical findings with.
| Country | Boxes for scenario 1 | Boxes for scenarios 2 and 3 | ||||||
|---|---|---|---|---|---|---|---|---|
| Density (km2) | Width (km) | Length (km) | fred | Density (km2) | Width (km) | Length (km) | fred | |
| NL | 6.8 | 170 | 62 | 0.54 | 1.3 | 170 | 314 | 0.66 |
| DE | 11.7 | 170 | 33 | 0.54 | 2.3 | 170 | 168 | 0.75 |
| DK | 7.6 | 170 | 27 | 0.69 | 1.3 | 170 | 292 | 0.67 |

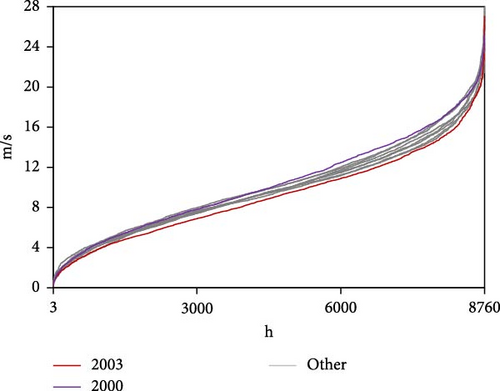
The wind resource is simulated based on 10 years of re-analysed wind velocities from 2000 to 2009. It is retrieved from the Copernicus data platform [68] (ERA5 reanalysis, 100 m altitude, three-hourly resolution for the area 3..8 °E and 54..57 °N). Refer to the appendix Figure A1 for the wind speed duration curves of all climate years. The prevailing wind direction for this box setup and chosen climate years is southwest (as indicated in the map of Figure 4). The frequency of this south-westerly wind direction is represented with the weighting factors fred for each box as listed in Table 2. The remaining parameters for the turbines (including power curves) and other coefficients remain unchanged to previous KEBA simulations in [55]. Note, that existing wind farms (adopting diverse wind turbine types) are also part of the studied boxes but not explicitly modelled, since the entire EEZs is modelled as a single box with a homogeneous distribution of uniform turbines.
4.2. Wake Loss Impact on FLH and Energy Yield
Wake directly influences the effective wind velocity for downstream wind farms, which can be witnessed indirectly through its long-term impact (e.g., for a full year) through changes in FLH as well as annual yield in electricity generation. Figure 5 depicts the findings for the former one by comparing perfect conditions (offshore wind farms operating without wake effects) with simulated wake conditions for each of the three scenarios. Note that the geographical map is chosen for easier comprehension of the results, while the underlying KEBA analysis considers the three EEZs as uniform rectangular boxes only (c.f. previous section).
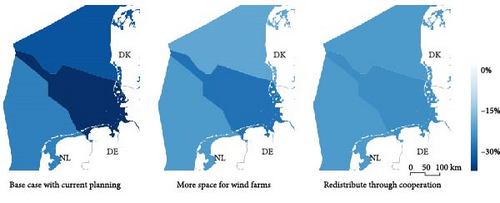
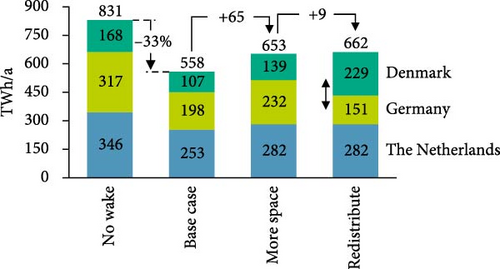
In the base case, which involves current spatial and capacity planning being followed towards 2050, wake losses are found to lead to an average FLH reduction of 30% in the German Bight. This reduction in FLH also reduces the annual yield, which is shown in Figure 6 for the three scenarios (again in comparison to no-wake conditions). The delta between the “perfect” no-wake and base case simulation results for the three regions suggests a relatively smaller reduction in yield due to wake within the Dutch EEZs compared to the EEZs of Germany and Denmark. This observation can be attributed to increased power densities in the latter regions (c.f. Table 2) as well as cumulative wake effects across borders.
4.3. Disentangling National and Cross-Border Effects
Figure 7 disentangles both effects for the base case simulations. For the Netherlands (left column), the total reduction in FLH is solely explained by national wake, as the simulation does not account for upstream offshore wind farms south of the Netherlands being located in the British or Belgian part of the North Sea (c.f. map in Figure 2). For the German EEZ (middle column), the national contribution to the total wake loss remains predominant, yet a significant additional impact from cross-border wake is evident. In Denmark (right column), this ratio converges; although the nationally created wake is smaller due to lower power densities (c.f. Figure 1 in the introduction), the accumulation of upstream cross-border wake contributes significantly to the total loss.

For the capital-intensive investment in offshore wind farms, any reduction in yield directly impacts the economic viability of the projects (commonly assessed in levelised cost of electricity, e.g., in [69, 70]). The findings underscore that neglecting the cross-border accumulation of wake effects and their contributions to the total reduction in FLH can significantly underestimate the expected yield, thereby distorting economic assessments.
4.4. Towards a Theoretical Minimum of Wake Losses
Spreading out the wind farms inside each of the EEZ achieves a smaller FLH reduction from 30% in the base case down to 25% in scenario two (c.f. Figure 5) and has the potential to increase the energy yield by 65TWh (c.f. Figure 6). This should be regarded as the theoretical limit for wake loss mitigation within national jurisdictions, since it is constrained by other interests in the usage of maritime space in the sea. For Germany, this mitigation limit is simulated to be 27% of FLH reduction—a finding which is consistent with previous analyses [71].
Further reducing wake losses necessitates a more effective mitigation of cross-border accumulation. This analysis explores a strategy referred to as redistribution. It involves relocating some generation capacity from the German EEZ to the northeast into the Danish EEZ. The rationale for this redistribution is twofold: Firstly, it positions some of the generation capacity further downstream in the predominant wind direction, thereby reducing their contribution to total wake losses, as the cross-border accumulation is distributed over a greater distance. Secondly, this redistribution decreases the wind power density in German waters, enhancing the potential for wind speed recovery.
Both effects visibly reduce wake losses, as illustrated by the lighter shades of blue in the right map of Figure 5. The results for this third scenario demonstrate that wake losses could be reduced to an 18% decrease in the average number of FLH. This indicates that while wake losses can be mitigated through more intelligent spatial allocation of wind farms, they cannot be completely eliminated. Notice in Figure 6, how the share of offshore wind power generation shifts between Denmark and Germany from scenario two to three, resulting in an overall yield increase, whereas the generation in the Netherlands remains constant as it is not included in this co-optimisation exercise.
Depending on the actual spatial constraints to realise lower wind power densities (scenario two) or a cross-border redistribution (scenario three), these energy yield savings can translate into an equivalent of about 8GW generation capacity that is no longer being lost in the wake. In other words, with a similar magnitude of wind farm investment and material intensity, an electricity production that is equivalent to the entire Belgian offshore fleet of 2050 [6], is prevented from getting lost in the wake when wind farm development is coordinated stronger across borders.
Figure 8 investigates this notion further through a theoretical wake loss minimisation exercise, aiming to determine the optimal allocation of a given total offshore wind farm capacity between Germany and Denmark. The graph summarises the annual yield for all possible capacity allocation shares of 101GW of offshore wind power among the EEZs of Denmark and Germany.
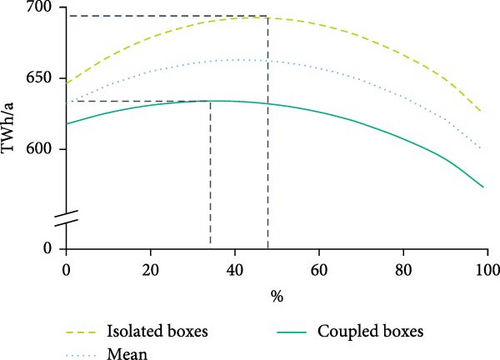
In a purely national observation of wake losses (i.e., without coupling of boxes and thus no propagation of long-distance wake from German into Danish waters), the optimal allocation in this theoretical exercise is achieved with ~44 GW installed in Germany and 57 GW in Denmark (dashed line). This allocation differs by 22 GW from the current political targets, which were not established with explicit consideration of cross-border wake impacts. When accounting for cross-border cumulation of wake (solid line), the optimum shifts further towards reducing capacity in Germany and increasing it in Denmark. Notably, the optimum in this case is flatter, necessitating a careful interpretation of the exact capacity results.
5. Implications, Limitations and Further Research
The analysis results show that cross-border optimisation of wind farm capacity allocation can reduce (but not eliminate) the impact of wake losses. Both assessed scenarios do, however, involve a range of complexities such as spatial (re-planning) of wind farm development areas and the identification of (additional) cross-border transmission corridors for the required grid connections. Additionally, the chosen KEBA methodology involves a range of limitations. Both aspects are discussed in this section.
5.1. Spatial Planning Perspective on Cross-Border Wake Loss Management
A redistribution of wind farm capacity across jurisdictions involves two elements, namely the selection of wind farm areas to be shifted and the identification of a grid connection from the new areas to shore. The underlying question is whether an increase in annual yield due to lower wake losses outweighs the additional effort in connecting the capacity from different locations (i.e., potentially longer cable runs increasing the costs). A spatial analysis is conducted as a post-processing to scenario three to investigate this further.
The map in Figure 9 shows the estimated power densities in the offshore wind designation areas towards 2050 for the German Bight of the North Sea. It can be seen, that the areas with highest densities are indeed located in the German EEZ, while areas just north in Denmark depict much lower power densities. In scenario three, the redistribution of wind power capacity entails a cross-border transfer of ~15 GW. Consequently, the regions exhibiting the highest wind power density in the base case (brightest shades of yellow) are selected for this analysis (marked with dark squares). Offshore wind capacity from these regions is redirected to designated areas in Denmark that demonstrate the lowest densities in the base case (yellow circles). Subsequently, a shortest path search in a geographical information system (applying the model of [9]) determines the connection paths for both scenario one (“Base Case,” pink lines) and scenario three (“Redistribution,” blue lines) to arbitrarily selected German onshore nodes (red triangles).
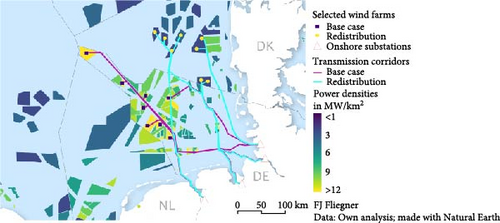
The total corridor length required to connect the redistributed wind farms from Danish waters (2480 km) is slightly greater than that of the base case positions in German waters (2320 km), reflecting an increase of ~6% in this hypothetical scenario. With standard cost assumptions for offshore transmission cables with HVDC technology [72] the levelized cost of electricity (LCOE) for the studied wind farms including their grid connection is computed. It is found that the increase in FLH that is achievable through this redistribution outweighs the investment cost increase for longer cable runs. It results in a 17% reduction of LCOE compared to the base case (refer to the appendix Table A1) for intermediate calculation steps). The calculation example, therefore, demonstrates that a redistribution of wind farm areas could be economically viable, it does however not assess other complexities that are involved in the cross-border connection of wind farms between two countries, as this has not been done so far.
5.2. Limitations of the Studied Approach
The KEBA box approach assumes a homogeneous distribution of offshore wind farms within the boxes. This is a simplification from reality (c.f. power densities in Figure 9). Therefore, only average wake losses can be computed for entire EEZs as opposed to detailed wake assessments for individual wind farm clusters. A comparison to literature values does, however, reveal that these average values are not significantly different from results being obtained in more detailed simulations [56].
The chosen top-down simulation approach further assumes very large wind farms (with indefinite length), as it does not assess individual turbine interactions. For the expected large sizes of individual wind farm clusters in the future (up to and beyond 2GW), this is considered a reasonable simplification. The model does, however, not account for blockage effects that can occur upstream of such large wind farms and effectively reduce the wind speed entering the wind farm [73, 74]. At the same time, wind speeds are assumed equal across the entire box height. While this is a necessity of the methodology, it prevents this model approach to assess the interactions of the wind farm clusters with upper layers of the atmosphere. At some point the offshore wind farms can be expected to have larger-scale effects in the atmosphere because the wind farms effectively change the roughness of the ocean over large areas [20]. The authors refer to Emeis [59] for a comprehensive discussion of such limitations to top-down wake assessment models.
Additionally, it should be considered that the management of the maritime space is subject to a multi-stakeholder process, where the national planning authorities are in the lead. Although the topic is gaining importance (as can be found for Germany in recent publications such as [71]), a mere redistribution of wind farm development areas purely on wake mitigation considerations is unlikely given the interdependence with other rights of way in the sea. A recent investigation of the German federal agency of environmental protection also revealed that the national potential of additional wind farm space via co-use and other measures is limited [66]. Eventually, wake loss mitigation is not solely a spatial planning (optimisation) problem but involves a range of further measures that need to be considered. The following section discusses this further.
5.3. Other Measures to Mitigate Wake Losses
Regardless of the exact capacity allocations found in this analysis, spatial planning is found to effectively reduce wake losses, especially when aligned across borders. Next to the relocation of wind farms and a reduction of power densities, as discussed in this analysis, an overall improvement in site selection [24], wind farm layout [75] and turbine spacing [76] can further reduce wake. This is in particular relevant for possible retrofits in the future, where the replacement of many turbines of medium power ratings by few turbines of large power ratings can change the expected wake losses significantly [77]. For offshore wind farms that are known to be in the wake of upstream clusters, alternative turbine types that run at lower wind speeds [78] or the choice of different hub heights for the nacelles [79] open up further degrees of freedom to reduce yield losses.
Beyond the perspective of spatial planning and wind farm optimisation, there is also a system planning approach to reducing wake losses. This approach involves the concept of overplanting, where the generation capacity of the wind farm exceeds the transmission capacity of the export cable system. While the regulatory setup and the resulting overall value of the overplanted wind farm are complex to determine (c.f. Wolter [80]), it offers an interesting perspective on wake loss mitigation.
Overplanting allows for increased electricity generation during times of medium or low wind speeds, which enhances the market value of the electricity since other wind farms not utilising overplanting cannot produce as much. However, it also raises overall investment and maintenance costs and, depending on the layout of the wind farm, can increase internal wake losses, potentially offsetting the economic gains from selling the additional electricity. From a system planning perspective overplanting also leads to higher curtailment of wind farms, meaning that per installed gigawatt of offshore wind power, less energy is injected into the system.
This trade-off between an energy versus capacity perspective is central to the system planning challenge of achieving offshore development targets while maintaining a minimum level of electricity production efficiency by reducing wake losses. The calculation example between Denmark and Germany demonstrates that an energy yield target for both countries would result in a different wind farm deployment compared to the current capacity target. Further analysis is needed to quantify the implications of this trade-off, while also considering the possibility that offshore wind power generation does not need to be purely domestic but can also be imported via offshore hybrid interconnectors [81]. These interconnectors can help reduce local wake losses, while integrating the generated electricity more efficiently. For the sake of brevity, this assessment is left for future work.
6. Conclusion
This paper presents a comprehensive approach for assessing wake losses in the context of offshore wind farms and explores strategies to mitigate these losses for a group of neighbouring countries planning significant offshore wind power deployment in the future. The analysis includes a separation of domestic wake effects from their cross-border cumulative impacts. To achieve this, the KEBA method is refined and applied to a case study of the German Bight in the North Sea. It adopts a system planning perspective for a future scenario projected for 2050.
A significant share of Europe’s future offshore wind generation capacity will be situated in the North Sea, sharing the same wind corridor, predominantly influenced by south-westerly winds (c.f. wind roses in the map of Figure 2). This geographical setup leads to the long-distance accumulation of wake, impacting broader regions that span multiple country jurisdictions. Consequently, a large-scale assessment is warranted to prevent the overestimation of expected yields by neglecting cross-border wake impacts. The KEBA approach offers valuable initial insights into this issue and provides a rapid yet sufficiently accurate method for assessment. It is applied using a setup of coupled analysis boxes encompassing three neighbouring countries, allowing for the tracking of both national and cross-border contributions to total wake effects.
Results indicate that a crucial factor in mitigating wake losses is the strong coordination of maritime spatial planning both within national jurisdictions and across borders. Within national jurisdictions, this involves balancing the designation of space for wind farms with other spatial interests at sea. Across borders, avoiding the saturation of too many wind farms within a single corridor is essential. Whilst the spatial relocation of wind farms significantly reduces wake losses, this finding merits further investigation into the concrete implications for future maritime planning. Specifically, it is necessary to examine the extent to which shifting wind farms from one country to another is feasible, considering the additional cable routes required across borders in an otherwise constrained maritime space. The case study in this paper focuses on EEZs of Denmark and Germany. However, similar observations may be applicable to the jurisdictions of the United Kingdom, Belgium, and the Netherlands (c.f. map in Figure 2).
The insights on generation efficiency prompt the question of whether a sole focus on national capacity targets for the development of offshore wind power constitutes an effective regime for achieving efficient wind farm deployment. When the primary objective of offshore wind farm development is to integrate substantial amounts of renewable energy into the energy system, emphasising generation efficiency through a more energy-centric development target could present a viable alternative. This approach could be particularly beneficial if linked to the economic value of the generated electricity, which tends to be higher during periods of medium wind availability compared to times of stronger wind speeds. By aligning development targets with generation efficiency and economic value, it may be possible to achieve a more balanced and effective deployment of offshore wind resources. A calculation of LCOE under wake conditions and spatial planning constraints can be a viable first step as demonstrated in the paper.
Despite the measures and findings discussed, it is important to recognise that wake losses cannot be entirely eliminated. Although the effect on yield is diminished in more windy locations or during high wind years, it remains a persistent challenge that necessitates balancing against other constraints in offshore wind farm deployment, such as wind farm layout, turbine types and power densities.
Ultimately, the efficient deployment of offshore wind in Europe should be viewed within the broader context of the continent’s climate targets. Utilising offshore wind power will secure a significant share of the necessary green electricity supply by 2050. Cross-border collaboration, particularly within individual sea basins such as the North Sea, is frequently identified as a key component to achieve this goal. Concepts such as hybrid interconnectors, which enable the efficient tapping of offshore wind power from distant regions, are also likely to contribute to wake loss reduction, even if their primary development drivers differ. Therefore, the effort to reduce wake losses, both nationally and across borders, should not be considered in isolation. It is intertwined with numerous other spatial and system planning challenges that share a common denominator, namely the need for cross-border cooperation. When such measures are applied, they can have positive external effects on each other, ensuring that offshore wind energy contributes most effectively towards a reliable power supply for the future.
Conflicts of Interest
The authors declare no conflicts of interest.
Funding
No funding was received for this research.
Acknowledgments
Wind speed roses obtained from the Global Wind Atlas version 3.3, a free, web-based application developed, owned and operated by the Technical University of Denmark (DTU). For additional information: https://globalwindatlas.info.
Endnotes
Supporting Information
Additional supporting information can be found online in the Supporting Information section.
Appendix
| Category | Scenario 1 | Scenario 3 | Delta | Source |
|---|---|---|---|---|
| Full-load hours | 3004 | 3750 | +20% | KEBA analysis (this paper) |
| Connection distance (km) | 2320 | 2450 | +6% | GIS analysis (with [9]) |
| Capacity (MW) | 15,000 | — | Own calculation (this paper) | |
| Discount rate (%) | 5 | — | Own assumption | |
| Lifetime (years) | 25 | — | Own assumption | |
| Cable invest (€/MW/km) | 1617 | — | TYNDP 2024 [72] | |
| Cable operation (€/MW/km/a) | 40 | — | TYNDP 2024 [72] | |
| Wind farm invest (€/MW) | 1,880,000 | — | TYNDP 2024 [72] | |
| Wind farm operation (€/MW/a) | 56,000 | — | TYNDP 2024 [72] | |
| LCOE (€/MWh) | 123 | 102 | −17% | Own calculation (this paper) |
Open Research
Data Availability Statement
The data that support the findings of this study are available from the corresponding author upon reasonable request.
- 1Flag icons made with https://flagicons.lipis.dev/.


