Optimizing Electrical Efficiency and Levelized Cost of Energy in Photovoltaic Systems Through Thermal Management Using Microchannel Heat Sinks
Abstract
Solar energy is a ubiquitous renewable resource for photovoltaic (PV) power generation; however, higher operating temperatures significantly reduce the efficiency of PV modules, impacting their electrical output and increasing the levelized cost of energy (LCOE). This study aims to enhance conventional PV systems’ electrical efficiency and annual energy recovery while reducing the LCOE through thermal management using microchannel heat sinks (MCHSs) under forced convection. A 600 W monocrystalline PV module was analyzed, recognizing an efficiency reduction of ~20% under actual operating conditions due to thermal effects, with the surface temperature reaching up to 63.76°C without cooling. In addition, analytical calculations were used to determine an incident solar irradiance of 957.33 W/m2 for an industrial location in Lahore, Pakistan. Similarly, computational fluid dynamics (CFDs) simulations were conducted using single and dual-layer MCHSs configurations with water as the coolant at inlet velocities ranging from 0.01 to 1.0 m/s. The dual-layer MCHSs significantly reduced the PV module’s surface temperature from 63.76 to ~25.65°C at an inlet velocity of 1.0 m/s, achieving a temperature reduction of 38.11°C. This thermal management increased the electrical efficiency from 18.33% (without cooling) to 22.27%, an efficiency gain of ~4%. The annual energy recovery improved substantially; at 1.0 m/s, the dual-layer configuration increased the annual energy output by 227,954 kWh/year (about 21.89%) compared to the no-cooling scenario, reaching 1,269,131 kWh/year. Furthermore, the LCOE was reduced to as low as 6.27 PKR/kWh over a 30-year operational lifespan at lower velocities, demonstrating improved cost-effectiveness. Meanwhile, optimal velocity was identified between 0.2 and 0.5 m/s, balancing thermal performance and economic viability. Finally, this study concludes that thermal management using dual-layer MCHSs effectively enhances PV module efficiency, increases annual energy recovery, and reduces LCOE, contributing to sustainable and economical solar energy integration in industrial applications.
1. Introduction
The extensive global dependence on fossil fuels is undeniable, yet their utilization directly affects climate change. This arises from the substantial release of perilous emissions, resulting in adverse outcomes, such as air pollution, global warming, and the greenhouse gas effect. Air pollution is of particular concern, identified as a catalyst for cardiovascular diseases, such as stroke, coronary heart, and peripheral arterial diseases, and aortic diseases, leading to premature fatalities. In contemporary times, despite irrefutable progress brought about by the Industrial revolution regarding efficiency, reliability, and productivity, it has simultaneously played a pivotal role in exacerbating air pollution [1]. This emerging issue highlighting the urgent need for sustainable, eco-friendly energy options to meet our global energy demands [2]. Environmental protection agencies have decided to limit fossil fuel usage and mitigate CO2 emissions. Currently, a shocking proportion (80%) of global energy is sourced from fossil fuels, and it is documented that this proportion will decrease to 73% by 2030 [3]. Pakistan is grappling with unprecedented levels of climate change, global warming, and the harmful consequences of greenhouse gas emissions. The country’s power generation infrastructure profoundly relies on thermal energy from fossil fuels, constituting 61%. Meanwhile, clean, eco-friendly, and renewable energy sources contribute a mere 6% to the energy mix. So, it is crucial to assume alternative methods for power generation to supersede conventional approaches. Moreover, implementing sustainable energy practices not merely dialogues instant environmental challenges but also lays the foundation for a robust and eco-friendly energy future [4].
Therefore, the shift toward solar power extraction signifies a commitment to cleaner and sustainable energy practices and heralds a transformative journey toward a more environmentally conscious and balanced future. Effectively tapping into the solar potential amidst actual climatic conditions has led to the evolution of photovoltaic (PV) systems strategically crafted to alleviate the environmental repercussions of traditional electricity generation [5]. The monocrystalline PV modules, commercially prevalent, showcase efficiencies that hardly surpass the 20% mark owing to the heating effect, leading to a decline in overall module efficiency [6]. The constant exploration and innovation in the domain of PV systems underscores the ongoing chase of striking a balance between efficiency, cost-effectiveness, and environmental impact for a sustainable energy future. Maintaining an optimal temperature for PV modules becomes paramount in achieving peak output and maximum life span since environmental factors like temperature, wind speed, humidity, and dust significantly influence the performance of PV systems. The International Energy Agency (IEA) highlights the importance of controlling these parameters, emphasizing that doing so enhances efficiency and improves reliability, energy production, and the capacity factor of PV systems [7].
The critical factor to consider is the temperature of a PV module, which depends upon the site and plays a pivotal role in shaping its output. Indeed, studies indicate a noticeable decline in power output and efficiency with each Kelvin increase in the temperature of PV cells. When light photons hit the surface of a PV unit, a portion of their energy is effectively transformed into electricity; however, around 80% of this energy increases temperature. Thus, to maximize performance and achieve peak efficiency, it is essential to maintain the PV unit’s temperature within the ideal range of 20.0–30.0°C [8]. Moreover, among Pakistan’s numerous renewable energy sources, solar energy extraction by PV systems emerges as a prime choice due to its compelling advantages in capital costs, maintenance, operational longevity, and other crucial factors. Nevertheless, it is not exempt from limitations and challenges, and these hurdles can be effectively overcome by implementing scientifically grounded strategies and policies, marking the advent of a new era in solar energy utilization. Furthermore, Pakistan claims a mean sunshine duration of almost 8 h a day, sufficient to meet energy demands by employing potential solar energy applications [9]. In addition, the levelized cost of energy (LCOE) is crucial in PV power plants because it provides a comprehensive measure of the average cost of electricity generation over the plant’s lifetime, including initial investment, operation, maintenance, and decommissioning costs. Consequently, LCOE allows for the consistent comparison of different energy technologies, enabling investors, policymakers, and stakeholders to assess the economic viability of PV projects relative to alternatives [10].
Several studies have been conducted on cooling to counteract the temperature increase in PV cells, exploring methods such as implementing PV modules employing nanofluids, graphene, water, air, geothermal air-cooling systems, heat sinks, water spraying, etc. In addition, effective cooling mechanisms, such as utilizing heat sinks, have proven supportive in lowering module temperature, consequently contributing to improved energy gains [11]. Deeper explorations into cooling methods extend beyond conventional paths; for example, water spray cooling investigations significantly improve module efficiency and output power [12]. Similarly, cutting-edge numerical models leveraging computational fluid dynamic (CFD) highlight that optimum heat transfer is achievable using water as a working fluid, presenting a promising roadmap for advancing cooling efficiency [13]. The study of Krstic et al. [14] explored the passive cooling of PV panels using aluminum heat sinks with different geometries. The average temperature reduction of 7.5°C resulted in a 0.27 V increase in open-circuit voltage compared to the reference panel. Afterward, software simulations validated experimental results, indicating a good agreement with an average temperature difference of about 1.0°C. The numerical analysis identified that the second heat sink was the most efficient, providing valuable insights for optimizing heat sink design and enhancing the cooling efficiency of PV panels. To enhance the power conversion efficiency (PCE) of flat roof-installed PV modules, Wang et al. [15] study presents a low-cost passive cooling scheme utilizing natural wind. The scheme includes strategically placed curved eaves and vortex generators (VGs) on the roof. Moreover, the evaluations reveal that the arrangement of VGs significantly improves convective heat transfer, and the combined scheme reduces rooftop PV temperatures by ~5.89°C, enhancing PCE by optimizing forced convective heat exchange. This cost-effective approach is viable for new installations and retrofitting existing flat-roof mounted PV systems. Selimefendigil and Öztop [16] investigated various cooling methods for PV panels, including hollow fins and two-channel cooling systems with flat and hollow fins. Numerical assessments consider fin numbers, hollow fin radius, Reynolds number, wavy channel amplitude, porous insert permeability, porous layer size, and nanoparticle volume fraction. Channel cooling with porous layer and wavy walls outperforms other systems, achieving a temperature drop of 37.6°C, while hollow fins demonstrate improved performance over flat fins. These findings support further optimization of PV cooling technologies for enhanced thermal management in renewable energy systems.
Despite requiring additional energy input, active cooling approaches offer significant performance gains. For instance, Patil et al. [17] research employed CFD analysis to optimize the operational characteristics of a solar PV/T system with bottom active air cooling. The study utilized Fluent (ANSYS) software code and incorporated a bottom air duct with an inlet/outlet manifold for uniform airflow to the PV system’s backside. Mass flow rates (0.04, 0.06, 0.08, and 0.1 kg/s) were examined under an 800 W/m2 irradiance intensity, revealing maximum temperatures for different operational parameters at specific air flow rates and solar radiation intensity. In addition, Hussien, Eltayesh, and El-Batsh [11] explored forced convection cooling for PV panels to enhance electrical efficiency and output power. The CFD code analyzed cooling airflow characteristics and panel temperature distribution. The results demonstrate that employing small backside fans can enhance performance, achieving a maximum increase of 2.1% in PV panel efficiency with 7.9% energy savings. The blower cooling technique achieves a maximum increase of 1.34% efficiency with 4.2% energy savings. Shaik, Lingala, and Veeraboina [18] also demonstrated that the PV systems experience a 0.08% loss in output per degree deviation in solar irradiance and an efficiency drop of 0.03%–0.05% for every 1°C increase in temperature without cooling, potentially decreasing efficiency by up to 69% at 64°C; cooling methods can enhance energy gain by 18% (thermoelectric), 15% (active water), or 2.5% (natural ventilation). Moreover, glass transmittance decreases by 20% after 45 days without cleaning and up to 37% after 40 days in humid conditions, but cleaning with pure water can boost productivity by 15%; solar cell efficiencies range from 17% (silicon-based) to 60% (quantum dots), with a performance ratio of 82.77% observed in a 500 kWp system.
Khelifa et al. [19] investigated the thermal performance of PV/T solar collectors with active cooling using flax fibers as natural porous materials. Their numerical analysis considered the effects of porous material layer thickness (5–50 mm), solar flux (50–1000 W/m2), and coolant flow rate (0.40–1.0 m/s). The optimal design, with a 50 mm porous flax fiber layer and a 0.907 m/s cooling water flow rate, showed a 173.46% improvement in Nusselt number compared to using only pure water. The photovoltaic thermal (PVT) system achieved thermal efficiencies of 69.58% with water/flax fibers, 50.02% with pure water, and 34.60% with air. The research examined by Salameh et al. [20] focused on a 2.88 kW PV grid-connected system in Sharjah, UAE, employing three-dimensional (3D) numerical simulations under actual boundary conditions. Comparing experimental and computational results, a parametric study examined the impact of weather conditions on a system’s temperature, electrical efficiency, and power output. The study’s findings further disclosed that low ambient temperatures and wind speeds at low irradiance levels lead to the lowest PV module temperature and maximum electrical efficiency. The study suggests that back cooling reduces the highest temperature at the cell center by 26.0°C in the worst-case season. Selimli et al. [21] investigated and compared the energy and exergy of PV modules and PV/T collectors. At first, experimental evaluation in Turkey, revealed that the PV module’s overall efficiency was ~7.96%. At the same time, PV/T1 and PV/T2 exhibited thermal, electrical, and overall energy efficiencies of 29.08%, 9.74%, and 38.82%, and 49.68%, 10.19%, and 59.88%, respectively. Finally, the exergy efficiency values for PV, PV/T1, and PV/T2 were ~4.63%, 10.64%, and 11.53%, showing a significant improvement in solar energy utilization for PV/T. Another study conducted by Yu et al. [22] introduced a vacuum environment to flat-plate PV/T collectors to moderate heat loss and enhance operational efficiency. They maintained both upper and lower spaces of the absorber in a vacuum state, resulting in the reduction of heat loss coefficient by 16.08% compared to air-gap PV/T collectors. On the other hand, annual thermal energy outputs of vacuum PV/T collectors without and with ideal low emissivity coating were 124.88% and 346.58% higher, respectively, than those of air-gap PV/T collectors at an operating temperature of 50°C. Xia et al. [23] presented a spectral splitting PV/T system to address the heat and electric energy collection discrepancy in traditional systems. Their findings showed that the maximum temperature of the spectral splitting medium reached 38.21°C, with maximum thermal and electrical efficiencies of 38.7% and 11.77%, respectively. At the same time, mathematical modeling validated optimal nanofluid concentrations, with the best nanofluids resulting in annual electric energy and heat outputs ranging from 126.6 to 164.46 MJ/m2 across different regions of China.
Asim et al. [24] focused on enhancing the efficiency of a 10 × 10 mm2 multijunction solar cell (MJSC) under Lahore’s climatic conditions. Employing active cooling with SiO2–water and aluminum oxide (Al2O3)–water nanofluids, the study explored two- and three-layer MCHSs with squared microchannels. The model, including a triple-junction solar cell, simulated in Ansys Fluent, revealing that the SiO2–water nanofluid with three layers of MCHSs at a 15% volume fraction achieved the optimum average surface temperature (44.5°C) and electrical efficiency (41.97%) under a concentration ratio of 1500 suns. Besides, they declare that employing microchannel-based active cooling is the most suitable approach for reducing the temperature of solar cells. Kalkan, Duquette, and Akif Ezan [25] introduced a novel numerical modeling approach to analyze the dynamic performance of a solar PV/T domestic hot water system. They managed a study in Ottawa, Canada, and compared scenarios with different working fluids and collector designs. Finally, the results indicated that the air-based system with fins achieved higher solar fraction, and adding fins improved overall system performance. However, variations in the electrical performance were negligible. The study evaluated by Farhan et al. [26] emphasized the efficiency of a water and Al2O3 nanofluid cooling system for solar panels using CFD. Examining temperature differences among uncooled, water-cooled, and Al2O3 nanofluid-cooled panels, the research varied mass flow rates (16.5, 33, 66, and 99 L/h) and inlet coolant temperatures (20–40°C). Al2O3 nanofluid-cooled panels, at the highest flow rate (99 L/h) and lowest inlet temperature (20°C), demonstrated the lowest panel temperature, crucial for energy storage, with a reduction of 41% to 60% compared to uncooled panels. Gao et al. [27] revealed that employing a thicker PCM layer of 9 mm helped stabilize both the PV temperature and the temperature difference (ΔT), enabling the PV to produce ~0.165 W at an efficiency of 16.5% and the TEG to generate around 0.0035 W at 0.225% efficiency. Moreover, selecting a PCM with a lower melting point of 301.15 K sustained superior output power and efficiency for both PV and TEG devices under higher concentration ratios. Another investigation by Dehghan et al. [28] demonstrated that a nano-enhanced PCM-based PVT system, LAG-3.5, reduced the PV surface temperature to 39°C (compared to 63°C without PCM) and improved electrical efficiency to 9.42% from 6.68%; in thermoelectric generation applications, it produced a higher voltage of 398 mV versus 323 mV for the base PCM, highlighting its potential for energy conversion and storage applications. Finally, Shohdy et al. [29] demonstrated that the innovative radial microchannel heat sink (MCHS) configurations enhanced the thermal management of CPV systems, particularly the double-header design (Conf. C), which reduced cell temperature to 83.6°C, achieved a net electrical power of 42.7 W, and provided the lowest LCOE at 8 Ȼ/kWh, significantly below the US utility average of 16.9 Ȼ/kWh. Grubišić Čabo et al. [30] performed an experimental investigation of a passively cooled 260 Wp polycrystalline silicon PV system using perforated aluminum fins, demonstrated an increase in power yield by up to 5%, corresponding to an LCOE improvement, ranging between 0.116 and 0.10 €/kWh, with a simple payback time of 6 years under Mediterranean climate conditions.
- 1.
To calculate solar irradiance profile analytically, specifically for the summer solstice of 2023, to explore maximum solar heat values and extended computational examination.
- 2.
Modeling a tailored 3D model for a monocrystalline PV unit to meticulously investigate the impact of temperature on PV electrical output, endurance, performance, and energy efficiency.
- 3.
To validate the current approach utilizing considering and undertaking experimental study and ensuring its replication.
- 4.
To perform thermal analysis, comprising steady-state thermal analysis (SSTA) and Ansys Fluent, to explore enhancements in electrical power by reducing the surface temperature of the PV system using microchannel heat sinks layer (MCHSL).
- 5.
To calculate LCOE based on the two scenarios, including 20 and 30 years of lifetime expectancy, under special MCHSs designs.
2. Numerical Modeling and Simulation
2.1. Model Description
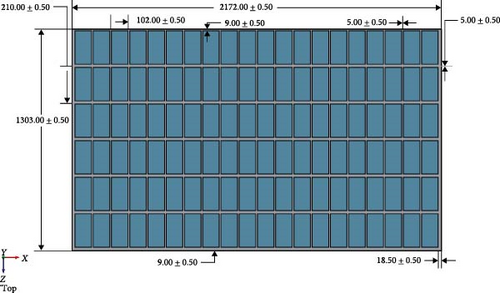
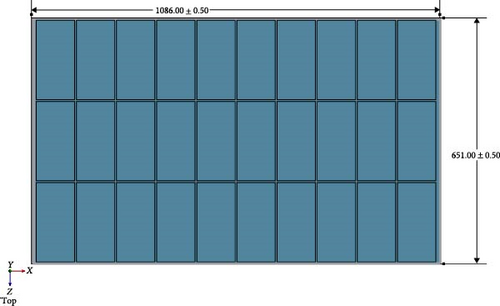
The pilot’s focus is on enhancing the electrical efficiency of a monocrystalline PV module, specifically on the specific hot day of the summer (summer solstice [June 21, 2023]). The chosen site is the Sunder Industrial Estate in Lahore, known for its vast industrial zone with a prevailing trend of PV system installations. There is a significant concern about the loss of electrical potential due to elevated PV surface temperatures during operational conditions [24]. The selected model, featuring 120 half-cut cells, is depicted in Figure 1a, with panel dimensions (length: 2172.00 ± 0.50 mm, width: 1303.00 ± 0.50 mm) provided by the manufacturer [32]. The half-cell dimensions (length: 210.00 ± 0.50 mm, width: 102.00 ± 0.50 mm) can be observed in the same figure as well. The CAD modeling of this PV system is finalized using SolidWorks software. In Figure 1b, the quarter of the entire PV panel is designated and agreed for SSTA, aimed at managing computational time. The dimensions for this segment are specified as 1086.00 ± 0.50 mm for length and 651.00 ± 0.50 mm for width of the selected PV system with 30 half-cut cells. Further approximation is approved, reducing the number of cells to only 10 in a row, facilitating the examination of forced and natural heat conduction and convection and their impact on the complete PV system’s performance. The electrical properties of the monocrystalline PV panel are detailed in Table 1. Solar flux value of 957.33 W/m2, calculated analytically using equations from the previous article [33], for solving the concerned problem of temperature profile visualization at mid-day of summer solstice. According to the manufacturer’s directions, only 22.33% of the radiation is converted into electricity while the remaining solar radiation generates heat on the surface of the panel, thereby reducing its available electrical potential. Although the recommended PV surface temperature range given by the manufacturer is between approximately −40 and 85°C, the aim to maintain this surface temperature around 25.0°C is a potential driver behind this study. Figure 2a further illustrates the design with module length and width of 1086.00 ± 0.50 mm and 220.00 ± 0.50 mm on a respective note with a subsequent detail of single and dual-layer MCHSs in Figure 2b,c. These MCHSs are provided at the end of the panel to absorb generated heat at the PV layer which is a source of heat generation among other layers of the PV module. Only six layers are selected from top to bottom as glass, encapsulated ethylene-vinyl acetate (EVA) front layer, PV cells layer followed by the encapsulated back EVA layer, absorber plate, and finally aluminum MCHSs. These two-layer configurations of MCHSs are introduced with squared design to maintain the temperature uniformity of the cell, which otherwise deteriorates the PV cells material. Their thermophysical and configuration properties are also given in Tables 1 and 2, respectively. Regarding coolant selection, water is selected because of higher thermal management capability, and economical availability as compared to other working fluids.


| Trina model | TSM-DE20 |
|---|---|
| PPV | 605 W |
| Vmpp | 34.57 V |
| Impp | 17.50 A |
| Voc | 41.7 V |
| Isc | 18.57 A |
| ŋPV-r | 22.33% |
| Trange | −40°C to 85°C |
| System Vmax | 1500 V DC |
| Pattenuation | 0.55%/year |
- Abbreviation: PV, photovoltaic.
| Material layers | Thickness, δ (mm) | Density, ρ (kg/m3) | Thermal conductivity, K (W/m·K) | Heat capacity, cp (J/kg·K) |
|---|---|---|---|---|
| Top glass (Tg) | 3.2 | 3000 | 0.98 | 820 |
| EVA (front) | 0.15 | 960 | 0.31 | 2090 |
| PV cells layer | 0.2 | 2330 | 150 | 712 |
| EVA (back) | 0.15 | 960 | 0.31 | 2090 |
| Aluminum (absorber) | 1 | 2719 | 202.4 | 871 |
| Aluminum (MCHSs) layer | 3 and 6 | 2719 | 202.4 | 871 |
| Water | — | 998 | 0.6 | 4200 |
- Abbreviation: PV, photovoltaic.
2.2. Hypothetical Analysis
- 1.
Each PV solar cell is responsible for heat generation inside the entire panel because other layers ensure the protection of the solar cell.
- 2.
In SSTA, only two sides of the panel and the top glass surface area, which were assumed to be confronting incoming natural wind, are selected for boundary conditions. In contrast, the rest of the sides were taken to be thermally adiabatic.
- 3.
The PV cells’ reference electrical efficiency was 22.33% at 957.33 W/m2 solar irradiance, and PV cells are encapsulated in EVA sheets.
- 4.
PV cells are assumed to be temperature-independent and naturally isotropic.
- 5.
The thermal resistance between contact surfaces of all the layers, including MCHSs, is insignificant.
- 6.
The flow of the coolant water is assumed to be laminar, steady, and incompressible at room temperature 25°C with varying inlet velocities from 0.01 to 1.0 m/s.
- 7.
The properties of the working fluid water were agreed to be dependent on temperature because of its sensitivity toward varying temperatures.
- 8.
This study’s governing equations of motion were associated with the conservation of mass, momentum, and energy.
- 9.
For this investigation, the ambient temperature for the industrial sector in Lahore is considered to be 38°C, and the convective heat transfer coefficient is 22.80 W/m2K for the summer solstice (2023).
2.3. Governing Equations
2.4. LCOE
- •
T = Total operational life of the PV system (years).
- •
CIt = Capital investment cost in year t (detailed in Table 3).
- •
O&Mt = Operation and maintenance costs in year t.
- •
r = Discount rate applied to the project.
- •
AE = Total annual energy generated in the t year (kWh).
- •
d = Annual degradation rate of the PV system (%).
The degradation rate d is incorporated into the equation to account for the gradual decline in the PV system’s output over time due to environmental and climatic factors. The financial parameters used in this calculation, including capital initial investment and operational costs, were sourced from the studies [29, 34] and listed in Table 3. Moreover, a 4.36 kWh/m2 irradiance value [38] on the average scale for a Lahore-based location and a performance ratio of 80% are considered.
| Components | Values | |
|---|---|---|
| Lifetime (T, years) | Case-A (20) | Case-B (30) |
| Discount rate (r) | 8% | |
| Degradation rate (d) | 0.5 | |
| O&Mt (PKR/year) | 108,500 | |
| CIt (PKR/year) | 93,310,000 | |
| Annual energy (kWh/year) | 1,273,120 | |
- Abbreviation: LCOE, levelized cost of energy.
2.5. Grid Sensitivity Test
All CFD domains underwent testing with varying numbers of elements using linear meshing order, and the final counts of elements and nodes are presented in Table 4. The SSTA achieved a temperature profile with 923,869 elements, and meshing elements for MCHSs and working fluid streams (WFSs) were suppressed during setup. In subsequent single-layer MCHSs arrangement within the SSTA domain, the meshing elements were 789,283, which suppressed the WFS. Only WFSs were allowed in the Fluent domain, resulting in 118,374 elements. Similarly, in dual settings of MCHSs, the agreed-upon number of elements was 1,242,053 and 947,864 for SSTA and Fluent domains, respectively.
| Domains | Layers | Meshing elements | Meshing nodes | Number of WFS |
|---|---|---|---|---|
| Computational domain (SSTA) | — | 923,869 | 357,121 | — |
| Computational domain (SSTA) | Single | 789,283 | 217,682 | 109 (10−6 m2) (suppressed) |
| Working fluid domain (Fluent) | Single | 118,374 | 473,932 | 109 (10−6 m2) |
| Computational domain (SSTA) | Dual | 1,242,053 | 316,891 | 218 (10−6 m2) (suppressed) |
| Working fluid domain (Fluent) | Dual | 947,864 | 236,748 | 218 (10−6 m2) |
- Abbreviation: WFS, working fluid stream.
2.6. Validation
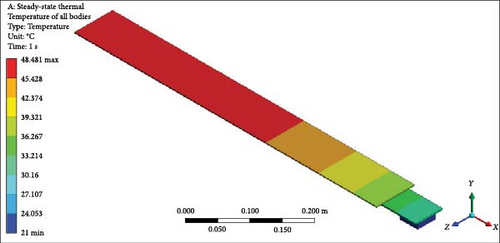
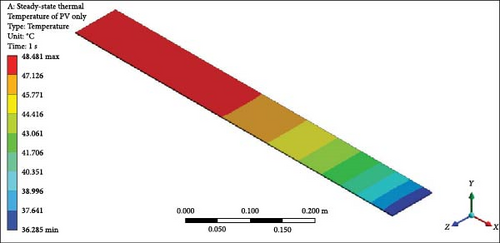
To validate results, a comprehensive analysis of the validation and errors between the experimental work of Shittu et al. [39] and the current model has been done, specifically regarding PV average temperature under varying solar irradiance values. The validation process illustrated in Figure 3 demonstrates the thermal management of a PV module under 500 W/m2 irradiance. Figure 3 shows the distinguishing temperature gradients/contours among various views inclusive of (Figure 3a) top, (Figure 3b) back, (Figure 3c) front, (Figure 3d) left, (Figure 3e) isometric complete unit, and (Figure 3f) isometric (PV only), confirming consistent energy absorption and the simulation’s reliability in capturing generated heat. Moreover, Figure 3 is the continuation of the model by displaying the average temperature distribution on the PV surface and temperature contours across the computational domain in isometric view, enhanced by forced convection using water flowing at 1 L/min through the microchannel. This forced convection cooling system efficiently reduces the PV module’s temperature by enhancing heat transfer through the microchannel, which can be assessed. The water mass flow rate (1 L/m) significantly reduces the heat while stabilizing the PV temperature. This stabilization improves PV efficiency by reducing the effect of temperature on power output. Apart from that, the validation graph in Figure 4 displays a comparison between the experimental and current work data. The results of both studies closely overlap, indicating that the validation is highly germane, with minimal deviations. As solar irradiance increases, the average temperature increases steadily, consistent with physical expectations. Moreover, the high degree of agreement between the experimental work and the current one demonstrates that the current work effectively replicates the temperature deviations seen in the experimental modeling. The slight differences between the results also suggest only minor experimental uncertainties or potential limitations of the model. In Table 5, absolute and relative errors are provided to strengthen the agreement between the findings. The absolute errors vs. solar irradiance relationship provides additional context regarding the scale of discrepancies between both works. The absolute error values range from 0.07 to 0.89°C, indicating minor differences. The slightest absolute error occurs at 700 W/m2, while the largest occurs at 1000 W/m2. At the same time, the relative errors are generally relatively low, below 2% across all irradiance levels. The highest relative error occurs at 600 and 1000 W/m2, reaching around 1.40%, while the lowest error occurs at 700 W/m2, below 0.2%. This trend reveals that the model’s performance is most accurate at moderate irradiance levels and shows slightly larger deviations at the lower and higher extremes of irradiance. Finally, this validation of the current model is reliable for predicting PV temperatures under various irradiance levels, which is effective for designing and optimizing PV systems.


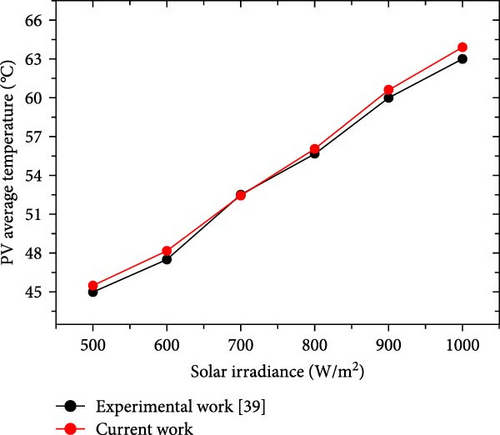
| Solar irradiance (W/m2) | Absolute error (°C) | Relative error (%) |
|---|---|---|
| 500 | 0.47 | 1.04 |
| 600 | 0.66 | 1.39 |
| 700 | 0.07 | 0.13 |
| 800 | 0.35 | 0.63 |
| 900 | 0.61 | 1.02 |
| 1000 | 0.89 | 1.41 |
3. Results and Discussion
3.1. Solar Flux Profile
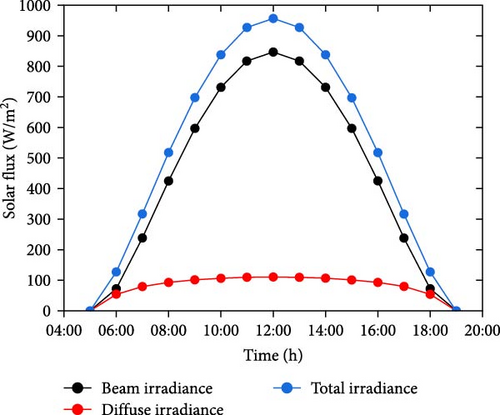
The solar flux profile is derived through analytical analysis, and Figure 5 provides a detailed representation. The data presentation is straightforward, showcasing diffuse, beam, and total radiation values from 5:00 a.m. to 7:00 p.m. As an illustration, at 6:00 a.m., the beam and diffuse irradiance values stand at 73.03 and 54.21 W/m2, resulting in a total of 127.25 W/m2. These values exhibit an ascending trend, assuming clear sky conditions, and peak at 846.73, 110.55, and 957.33 W/m2 for beam, diffuse, and total irradiance, respectively. Subsequently, a symmetrical trend persists until 6:00 p.m., reflecting the morning values. However, this study emphasizes the values at solar noon to simulate and analyze temperature contours and additional results, as elaborated below as a profound exegesis.
3.2. SSTAs
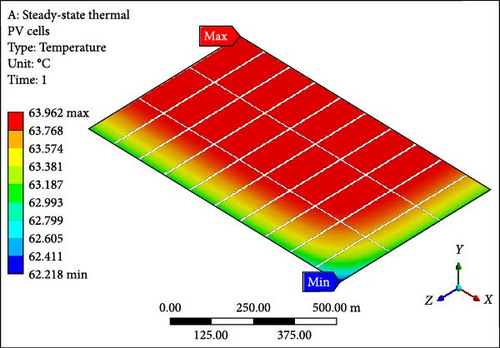
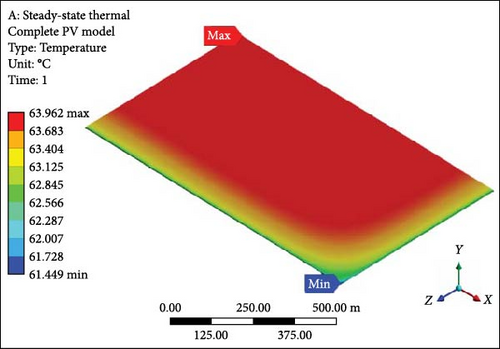
In SSTA, the approach involves selecting only three layers of half-cut silicon solar cells, comprising 30 cells, instead of the entire module with 120 cells. This selection is based on the understanding that these cells exhibit lower computational time (approximation). Although the complete monocrystalline unit with 120 half-cut solar cells is the prime focus of this study, the computational efficiency considerations lead to the adoption of a reduced scale, representing only 30 half-solar cells, as illustrated in Figure 6. All the panel layers are examined under the fluent domain, and temperature contours are available for the day of the summer solstice. In Figure 6a, the maximum, minimum, and average temperature can be observed for only the solar cells layer at the values of 63.96°C, 62.22°C, and 63.76°C, respectively. On the other hand, for the complete chosen model in Figure 6b, the maximum, minimum, and average values of the temperature profile at 63.96°C, 61.50°C, and 63.46°C are given, respectively. Minimum and maximum temperature highlights are the assumed direction of the wind on a selected day from a minimum temperature pointer to a maximum temperature one. Data points gathered from this comprehensive analysis are utilized to assess the subsequent performance of the panel’s efficiency and power output. Despite the manufacturer’s datasheet, which indicates a rated efficiency of ~22.33%, the presence of radiation that cannot be converted into electrical output induces heat on the silicon solar cell layer, reducing efficiency. This study’s observed efficiency drop is ~1/5th (~4.0% out of 22.33% = ~18.33%) of the maximum achievable efficiency. While temperature uniformity under no forced convection conditions remains acceptable at 1.7°C, the study considers implementing forced convection to regain maximum possible efficiency. This involves restricting the number of half-cut solar cells to 10, accompanied by two MCHSs, including single-layer and double-layer configurations. Further insights into the study’s findings are elaborated in the subsequent detailed description.
3.3. Single Layer of Heat Sinks
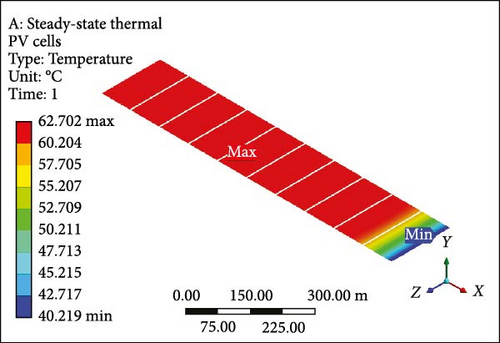
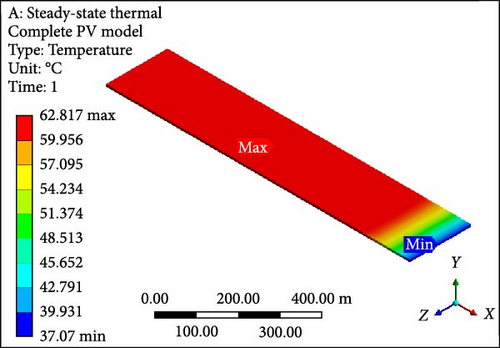
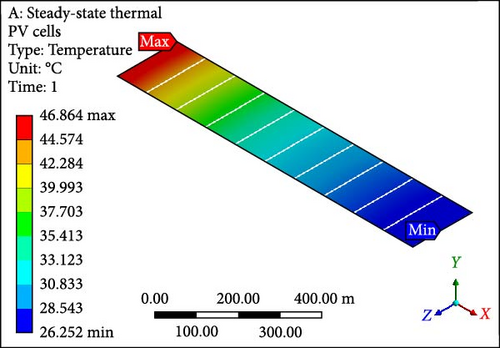
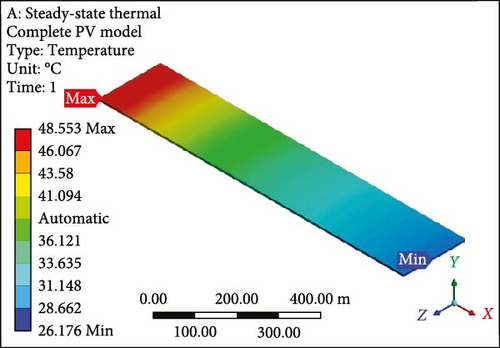
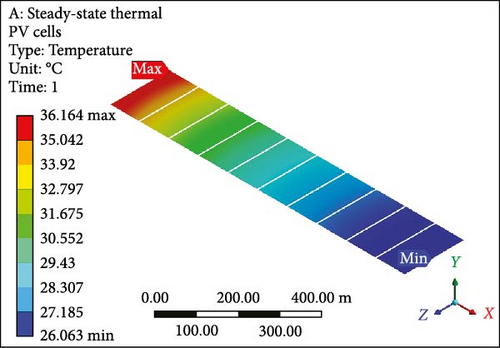
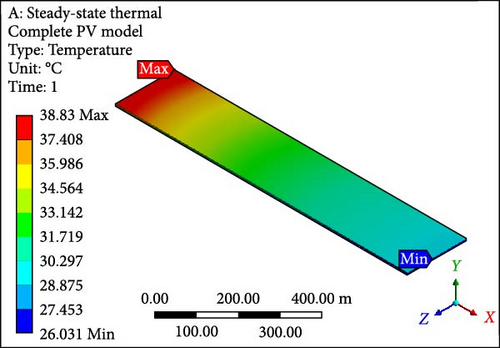
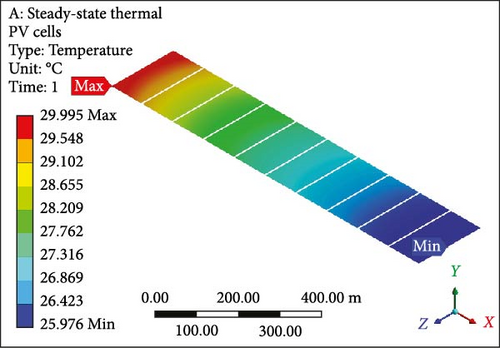
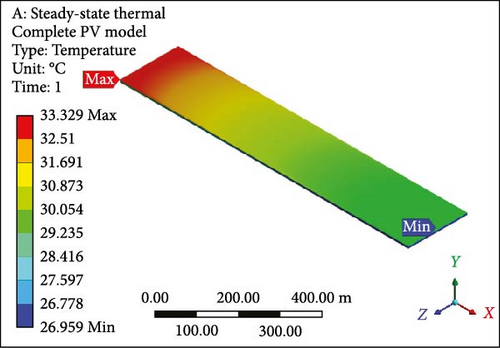
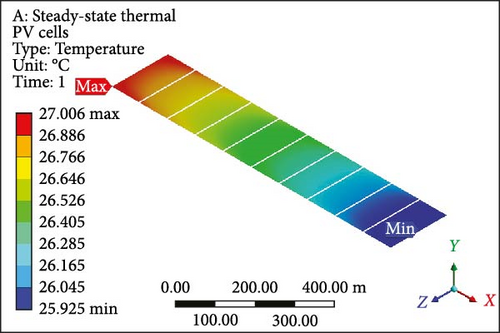
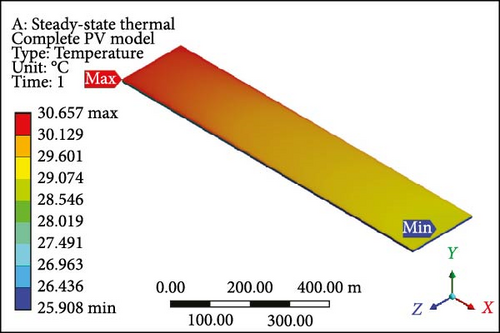
A focused approach is undertaken to minimize computation time, selecting a simplified configuration with a single layer consisting of 10 PV half-cut cells. Thermal management employs the Ansys Fluent domain, incorporating SSTA, which is aesthetically and numerically justified. Figure 7a presents an isometrical view of the cooled PV layer with a minimum temperature of 40.22°C at the inlet side. Simultaneously, the outlet region indicates a computed maximum allowable temperature of 62.70°C. Contrastingly, in the complete model, the figure’s temperature contour distribution is examined in Figure 7b, spanning the entire domain with temperatures ranging from 37.07 to 62.82°C at a working fluid velocity of 0.01 m/s. Likewise, elevating the velocity to 0.05 m/s results in a prominent reduction in the maximum temperature of the PV layer (Figure 7c) and the complete model (Figure 7d) to 46.86°C and 48.55°C, respectively, indicating enhanced temperature reduction with increased velocity. Further simulations at the velocity of 0.1 m/s reveal that the overall domain experiences a decrease in temperature, with the difference between maximum and minimum temperatures for the PV layer (Figure 7e) and module (Figure 7f) calculated at 10.10°C and 12.80°C, respectively. At 0.2 m/s, the maximum and minimum temperature values for the PV layer (Figure 7g) and entire model (Figure 7h) are in proximity, recording 30.0°C and 33.33°C as maximum values and 25.98°C and 26.0°C as minimum values, respectively. Figure 7i–l illustrates a further decline in temperature for the PV cells and the complete unit with an increase in coolant velocity. If opting for a velocity of 0.5 m/s, the PV layer (Figure 7i) demonstrates a maximum temperature of 27.0°C and a minimum of 25.93°C at the outlet and inlet side, respectively. The complete model (Figure 7j) exhibits these values at 30.66 and 25.91°C, marking a significant achievement in the thermal management of the PV module. Finally, at the highest velocity of 1.0 m/s, chosen to examine flow behavior and temperature contours, it becomes evident that this velocity is optimal. The maximum and minimum temperature values are only 0.58°C apart for the PV layer (Figure 7k), and for the entire domain (Figure 7l), this temperature difference is computed at 4.31°C.
3.4. Double Layer of Heat Sinks
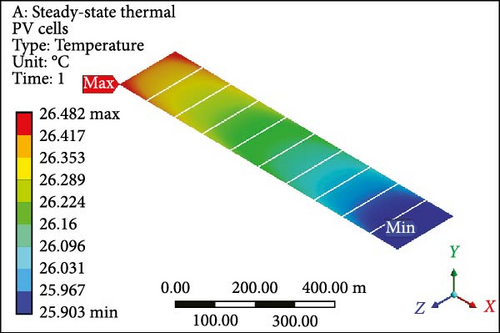
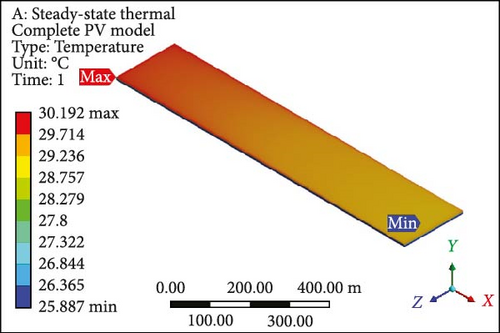
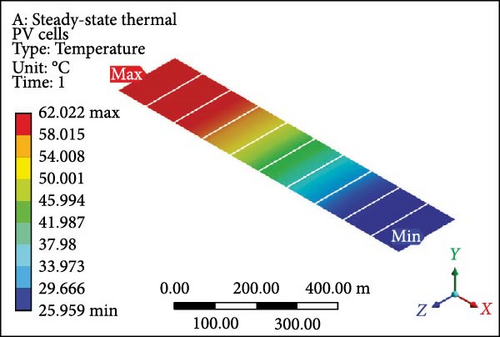
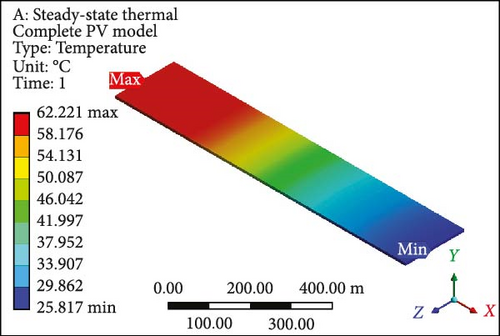
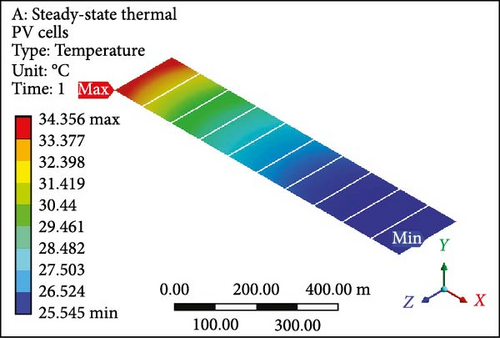
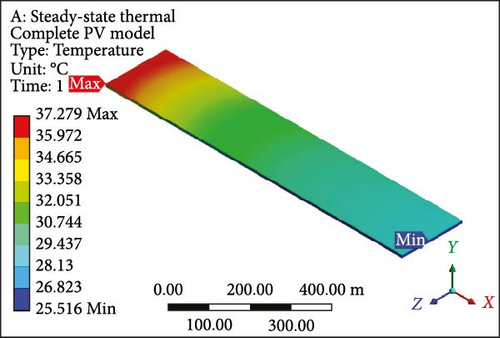
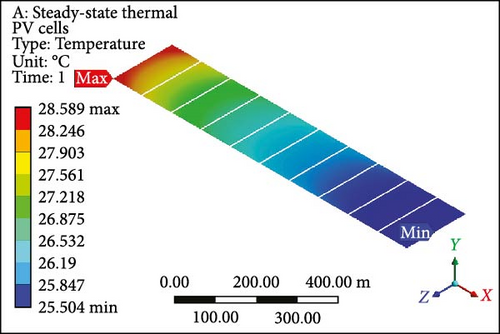
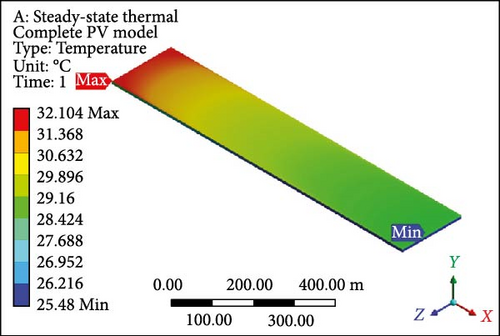
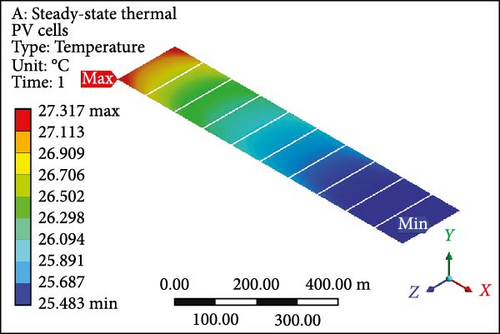
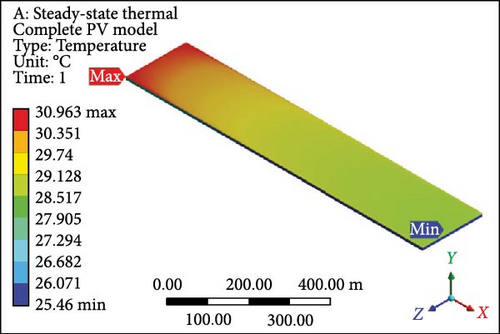
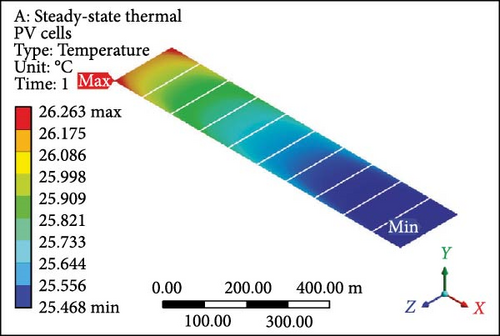
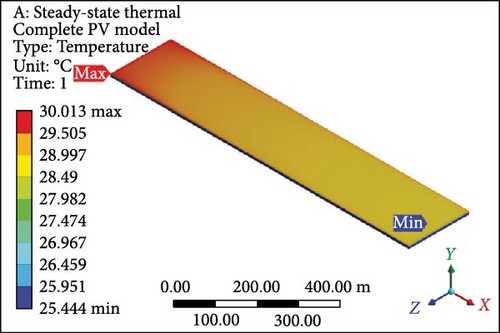
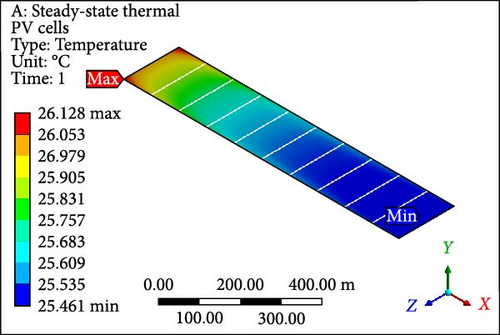
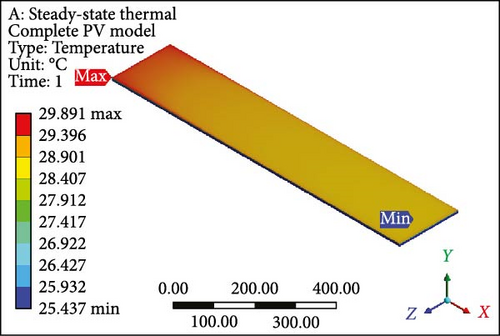
Dual MCHSs were designed and implemented meticulously to conduct an in-depth analysis of fluid flow, temperature profiles, and associated results. These findings are elaborated on in comprehensive detail below. The temperature contours derived from the dual MCHS scheme are evident, particularly at an initial velocity of 0.01 m/s with laminar flow boundary conditions. In Figure 8a, PV layer depicts a maximum temperature of 62.02°C at the outlet side, while at the inlet, the minimum temperature approaches the applied working fluid inlet temperature. This is attributed to using two parallel heat sink arrangements, which resulted in a minimum temperature roughly 37% lower than that achieved in the earlier single-layer setup. For the complete geometry (Figure 8b), since the maximum and minimum values are computed at 62.22°C and 25.82°C, respectively. At the subsequent velocity of 0.05 m/s, the temperature values exhibit a substantial drop in the surface temperature of the PV module (Figure 8c) and the entire working domain (Figure 8d), displaying maximum and minimum temperatures of 34.36°C and 37.28°C and 25.55°C and 25.52°C, respectively. The temperature contours indicate minimal gaps between maximum and minimum temperature values in further velocity examinations. At 0.1 and 0.2 m/s velocities, the maximum temperature at PV layers (Figure 8e,g) shows a difference of just 1.27°C, with a nearly identical variance in minimum temperatures. The complete module domains (Figure 8f,h) highlight the same temperature difference as the PV cells. Furthermore, the PV layer and complete unit exhibit further temperature reduction below or equal to 30.0°C in Figure 8i,j. Finally, at the highest velocity of 1 m/s, the temperature profiles align closely with the input temperature of the working domain, that is, 25°C. Finally, both thermal management approaches showed the potential to lower surface temperatures; however, the dual induction of microchannels proved to be the most efficient case.
3.5. Temperature Profile
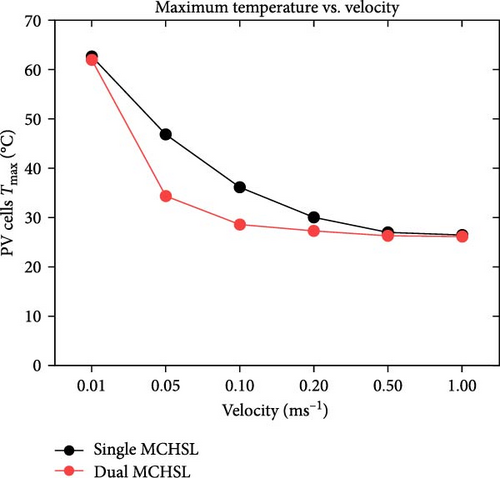
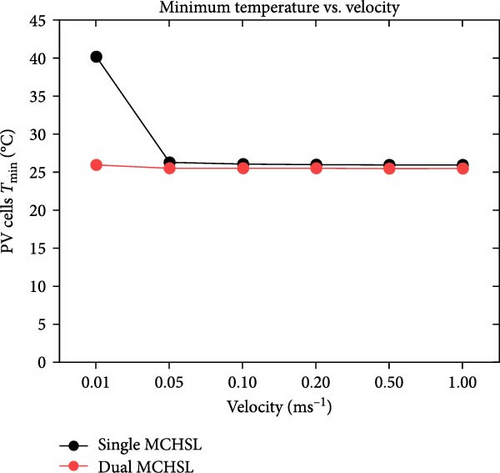
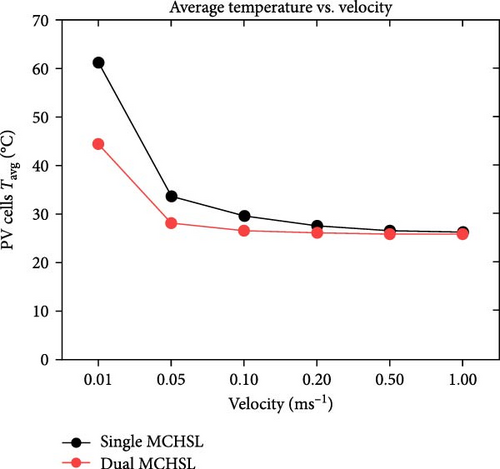
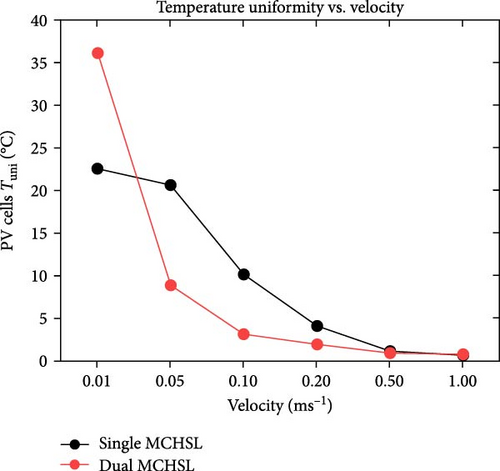
Figure 9a illustrates the disparity in maximum temperature among PV cells at a velocity of 0.01 m/s, where the values surpass 60°C (maximum value) for both cases involving single and dual MCHS layers. As velocities progress, the most substantial difference in surface temperature occurs at 0.05 m/s, with a temperature difference exceeding 10°C between single-layer and dual-layer heat sinks. This temperature profile, concerning the maximum temperature, attains optimum values with further increases in velocity while maintaining laminar flow. At the ultimate velocity (1.0 m/s), the maximum temperature appears to have nearly identical values above the defined room temperature of 25°C. On the other hand, PV cells’ minimum temperature follows a similar pattern from 0.1 to 1.00 m/s velocity, slightly above 25°C, except for the initial case of 0.01 m/s velocity. In this case, the minimum surface temperature for single MCHSs is determined at 40°C, while it is 27°C for dual heat sinks arrangements. Furthermore, the average temperature of PV cells indicates remarkable temperature reduction achievements, a crucial parameter for computing electrical efficiency and subsequent results. Initially, the average surface temperature of a PV layer is observed at 61.12°C and 44.38°C, respectively, for single and dual-layer settings of MCHSs at 0.01 m/s velocity. In the subsequent simulation at 0.05 m/s velocity, the average temperature values are above and below 30.0°C for both heat sinks. For further simulations, the minimum temperature trend and the average temperature are observed between 25.0 and 30.0°C. Finally, the temperature uniformity for all cases is presented in Figure 9d. In this segment, a higher temperature value but lower temperature uniformity is obtained by two layers of heat sinks. Specifically, a temperature uniformity value of 36.06°C is achieved by the two layers of heat sinks at the initial velocity, whereas, with a single arrangement of microchannels, its value remains at 22.5°C. As velocity increases, at 0.05 m/s, for example, the temperature uniformity improves to 20.6 and 8.8°C, and at 0.1 m/s, its value is nearly 10.0°C and 3.1°C for single and dual layers of MCHSs, respectively. Moreover, at 0.2, 0.5 , and 1.00 m/s, the temperature uniformity is below 5.0°C, with an optimum value of around 0.5°C at higher velocity.
3.6. Electrical Efficiency
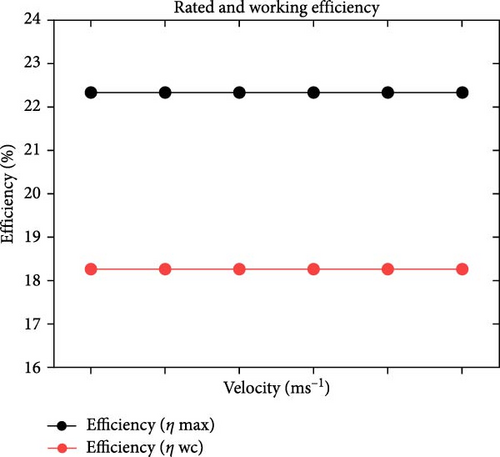
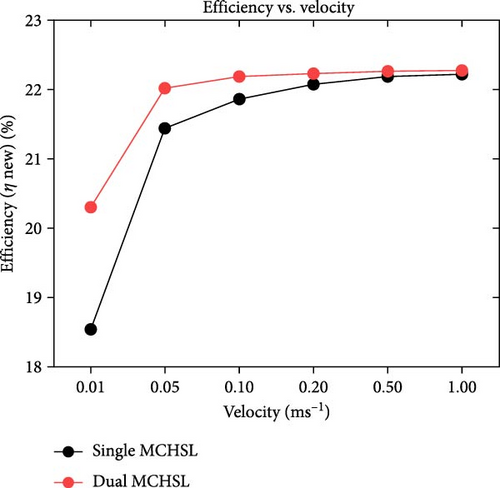
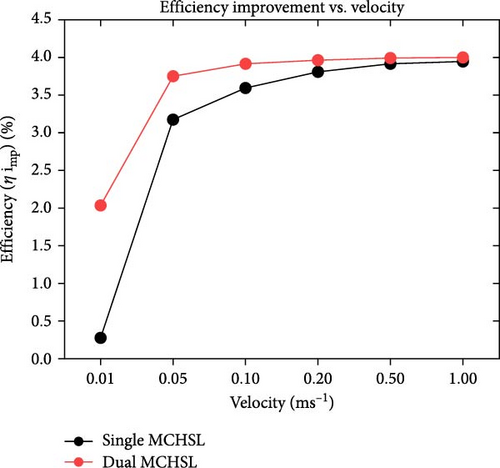
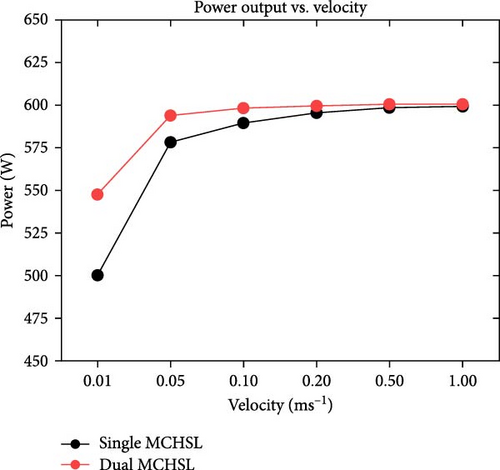
Electrical efficiency enhancement constitutes the focal point of this case study, which assessed the efficiency gain following the implementation of forced convection through varying MCHSs. In Figure 10a, the maximum efficiency of the agreed panel and the operating efficiency at our location are highlighted, showing 22.3% and 18.3% as the maximum and operating efficiency without applying heat transfer through forced convection, respectively. Subsequent Figure 10b presents the efficiency increment concerning changing velocities. Initially, at a velocity of 0.01 m/s, the efficiency of the PV layer reaches 18.55% and 20.3% for single- and double-layer MCHS arrangements, employing water as a coolant. Similarly, with an increased velocity of 0.05 m/s, the efficiency profile reaches around 22.0%, considering both cases of the geometries. Furthermore, efficiency approaches its maximum value with further changes in working fluid velocities. For instance, negligible variations in the new efficiency profile can be observed from 0.1 to 1.0 m/s velocities. At the final velocity of 1.0 m/s, the electrical efficiency improvement reaches the maximum value, with 22.22% and 22.27% for single and dual MCHS arrangements, respectively. In Figure 10c, an enhanced efficiency range is observable, ranging from 0.25% to precisely 4.0%. At 0.01 m/s, the efficiency gain is 0.25% and 2.0% for single and double-layer MCHSs, with a subsequent surge of 3.2% and 3.5% at 0.05 m/s velocity, respectively. However, further examination of velocities between 0.1 and 1.0 m/s reveals gradual and minor upward changes in improved efficiency between 3.5% and 4.0%. Also, regarding the power output, the diagram reflects the same trend as the new (after cooling) electrical efficiency. At the initial velocity value of 0.01 m/s, the system’s power output reaches exactly 500 W and roughly 550 W for single and double-layer MCHSs, respectively, as can be seen in Figure 10d. A notable improvement is evident at the next velocity of 0.05 m/s, where the power has 578 and 994 W values for dual MCHS configurations. Finally, from 0.1 to 1.0 m/s velocities, there is a minimal difference in the power of the PV panel, which nearly reaches its maximum value of ~600 W.
3.7. LCOE
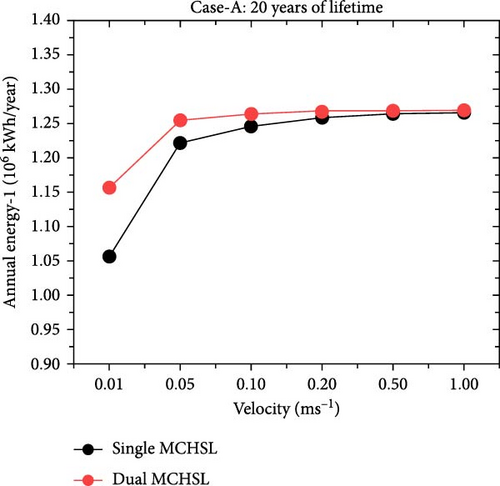
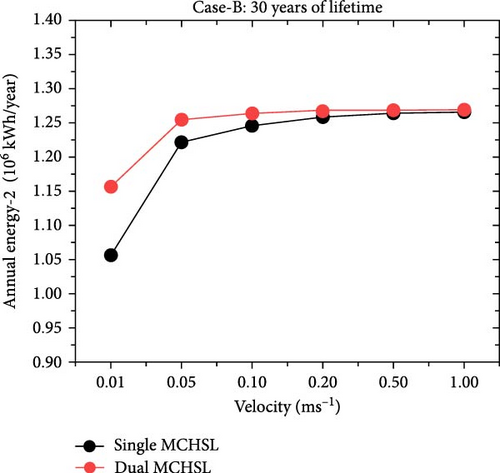
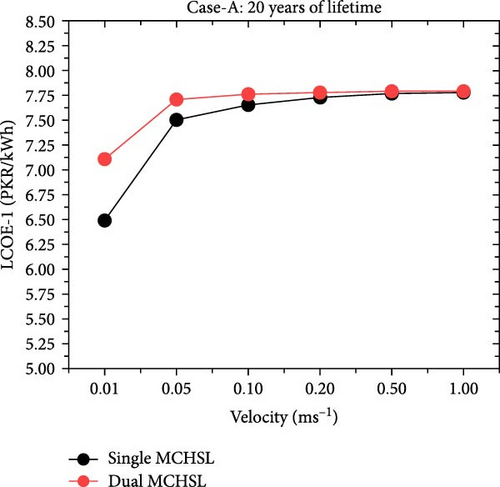
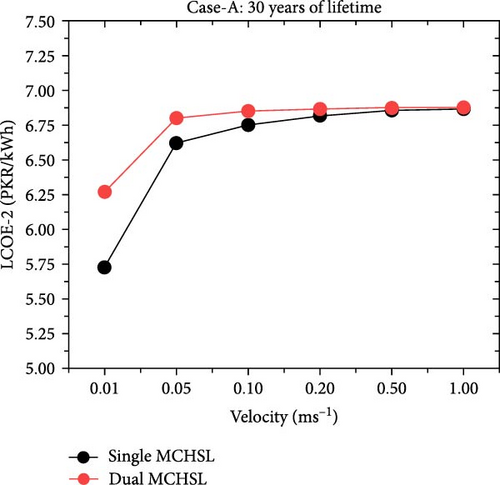
This section underscores the performance and cost-effectiveness of the energy system utilizing MCHS, evaluated under varying conditions of velocity, MCHS configuration (one-layer and two-layer MCHS), operational lifespan (30 years and 20 years), and the presence of cooling mechanisms given in Figure 11. The critical parameters analyzed are the annual energy output (kilowatt-hour) per year (kWh/year) and the LCOE in Pakistani Rupees per kilowatt-hour (PKR/kWh). For example, in the 30-year operational lifespan scenario (Case-B), increasing the velocity from 0.01 to 1 m/s led to significant changes in annual energy output for MCHS configurations. For the one-layer MCHS, the annual energy output increased from 1,056,564 kWh/year at 0.01 m/s to 1,266,281 kWh/year at 1 m/s, marking an improvement of ~19.85% (an increase of 209,717 kWh/year). The corresponding LCOE rose from 5.73 to 6.86 PKR/kWh, indicating that higher velocities enhance energy production and slightly increase the cost per unit of energy. However, the two-layer MCHS exhibited a similar trend, with annual energy output rising from 1,156,864 kWh/year at 0.01 m/s to 1,269,131 kWh/year at 1 m/s, an improvement of about 9.7% (a rise of 112,267 kWh/year). At 0.01 m/s, the two-layer configuration recovered 100,300 kWh/year more than the one-layer MCHS, but this advantage narrowed to 2,850 kWh/year at 1 m/s. The LCOE for the two-layer MCHS increased from 6.27 to 6.88 PKR/kWh over the same velocity range. Moreover, the impact of operational lifespan on LCOE was also significant. Reducing the lifespan from 30 to 20 years led to an increase in LCOE for both MCHS configurations due to the shorter amortization period of the initial investment. For the one-layer MCHS at 0.01 m/s, the LCOE rose from 5.73 PKR/kWh (30 years) to 6.49 PKR/kWh (20 years), an increase of almost 13.26%. The two-layer configuration experienced a similar LCOE increase from 6.27 to 7.11 PKR/kWh, ~13.40% higher. This pattern was consistent across all velocities, underscoring the importance of a longer operational lifespan for improved cost-effectiveness. The introduction of active cooling mechanisms profoundly affected the performance of both MCHSs. Without cooling, both the one-layer and two-layer MCHSs produced an annual energy output of 1,041,177 kWh/year. Initially, introducing cooling at 0.01 m/s increased the annual energy output to 1,056,564 kWh/year for the one-layer configuration and 1,156,864 kWh/year for the two-layer configuration. This represents improvements of 15,387 kWh/year (~1.48%) and 115,687 kWh/year (around 11.11%) for the one-layer and two-layer MCHSs, respectively, compared to the no-cooling scenario. At 1 m/s, the benefits of forced convection were even more pronounced. The one-layer MCHS’s annual energy output increased by 225,104 kWh/year (around 21.62%) to 1,266,281 kWh/year, while the two-layer configuration’s output rose by 227,954 kWh/year (almost 21.89%) to 1,269,131 kWh/year compared to the no-cooling situation. These substantial gains highlight the significant role of cooling mechanisms in enhancing energy production using MCHS configurations. In addition, while considering the annual energy output at rated efficiency, which is 1,273,120 kWh/year, both MCHS approached this maximum output at higher velocities with cooling. The LCOE at rated efficiency was 6.90 PKR/kWh for the 30-year lifespan and 7.82 PKR/kWh for the 20-year lifespan. At 1 m/s, the one-layer MCHS’s LCOE was 6.86 PKR/kWh, slightly below the LCOE at rated efficiency, indicating cost-effectiveness at high velocities. Finally, optimal operational conditions were identified between 0.2 and 0.5 m/s with cooling. Within this range, the one-layer MCHS produced between 1,258,303 and 1,264,572 kWh/year, with LCOE values ranging from 6.82 to 6.85 PKR/kWh. On the other hand, the two-layer configuration’s annual energy output was slightly higher, between 1,266,851 and 1,268,561 kWh/year, with LCOE values from 6.87 to 6.88 PKR/kWh. The marginal increases in energy output and minimal changes in LCOE at velocities beyond 0.5 m/s suggest declining returns, making this velocity range the most cost-effective for operation.
4. Conclusions
This research addresses the critical challenge of efficiency loss in PV modules due to extreme operating temperatures, which reduces electrical output and escalates the LCOE. Implementing thermal management through forced convection using MCHSs significantly enhanced electrical efficiency and annual energy recovery for a 600 W monocrystalline PV module under actual operating conditions in Lahore, Pakistan. After a profound and in-depth understanding of the cooling mechanisms, this system was assumed to be 1 MW, and annual energy recovery and LCOE were calculated. In addition, before cooling, the PV module’s average surface temperature reached 63.76 °C, reducing electrical efficiency from 22.33% to 18.33%. The dual-layer MCHS configuration, with water as the coolant at an inlet velocity of 1.0 m/s, reduced the surface temperature to ~25.65°C, achieving a temperature reduction of about 60%. This substantial decrease in operating temperature mitigated the efficiency loss, restoring the electrical efficiency to 22.27%, an efficiency gain of ~4%. The impact on annual energy recovery was significant because the dual-layer configuration at 1.0 m/s increased the annual energy output by 227,954 kWh/year, an improvement of about 21.89% compared to the no-cooling scenario, reaching a total of 1,269,131 kWh/year. Economically, the implementation of the dual-layer MCHS demonstrated improved cost-effectiveness. Over a 30-year operational lifespan, the LCOE was reduced to as low as 6.27 PKR/kWh at lower inlet velocity. Even at higher velocities, the LCOE remained competitive, approaching 6.88 PKR/kWh. This represents a considerable reduction compared to systems without efficient thermal management, making solar energy a more economically viable option. The optimal operational conditions were identified between inlet velocities of 0.2 and 0.5 m/s, balancing thermal performance, energy output, and cost-effectiveness. Moreover, the temperature uniformity reached as low as 0.67°C at an inlet velocity of 1.0 m/s, indicating a uniform temperature distribution. Future work may involve transient thermal analyses, exploring different microchannel geometries and materials, and comparing performance across diverse climatic conditions to optimize PV system efficiency and cost-effectiveness. Such advancements will be crucial in promoting the widespread adoption of solar energy technologies and contributing to global energy sustainability goals.
Nomenclature
-
- PV:
-
- Photovoltaic
-
- WFS:
-
- Working fluid streams
-
- CFDs:
-
- Computational fluid dynamics
-
- SSTA:
-
- Steady-state thermal analysis
-
- IEA:
-
- International Energy Efficiency
-
- PVT:
-
- Photovoltaic thermal
-
- MJSC:
-
- Multijunction solar cell
-
- MCHSs:
-
- Microchannel heat sinks
-
- MCHSL:
-
- Microchannel heat sinks layer
-
- 3D:
-
- Three-dimensional
-
- EVA:
-
- Ethylene-vinyl acetate
-
- PPV:
-
- Photovoltaic power
-
- Vmp:
-
- Voltage at maximum power
-
- Imp:
-
- Current at maximum power
-
- Voc:
-
- Open-circuit voltage
-
- Isc:
-
- Short-circuit current
-
- Vmax:
-
- Maximum voltage
-
- GPV:
-
- Solar flux
-
- αPV:
-
- Solar cells absorptivity
-
- qPV/i:
-
- Heat generation
-
- Tuni:
-
- Temperature uniformity
-
- nPV−n:
-
- Electrical efficiency (new)
-
- PPV−n:
-
- Power after cooling
-
- Tmax:
-
- Maximum temperature
-
- Tmin:
-
- Minimum temperature
-
- Apv:
-
- Surface area of PV system
-
- β:
-
- Temperature coefficient
-
- ρw:
-
- Water density
-
- μw:
-
- Dynamic viscosity of water
-
- Kw:
-
- Thermal conductivity of water
-
- Vw:
-
- Wind velocity
-
- nPV−r:
-
- Rated efficiency of PV
-
- Dh:
-
- Hydraulic diameter
-
- Re:
-
- Reynolds number.
Disclosure
This research is a part of employment and the employer’s name is De Montfort University UK.
Conflicts of Interest
The authors declare no conflicts of interest.
Funding
The authors received no specific funding for this work.
Acknowledgments
The authors have nothing to report.
Open Research
Data Availability Statement
Data will be available upon request.


