Nanoparticle-Assisted Bioethanol Production From Various Lignocellulosic Biomass
Abstract
This study explored nanoparticle (NP)-assisted bioethanol production from seven lignocellulosic biomass (LCB) types: corn cob (Zea mays), wheat bran (Triticum aestivum), sugarcane (Saccharum officinarum), magnolia (Magnolia grandiflora), London plane (Platanus acerifolia), chestnut (Castanea sativa), and wire grass (Aristida). A deashing step was employed to address the high ash content of the biomass utilizing citric acid trisodium dihydrate salt followed by autoclaving at 120°C for 4 h. The treated biomass was hydrolyzed using cerium-doped iron oxide (CeFe3O4) nanoparticles (NPs). Corn cob hydrolysis without pretreatment yielded the highest concentrations of glucose (33.5 ± 0.82 g/L) and xylose (26.7 ± 0.98 g/L). Subsequently, fermentation with Saccharomyces cerevisiae produced the highest ethanol concentration of 28.8 ± 1.63 g/L and a productivity of 2.39 ± 0.13 g/L/h within 12 h. CeFe3O4 NPs also, facilitated xylose metabolism and were recyclable. This method enhances biomass conversion efficiency, making bioethanol production more cost-effective and environmentally friendly.
1. Introduction
Environmental issues related to climate change and global warming emphasize the need for clean and sustainable fuel sources. As of 2021, renewable energy sources like biomass, solar, hydro, wind, and geothermal only constituted 15% of the primary energy supply, with fossil fuels at 80% [1]. Consequently, bioethanol, derived from lignocellulosic biomass (LCB), is a promising alternative due to its abundance and minimal competition with food crops [2]. LCBs are composed of cellulose, hemicellulose, lignin, ash, and protein. Only cellulose and hemicellulose can be converted into reducing sugars for ethanol production [3], while ash and lignin inhibit this process due to their resistance to chemical and enzymatic hydrolysis [2]. In this context, pretreatment is essential to break down LCBs, remove inhibitors, and increase ethanol yield without altering the structure of cellulose and hemicellulose. Despite various known pretreatment methods (physical, chemical, and physicochemical), they are often expensive and environmentally concerning [4].
The scientific community is exploring enzymatic breakdown using microorganisms like bacteria and fungi. Enzymes, such as laccase, xylanase, and cellulase are used in biomass hydrolysis, with laccase aiding delignification and making cellulose fibers more accessible. Combining these enzymes into cocktails enhances deconstruction and increases fermentable sugar yields under mild conditions, reducing the need for severe hydrolysis. Bhardwaj et al. [5] showed that enzyme cocktails can efficiently hydrolyze rice straw, releasing more glucose and xylose compared to individual commercial enzymes [6]. Thus, this study attempted to utilize an in-house enzyme cocktail produced by the Fusarium verticillioides fungal strain to increase total sugar yield.
The recalcitrant nature of plant cell walls, due to the presence of inorganic compounds (ash), poses challenges for biomass conversion technologies. High ash content increases costs and logistical challenges for solid waste disposal. Advanced preprocessing methods for deashing are required to remove ash effectively. Deashing is the process of removing noncombustible ash components, which include inorganic substances, such as silica, alumina, and various metal oxides, from biomass materials. Demineralization/deashing methods using hot water, deionized water, and strong acids can remove alkaline ions but may degrade hemicellulose and cellulose. Reducing ash content is crucial for improving conversion processes and reducing waste disposal costs. Citric acid, a biodegradable and cost-effective chelating agent, can remove minerals without damaging biomass components, thereby enhancing conversion efficiency [7].
Considering the need for research into new technological alternatives, nanotechnology offers promising solutions by altering the characteristics of feed materials and biocatalysts for biofuel production. Some nanoparticles (NPs) mimic the catalytic properties of enzymes and are called “nanozymes.” Although initially costly, nanomaterials offer long-term benefits like enhanced production yields, reduced enzyme and energy costs, and recyclability [8, 9]. Advances in synthesis techniques may reduce production costs, enhancing economic viability. Various NPs, including Fe3O4, CeO2, TiO2, and Co3O4, have been explored for enzyme-mimicking activities and are suitable for novel biorefining applications as nanozymes [8–10].
A prior study by Kim et al. [4] optimized the production of fermentable sugars from raw corn cob (Zea mays) using cerium-doped iron oxide NPs, achieving glucose and xylose levels of 20.3 and 22.0 g/L, respectively [4]. This study aims to further increase bioethanol concentration by screening alternative biomass resources, employing deashing methods to enhance cellulose accessibility, and optimizing buffer concentration and pH during simultaneous pretreatment (i.e., delignification) and saccharification (SPS) processes of biomass. Key findings include identifying biomass sources for high bioethanol yields and converting xylose to ethanol using wild-type Saccharomyces cerevisiae, enhancing the economic viability of bioethanol production.
2. Materials and Methods
2.1. Materials
Biomass, including magnolia (Magnolia grandiflora) leaves, chestnut (Castanea sativa) leaves, London plane (Platanus acerifolia) leaves, and wire grass (Aristida) was collected from the Chungbuk National University campus. Corn cob was purchased from the local market of Cheongju, Korea, and sugarcane (Saccharum officinarum) bagasse was collected from the juice shops in India. All biomass was dried at 60–65°C in an oven. Once dried, the biomass was finely ground into powder and sieved to obtain particles with a size of 50 µm [11]. This powdered biomass was collected and intended for use in hydrolysis experiments. Iron chloride hexahydrate (FeCl3 · 6H2O, 98.0%), ammonia solution (25%), cerium nitrate hexahydrate (, 99.0%), and acetic acid (>99.0%) were purchased from Samchun Chemicals Company, Korea. Folin-Ciocalteau reagent, N,O-bis (trimethylsilyl) trifluoroacetamide, dinitrosalicylic acid (DNS), carboxymethyl cellulose (CMC), and p-nitrophenyl-β-D-glucopyranoside (p-NPG), and 2,2′-azino-bis(3-ethylbenzothiazoline-6-sulfonic acid) diammonium salt (ABTS) were procured from Sigma–Aldrich, USA. Iron sulfate heptahydrate (FeSO4 · 7H2O, 98.0%) was purchased from Junsei Chemical Company, Japan.
2.2. Fungal Strain, Culture Medium, and Enzyme Production
An isolated Fusarium verticillioides fungal strain in our lab was used for cellulase and hemicellulase enzyme production [12]. This fungus strain was subcultured on potato dextrose agar (PDA) plates containing (g/L): potato starch 4 g, dextrose 20 g, and agar 2 g, and incubated at 30°C for 28 h to maintain on a monthly basis for further use.
Solid state fermentation (SSF) experiments were carried out in 500 mL Erlenmeyer flasks. The basal medium composition (g/L) is as follows: KH2PO4 1.0, CaCl2 0.15, MnSO4.7H2O 0.0024, ZnSO4.7H2O 0.0021, NH2(CO)NH2 0.60, 0.50, MgSO4.7H2O 0.15, CoCl2 0.003, FeSO4.7H2O 0.0075, peptone 0.45, yeast extract 0.15, and 1% (v/v) Tween 80. Additionally, the flasks contained a mixture of basal medium, wheat bran (Triticum aestivum), and cellulose powder in an 8:4:1 ratio, then inoculated with spores suspended in a saline solution. The fermentation process adhered to the methodology previously reported [4, 12]. Enzyme was extracted using the different concentration of sodium citrate buffer at 45°C for 2 h with shaking. The squeezed supernatant from the SSF solution was centrifuged for 5 min at 13,000 rpm. The supernatant was filtered using Whatman No. 1 filter paper (0.45 µm) and the resulting clear, cell-free enzyme was used for biomass hydrolysis and analysis of extracellular cellulase activity. In this process, the enzyme was extracted with three different concentrations (0.5, 5, and 50 mM) of sodium citrate buffer to optimize the effect of buffer concentration on the hydrolysis and fermentation of the screened biomass (corn cob).
2.3. Synthesis and Characterization of CeFe3O4 NPs
Initially, iron oxide was synthesized via the coprecipitation method. FeCl2.6H2O and ferrous sulfate heptahydrate (FeSO4.7H2O) were taken as 2:1 molar ratio in distilled water and mixed with the 25% aqueous ammonia solution (2:1, v/v) dropwise at 50–60°C for 1 h. Subsequently, was added (2.5% of distilled H2O) as a precursor. After transferring the solution into teflon autoclave reactor, it was heated for 10 h at 120°C (Figure S1). Furthermore, the morphology, size, composition of elements, and structure of the synthesized powder of CeFe3O4 NPs were analyzed using scanning electron microscopy (SEM) (Figure S4b), transmission electron microscopy (TEM) at a voltage of 120 kV, and energy dispersive X-ray spectroscopy (EDS) [12]. To prepare the samples for TEM analysis, CeFe3O4 NPs were dispersed in water and sonicated for 20 min. The dispersed samples were then adsorbed onto 200-mesh copper grids for 1–2 min at room temperature before being examined using TEM. Additionally, Fourier transform-infrared spectroscopy (FTIR) analysis of the prepared NPs was conducted using an FTIR spectrometer (Thermo Fisher Scientific) with the KBr pellet technique.
2.4. Enzyme Activity Determination
2.4.1. Determination of Cellulase and Hemicellulase Activity of SSF Enzyme and CeFe3O4 NPs
Cellulase and hemicellulase activities were evaluated for the obtained enzyme through SSF and CeFe3O4 NPs, using the standard method derived by Hu et al. [13]. In this assays, Whatman no.1 filter paper (0.45 µm) for exoglucanase (FPase) activity, 2% CMC solution for endoglucanase (CMCase) activity, p-NPG for β-glucosidase activity, and xylan for xylanase activity were utilized as specific substrates. All substrate solutions were prepared in citrate buffer condition (5 mM, pH 5) at 50°C [12].
2.4.2. Determination of Laccase-Mimicking Activity of CeFe3O4 NPs
To assess the laccase activity of NPs, a reaction mixture consisting of 0.43 mL sodium acetate buffer (100 mM, pH 5), 0.05 mL NP solution (4 g/L), and 0.30 mL substrate solution was incubated at room temperature for 30 min. The laccase activity was evaluated using ABTS as a substrate. The oxidation levels of the samples were measured at a wavelength of 420 nm [14].
2.5. Deashing Pretreatment for Biomass Samples
Deashing treatments of all raw biomass were performed in autoclave at 120°C for 4 h after washing with hot water and acetone (Figure S2). In this process, citric acid trisodium salt dihydrate (a chelating agent) binds metal ions with covalent bonds, effectively removing them from the cross-linked structure of the biomass. To facilitate the effective removal of structurally bound inorganic metal contents by chelating agents, loosely bound and other nonstructural, polar inorganics were first removed by washing with boiling water. Acetone was used to remove nonpolar extractives, ensuring more consistency in studying the effects of chelation on structural ash. The solid residue was then, subjected to chelation and autoclaved with 1% citric acid trisodium salt dihydrate in water for 4 h at 120°C. After autoclaving, the solid residue was filtered using Whatman filter paper (0.2 µm, 200 mm) and washed again with boiling water and acetone to remove surface-chelated metals [7]. Finally, the solid fraction was collected and placed into an oven at 105°C to dry and then utilized for further use.
2.6. SPS Process
Raw biomass and deashed biomass powder (50 µm) were used as feedstock for hydrolysis, along with CeFe3O4NPs, an in-house enzyme, and a citrate buffer solution (5 mM, pH 5). The synthesized CeFe3O4 NPs served as a laccase-mimicking material for delignifying biomass. Additionally, cellulase and hemicellulase derived from SSF were employed to enhance the SPS process. The enzymatic hydrolysis was conducted in a 50 mL conical flask in a rotary incubator (55°C, 200 rpm) for 24 h. Hydrolysate samples were extracted by centrifugation to isolate the solid residue and CeFe3O4 NPs, allowing the hydrolysate to be used in fermentation. All SPS experiments adhered to optimized parameters established in a prior study by Kim et al. [4], which included a 20% w/v substrate loading, 2% CeFe3O4 NPs relative to the substrate, and an enzyme concentration of 5.0 FPU/g of substrate. This study aimed to evaluate the sugar released during the SPS process using both untreated and deashed biomass. The concentration of glucose and xylose in the supernatant was analyzed by high-performance liquid chromatography (HPLC), while reducing sugars were measured using the DNS method.
2.7. Bioethanol Fermentation by S. cerevisiae
The wild-type S. cerevisiae strain was employed for bioethanol fermentation studies. This yeast strain was periodically maintained on yeast extract, peptone, and dextrose (YPD) plates [15]. To inoculate the strain into hydrolysate, S. cerevisiae was cultured in YM media for 12 h at 30°C with shaking at 200 rpm. A 12 h-old inoculum of S. cerevisiae (5%, v/v) was then added to centrifuged hydrolysate. Malt extract (3.0 g/L), yeast extract (3.0 g/L), and peptone (5.0 g/L) were included as nutrients, and the culture was incubated at 30 °C with shaking at 200 rpm. Samples of the fermented broth were collected at 6 h intervals up to 24 h. The resulting fermented broth was analyzed for glucose, xylose, and ethanol concentrations using HPLC.
2.8. Recycle and Recovery of CeFe3O4 NPs
After the SPS process was carried out for 24 h, the liquid and solid parts were separated by centrifugation to obtain hydrolysate for fermentation. To reduce the viscosity of the solid residue, 20 mL of distilled water was added and sonicated for 10 min. The solution was gradually poured, and the NPs were separated using a magnet bar (Figure S3). Separated NPs were washed twice with distilled water and the same process was repeated three times for maximum recovery with sonication. The recovered CeFe3O4 NPs were dried in a lyophilizer and then reused in the SPS process by following the same procedure (Section 2.3) to assess their efficacy. The reusability of CeFe3O4 NPs was evaluated through four consecutive runs using the recovered NPs.
2.9. Biomass Characterization Before and After SPS
Multiscale approaches were utilized to investigate the molecular and microscale variability of biomass. This included analyzing compositional, structural, and physicochemical attributes. The morphology and functionality were assessed for both raw biomass and treated biomass samples after the SPS process. The dried biomass was mixed thoroughly with KBr powder and then placed in a metallic stub. The mixture was pressed to form a pellet, and images were captured by Thermo Fisher FT-IR spectrometer (Model: Nicolet summit iD1 transmission) with an Omnic Paradigm software. The analysis was performed over the range of 400 − 4000 cm−1 at a spectral resolution. The spectra evaluated the presence of functional groups, absorption peaks, band intensities, and stretching vibrations on the surface of the biomass samples that constitute lignin, cellulose, and hemicellulose structures [16]. The EDS analysis revealed a change in morphology after the SPS process and composition effect after the deashing treatment. Samples were prepared for analysis by mounting them onto stubs using carbon tape and sputter coated with platinum using a Cressington Sputter Coater. Images were then captured at an accelerating voltage of 3 kV using a Field Emission Scanning Electron Microscope (Plus) II, (Model: Ultra Plus). The dried samples were analyzed for powder X-ray diffraction (XRD) patterns using a PANalytical, X’Pert-Pro diffractometer (Model: D8 Discover with GADDS; detector: SC-70) with a Cu-Kα radiation at λ = 1.540593Å, operated at room temperature at 45 kV tension and 200 mA current.
The diffractograms were obtained by scanning 2θ angles from 5 to 100°/min rate. The crystallinity index (CrI) and average crystallite size (D) for both samples were determined using the Segal equation [17].
2.10. Analytical Methods
The biocompositional fraction of raw biomass and deashed biomass samples were calculated as per reported procedures [18–20]. Total reducing sugar concentration in samples was estimated by DNS method. The concentrations of glucose, xylose, and ethanol (g/L) were determined using an HPLC system (Model: YL 9100, Young-Lin, Inc., Korea) during the SPS and fermentation process. Prior to analysis, samples were centrifuged and filtered through a 0.25 µm syringe filter. The system featured a Bio-Rad Aminex HPX-87H column and a differential refractive index detector. The mobile phase was an aqueous solution of 5 mM H2SO4 with a flow rate of 0.6 mL/min. The column temperature was maintained at 65°C. Each sample had an injection volume of 10 μL, with a total run time of 30 min. The retention times for glucose, xylose, and ethanol peaks were 8.26, 8.93, and 22.55 min, respectively [4]. The concentration of glucose, xylose, and ethanol (g/L), yield, and productivity (g/L/h) of the process were calculated as reported [21]. All experiments in this study were conducted in triplicate, and the resulting data points were analyzed statistically. The average values, along with the corresponding errors, were reported.
3. Results and Discussion
3.1. Biomass Compositional Analysis
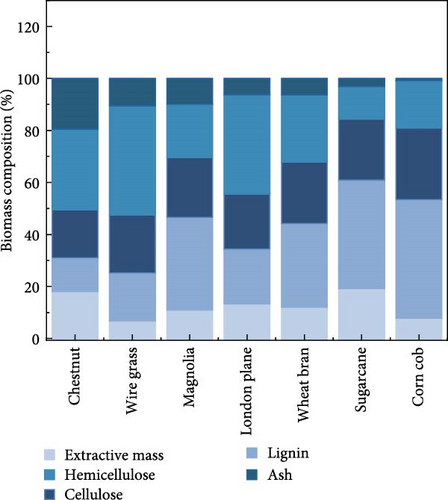
Seven biomasses (corn cob, wheat bran, sugarcane, London plane, magnolia, wire grass, and chestnut) were utilized to screen the suitable biomass for the bioethanol production. As a preliminary screening tool, compositional fraction analysis of biomass before and after deashing treatment was used to identify the best biomass among all biomasses, and to determine the deashing effect on compositional fraction. The main components in biomass are cellulose, hemicellulose, lignin, ash, and extractive mass. Among these components, only cellulose and hemicellulose are further converted into sugars, while ash and lignin are hindered for the hydrolysis. The biochemical composition of the raw and deashed samples is summarized in Table 1. The cellulose content was in the range of 18.5%–27.5% (w/w), while the hemicellulose content was between 13.0% and 45.7% (w/w). Additionally, biomass contained other components, such as ash (0.94%–19.6% w/w), lignin (7.70%–18.0% w/w), and extractives mass (7.70%–18.0% w/w). The highest cellulose and hemicellulose contents were estimated in corn cob at 27.5% and 45.7%, respectively, while the lowest cellulose (18.5%) and hemicellulose (13.0%) were calculated for chestnut. Corn cob exhibited a relatively low ash content compared to the other biomass materials. The corn cob biomass with lower ash content could be a better option as a feedstock for bioethanol production. This is because corn cob does not require the deashing pretreatment step, which could result in lower overall costs than other biomass feedstocks. In contrast, chestnut was found to have the highest ash content, reaching up to 19.6% which needs to be removed to expose cellulose and hemicellulose moieties.
| Biomass composition | Chestnut | Wire grass | Magnolia | London plane | Wheat bran | Sugarcane | Corn cob | ||||||||||||||
|---|---|---|---|---|---|---|---|---|---|---|---|---|---|---|---|---|---|---|---|---|---|
| Raw (g) | After SPS (g) | Conversion (%) | Raw (g) | After SPS (g) | Conversion (%) | Raw (g) | After SPS (g) | Conversion (%) | Raw (g) | After SPS (g) | Conversion (%) | Raw (g) | After SPS (g) | Conversion (%) | Raw (g) | After SPS (g) | Conversion (%) | Raw (g) | After SPS (g) | Conversion (%) | |
| Extractive Massb | 0.71 | — | — | 0.27 | — | — | 0.44 | — | — | 0.53 | — | — | 0.48 | — | — | 0.77 | — | — | 0.30 | — | — |
| % | 18.0 | — | — | 6.80 | — | — | 10.9 | — | — | 13.3 | — | — | 12.0 | — | — | 19.1 | — | — | 7.70 | — | — |
| Extractive Massa | 0.69 | — | — | 0.24 | — | — | 0.40 | — | — | 0.49 | — | — | 0.40 | — | — | 0.73 | — | — | 0.29 | — | — |
| % | 17.1 | — | — | 6.02 | — | — | 9.88 | — | — | 12.3 | — | — | 10.0 | — | — | 18.2 | — | — | 7.41 | — | — |
| Hemicelluloseb | 0.52 | 0.46 | 10.57 | 0.73 | 0.67 | 8.35 | 1.43 | 1.30 | 8.51 | 0.84 | 0.72 | 13.18 | 1.29 | 1.13 | 11.95 | 1.67 | 1.22 | 16.28 | 1.82 | 1.16 | 36.24 |
| % | 13.0 | — | — | 18.4 | — | — | 35.7 | — | — | 21.1 | — | — | 32.2 | — | — | 41.7 | — | — | 45.7 | — | — |
| Hemicellulosea | 0.64 | 0.54 | 14.89 | 0.92 | 0.80 | 12.85 | 1.59 | 1.43 | 9.70 | 1.00 | 0.84 | 15.27 | 1.43 | 1.23 | 13.73 | 1.71 | 1.36 | 20.32 | 1.83 | 1.13 | 38.17 |
| % | 16.0 | — | — | 23.0 | — | — | 39.7 | — | — | 25.0 | — | — | 35.7 | — | — | 42.7 | — | — | 45.9 | — | — |
| Celluloseb | 0.73 | 0.68 | 6.53 | 0.89 | 0.80 | 9.52 | 0.92 | 0.80 | 12.86 | 0.84 | 0.72 | 13.68 | 0.94 | 0.77 | 18.08 | 0.94 | 0.68 | 26.74 | 1.10 | 0.52 | 52.57 |
| % | 18.5 | — | — | 22.3 | — | — | 23.0 | — | — | 21.1 | — | — | 23.6 | — | — | 23.5 | — | — | 27.5 | — | — |
| Cellulosea | 0.82 | 0.73 | 10.71 | 0.97 | 0.83 | 14.34 | 0.99 | 0.82 | 16.99 | 0.88 | 0.69 | 21.10 | 1.05 | 0.84 | 19.62 | 0.98 | 0.65 | 33.44 | 1.10 | 0.52 | 52.32 |
| % | 20.4 | — | — | 24.3 | — | — | 24.8 | — | — | 21.9 | — | — | 26.3 | — | — | 24.5 | — | — | 27.6 | — | — |
| Ligninb | 1.23 | 0.6 | 51.20 | 1.67 | 0.92 | 45.09 | 0.82 | 0.44 | 46.25 | 1.53 | 0.11 | 42.58 | 1.03 | 0.52 | 50.02 | 0.50 | 0.23 | 52.87 | 0.72 | 0.38 | 47.81 |
| % | 31.0 | — | — | 41.9 | — | — | 20.6 | — | — | 38.2 | — | — | 25.7 | — | — | 12.5 | — | — | 18.1 | — | — |
| Lignina | 1.24 | 0.59 | 52.03 | 1.61 | 0.85 | 46.66 | 0.80 | 0.42 | 46.94 | 1.46 | 0.78 | 46.01 | 0.97 | 0.46 | 51.9 | 0.50 | 0.24 | 53.07 | 0.73 | 0.37 | 48.24 |
| % | 30.9 | — | — | 40.2 | — | — | 20.0 | — | — | 36.5 | — | — | 24.3 | — | — | 12.5 | — | — | 18.3 | — | — |
| Ashb | 0.78 | 0.76 | 3.32 | 0.42 | 0.40 | 4.30 | 0.40 | 0.38 | 3.11 | 0.25 | 0.24 | 2.22 | 0.26 | 0.24 | 2.89 | 0.12 | 0.11 | 5.23 | 0.038 | — | — |
| % | 19.6 | — | — | 10.6 | — | — | 9.92 | — | — | 6.30 | — | — | 6.44 | — | — | 3.10 | — | — | 0.94 | — | — |
| Asha | 0.62 | 0.57 | 6.88 | 0.25 | 0.23 | 7.05 | 0.23 | 0.21 | 7.71 | 0.17 | 0.15 | 8.55 | 0.15 | 0.13 | 8.84 | 0.08 | 0.06 | 17.51 | 0.036 | — | — |
| % | 15.6 | — | — | 6.37 | — | — | 5.65 | — | — | 4.30 | — | — | 3.68 | — | — | 2.10 | — | — | 0.89 | — | — |
- Note: Each sample was analyzed using 4 g of biomass, and the values were obtained from three independent experiments.
- aComposition of biomass after deashing treatment.
- bComposition of biomass before deashing treatment.
In this study, magnolia, wheat bran, and corn cob were observed to have higher hemicellulose content compared to cellulose. Similar findings were reported by Kim et al. [4] for corn cob and by Lin et al. [22] for rice straw, both of which also had high hemicellulose content. Additionally, the lignin content of corn cob was 18.1%, which was also comparatively lower than the other biomasses, excluding sugarcane (12.5%). As reported, both ash and lignin are components of biomass that can pose challenges for hydrolysis, and these were relatively lower in the case of corn cob in this study. Therefore, corn cob might be considered the best biomass among the samples evaluated, as it exhibited lower ash as well as lignin contents, which could lead to less severe pretreatment requirements and lower overall costs for bioethanol production.
3.1.1. Deashing Effects on Biomass Composition
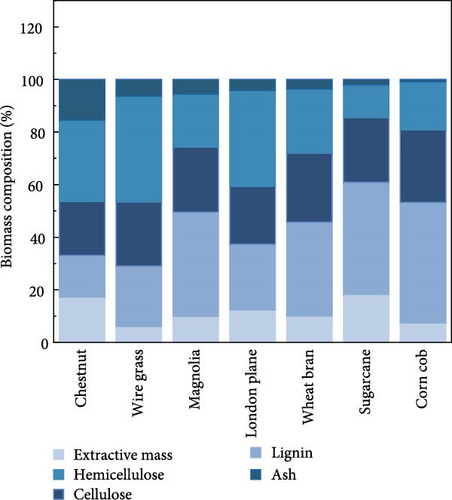
The composition of biomass was determined after deashing and compared to the raw biomass. The ash removal efficiency depended on the overall composition of the biomass. The maximum ash reduction was observed in the case of magnolia, where the ash content decreased from 9.92% to 5.65%, along with slight changes in other composition, as depicted in Figure 1a,b. All biomass samples were treated with a 1% concentration of citric acid trisodium salt dihydrate in water. The reduced ash content for all biomass samples is summarized in Table 1 along with the other components.

Citric acid trisodium dihydrate salt, containing three ionizable carboxylic acid groups and two hydroxyl groups (─OH), acts as an excellent chelating agent. Sodium citrate facilitates the depolymerization of lignin and enables citrate ions to bond with metal ions. Consequently, the inorganic metals are removed as chelates. Lignin exhibits reactivity at low temperatures and in basic media, while cellulose and hemicellulose remain unreactive due to the covalent bonds of inorganic metals within the cross-linked structure of lignin [7, 23]. However, with cellulose and hemicellulose at low temperature, there is no possibility to form the bond with inorganic compounds. Therefore, deashing process slightly changes lignin composition without affecting the cellulose and hemicellulose compositions.
3.1.2. Microscopic Analysis of Raw Biomass and Deashed Biomass
The inorganic content of biomass before and after deashing is presented in Table S1. Potassium (K), calcium (Ca), aluminum (Al), and sodium (Na) are the other main inorganics. EDS analyses were performed on raw biomass and treated biomass to determine the significant changes in the inorganic component of biomass (Table S1).
Sodium citrate is a polydentate ligand and can be used to remove tetravalent ions. It can potentially remove the inorganic metal anions from biomass. This is confirmed by the EDS analysis results (Figure S6). The element of all biomasses, including magnesium (Mg), sulfur (S), phosphorus (P), iron (Fe), chlorine (Cl), and K decreased rapidly through the deashing process. P was completely removed from the treated biomass, except for wheat bran biomass. Wheat bran biomass had a high percentage of P at 12.2%, and after the treatment, the remaining P content was only 4.4%. For the other biomass samples, no P remained after the treatment (Table S1).
The silicon was the most abundant element, except for corn cob, London plane, and wheat bran. Si mainly exist in the form of silicon dioxide (SiO2) at low temperature. The presence of inorganic acid (citrate ion) can destroy the C─O─Si structure. With the addition of the citrate ion, the silicon can possess multiple valances in biomass, namely bi, tri, or tetradentate [24]. Polydentate silicon and other polydentate cations form a soluble chelate and are thus, released from the structure of the biomass. Deashing reduced the Si content of sugarcane from 58.3% to 20.0%, corn cob from 10.5% to 3.5%, chestnut from 58.2% to 17.4%, wire grass from 93.8% to 86.3%, magnolia from 9.54% to 6.8%, London plane from 8.92% to 2.29%, and wheat bran from 4.4% to 1.5%. S was observed as a second most abundant inorganic content after Si in agricultural waste, such as corn cob (22.6%), sugarcane (26.7%), and wheat bran (26.7%). On the other hand, in forestry waste, the highest S content was 7.2% in chestnut, whereas others were lower, with wire grass at 4.2%, magnolia at 5.73%, and London plane at 4.0%. Despite the higher initial percentage of S, the final amounts remained very low: corn cob (4.40%), sugarcane (16.7%), and wheat bran (6.10%). Reduction in S percentage did not depend solely on the individual content but was influenced by the other components present in the biomass. K and Cl were removed significantly with deashing treatment. The reason K was removed is because K, typically found in the form of halogen salts, such as KCl, is an alkali metal [24]. Similarly, Cl bound with monovalent cations to form monovalent ionic salts, which were easily dissolved in hot water and could be removed without using a chelate agent. In this study, Cl was completely removed from corn cob and chestnut, whereas after deashing, wire grass and magnolia had traces of Cl at 0.70% and 0.29%, respectively. Furthermore, divalent ions (Ca, Mg, and Fe) were removed by the reaction with sodium citrate. In the biomass samples, the range of Ca was 2.70%–83.8%, the range of Mg was 0%–11.1%, and the range of Fe was 0%–13.7%. After deashing, the ranges changed to Ca (0%–41.7%), Mg (0%–8.40%), and Fe (0%–2.20%). Al contents were also found in biomass. Excluding sugarcane (13.3%), all was less than 5% and there were no significant changes after treatment. Additionally, Mn was found only in the sample of chestnut (8.70%), wheat bran (4.40%), London plane (2.20%), and magnolia (0.64%), which remained after treatment at 4.50%, 0.80%, 0.40%, and 0%, respectively.
3.1.3. Ash Removal Efficiency
The impact of deashing on biomass was further verified by evaluating the ash content before and after treatment, following the standard NREL method, as shown in Figure 1c. The highest ash removal efficiency was 43.0% for magnolia and 42.9% for wheat bran. Other biomass samples showed lower efficiencies: wire grass at 39.9%, sugarcane at 32.3%, London plane at 31.7%, and chestnut at 20.4%. Corn cob had the lowest ash removal efficiency of 5.31%, due to its very low initial ash content of 0.94% in the raw biomass. Overall, deashing treatment by the citric acid trisodium salt dihydrate significantly reduced the ash content in all biomasses. The variation in chemical compositions and inorganic content of biomass have the possible reason for the different removal efficiency of ash. The deashing process was beneficial for the conversion of biomass to bioethanol, as it is an eco-friendly and cost-effective approach. However, in the case of corn cob, there is no need for deashing due to its very low initial ash content. This result provides a screening of biomass, where corn cob as a best biomass can be further utilized for the hydrolysis process to produce high concentrations of ethanol.
3.2. Multiscale Characterization of Synthesized CeFe3O4 Magnetic NPs
3.2.1. Morphology Analysis: EDS, SEM, and TEM
EDS is a rapid and effective characterization tool for confirming the successful synthesis of NPs. This technique is used in conjunction with SEM to measure NPs and determine their chemical composition. EDS can identify the elements present in the sample and their distribution and concentration by detecting the emission of various elements [25]. From this characterization, we verified the synthesis of CeFe3O4 NPs and determined the elemental composition including Ce, Fe, and O (Figure S4a). TEM analysis revealed that the average size of the NPs ranged from 8.70 to 16.05 nm (Figure S4c).
3.2.2. X-Ray Photoelectron Spectroscopy (XPS) Analysis
To determine the oxidation state of different elements and their electronic structures on the surface of the CeFe3O4 NPs, an evaluation of the elemental composition using XPS was conducted. Deconvoluted XPS spectra including the survey peak spectra of the synthesized CeFe3O4 NPs shows the Ce 3d, Fe 2p, and O 1s states of the elements present in the sample (Figures S4d–S4g).
3.2.3. XRD Analysis
XRD is a ubiquitous approach that can offer additional information to other microscopic and spectroscopic techniques. This includes identifying the phase of a sample, measuring the size of its crystallites, and degree of crystallinity percentage, determining its purity, and in some cases, providing other useful insights, for instance the dimensionality of dopants within a crystal lattice. Specifically, the distribution of ions between tetrahedral and octahedral sites is influenced by cation size, charge, and the size of the interstices [26, 27]. To verify these properties of the synthesized sample, the XRD patterns of the CeFe3O4 sample was investigated (Figure S4h). Crystalline size of 11.5 nm was calculated by XRD data, which aligns with the result obtained from TEM analysis. This confirms that the crystalline size has been verified through TEM and XRD analysis. Their nanoscale size promotes a high surface-to-volume ratio and efficient dispersion, enabling enhanced contact with lignocellulosic fibers and minimizing aggregation, thereby promoting interaction with lignin, cellulose, and hemicellulose components.
3.2.4. Funtional Group Analysis: FTIR
For the analysis of functional groups in the synthesized NPs, FTIR is the preferred method. FTIR spectra provide valuable insights into molecular structures by detecting chemical bonds and functional groups. In the FTIR spectra shown in Figure S4i for CeFe3O4 NPs, magnetite displays two bands within the 400–800 cm−1 range. The spectrum spanning 4000–400 cm−1 reveals peaks at 3392.56 cm−1 and 1644.09 cm−1, indicating stretching and bending vibrations of hydroxyl groups, respectively, suggesting the presence of adsorbed water on the NPs’ surface. In the 1000–600 cm−1 region, peaks at 578.54 cm−1 and a shoulder at 635.42 cm−1 correspond to intrinsic stretching vibrations of metal at the tetrahedral site (Fe tetra─O). This band results from the splitting of the high-frequency band at 577.09 cm−1, which corresponds to the Fe─O bond in bulk magnetite [26].
The NPs display reduced cell parameters compared to bulk magnetite, causing the unit cell to contract, which shortens bond lengths and strengthens bonds. As a result, bands shift towards higher wavenumbers. The frequency difference indicates that the vibration mode of the tetrahedral cluster is higher than that of an octahedral cluster [28]. The absorption bands at 558.77 cm−1 become broader and less intense due to the incorporation of Ce4+ ions into the lattice, resulting in a shifted absorption band at 558.77 cm−1. This shift is attributed to changes in bonding forces between cations and oxygen anions induced by the presence of cerium ions. Additionally, Ce-doped NP samples exhibit a distinct absorption band at 431.01 cm−1.
3.3. Enzyme Mimicking Behavior of CeFe3O4 NPs
Pleurotus ostreatus is a promising indigenous strain to produce laccase as a polyphenol oxidoreductase enzyme. It can catalyze the phenolic compounds while simultaneously reducing O2 to H2O, such as degradation of lignin, bleaching of pulp, detoxification of water,dye removal, etc. [29]. Similarly, CeFe3O4 NPs have been reported for imitating the laccase activity [4]. Cerium exhibits two oxidation states Ce3+ and Ce4+ as well as two oxide forms CeO2 (Ce4+) or Ce2O3 (Ce3+) in bulk. The presence of Ce3+ leads to oxygen vacancies in the lattice, creating oxygen defects in NPs, which serve as sites of catalytic reactions. The mixed valance state also enables the scavenging of reactive oxygen, resulting in the rapid transition of oxidation state between Ce3+ and Ce4+ [10, 30].
The laccase activity of the prepared CeFe3O4 NPs was investigated following the standard assay procedure (Section 2.4.2). The addition of CeFe3O4 NPs to the reaction mixture led to the oxidation of ABTS substrates, resulting in a color change (from colorless to dark sea-green) and an absorbance peak at 420 nm indicating the higher affinity. Laccase activity of the synthesized CeFe3O4 NPs was estimated to be 0.319 ± 0.051 IU/mg NPs using ABTS substrates. On the other hand, the EDS spectra of CeFe2O3 NPs (Figure S4) revealed a significantly higher mass percentage of cerium (44.3%) compared to iron (21.6%), which contributes to laccase activity. Some researchers investigated higher oxidase activity may be achievable in the presence of Ce4+ [10]. Here, we can find other supporting evidence for high laccase activity in XPS outcome spectra. In XPS spectra, Ce4+ is more prominent than Ce3+ on the surface of NPs. Furthermore, the cellulase and xylanase mimicking activities of CeFe3O4 NPs were also measured by following the standard assay methods (Section 2.4.1). Cellulase is a complex of enzymes, including CMCase, FPase, and cellobiohydrolases (β-glucosidase, break down crystalline cellulose and release glucose). CMCase acts on the noncrystalline regions of cellulose to release oligomers and cellobiose by breaking the β-1,4 glycosidic bond. FPase releases cellobiose molecules from the nonreducing end of fiber molecules. β-Glucosidases further decompose cellobiose and other low-molecular-weight cellodextrins into glucose units [31, 32]. Xylanolytic enzymes are pivotal in breaking down the intricate structure of xylan into its component sugars, thereby facilitating the efficient biomass hydrolysis process [5]. In this study, we also investigated the cellulase and hemicellulase mimicking activities of CeFe3O4 NPs, as detailed in Table 2. Among the cellulases, β-glucosidase displayed higher activity (0.283 ± 0.0133 IU/mg) compared to FPase (0.07 ± 0.015 IU/mg) and CMCase (0.041 ± 0.0011 IU/mg). Additionally, CeFe3O4 NPs exhibited xylanase activity (0.075 ± 0.0042 IU/mg) when xylan was used as a substrate.
| Material | Cellulase activity | Xylanase activity | Laccase activity | ||
|---|---|---|---|---|---|
| Exoglycanase | Endoglucanase | β-Glucosidase | |||
| Supernatant enzyme (IU/g) | 22.0 ± 0.935 | 8.86 ± 0.810 | 2.51 ± 0.747 | 17.2 ± 0.386 | — |
| CeFe3O4 NPs (IU/mg) | 0.070 ± 0.015 | 0.041 ± 0.0011 | 0.283 ± 0.0133 | 0.075 ± 0.0042 | 0.319 ± 0.051 |
3.4. Cellulase and Hemicellulase Enzyme Production by Fusarium verticilloides Fungal Strain
The development of an economical process for large-scale production of enzyme mixtures, such as cellulase and xylanase, through submerged fermentation is hindered by the high costs of medium ingredients, chemicals, accumulation of secondary metabolites, and operational expenses [33, 34]. To address these challenges, SSF offers a cost-effective alternative. This method enables the economical production of enzyme mixtures with low capital investment and operating costs by utilizing agricultural wastes, such as wheat bran. As a result, it produces concentrated enzyme solutions with higher enzyme activity compared to submerged fermentation.
In our study, the production of extracellular enzymes by Fusarium verticilloides was performed in 250 mL flask to enhance the enzymatic hydrolysis of biomass. The fungal strain was grown on a medium containing autoclaved wheat bran as carbon supplement. Maximum cellulase activities were obtained at 5 mM buffer extracted enzyme including FPase (22.0 ± 0.935 IU/g), CMCase (8.86 ± 0.810 IU/g), β-glucosidase (2.51 ± 0.747 IU/g), and xylanase (hemicellulose) activity (17.2 ± 0.386 IU/g) on the 6th day of fermentation as shown in Table 2. Furthermore, these produced enzyme supernatants were used for the generation of glucose and xylose in the hydrolysis process with all samples of raw biomass and deashed biomass in the presence of CeFe3O4 NPs.
3.5. SPS Process Using Various Biomass
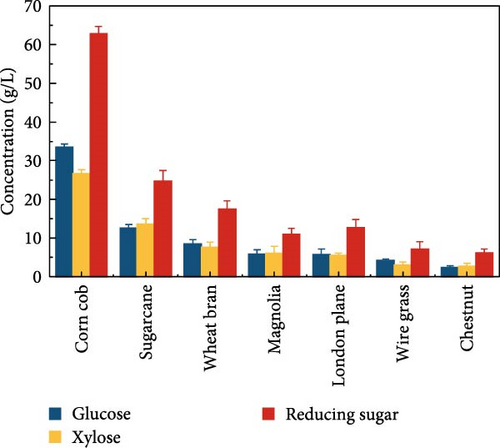
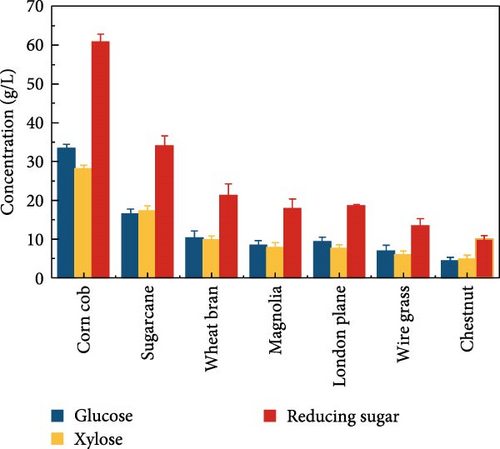
Exploiting high-quality lignocellulose biomass is crucial for efficient, eco-friendly, and economical bioethanol production. To meet these requirements and achieve high bioethanol yields cost-effectively, our comparative study examined seven types of biomasses to determine the best option for economical bioethanol production. Both raw and deashed biomass from all seven biomasses served as substrate for enzymatic hydrolysis. SPS process was conducted to assess the impact of deashing different biomass types under the same conditions as described in Section 2.4. Table 1 summarizes the composition of raw and pretreated biomass in terms of lignin, ash, cellulose, and hemicellulose highlighting the impact of NPs and deashing pretreatment. Similar changes in biomass composition have also been reported in enzyme-treated lignocellulosics, such as corn stalk, poplar, and pine [35]. However, the use of CeFe3O4 NPs and deashing pretreatment offers unique advantages, such as eliminating the need for a separate delignification step, simplifying the process and reducing the overall cost. After SPS, the deashed corn cob produced a glucose concentration of 33.3 ± 1.06 g/L and a cellulose conversion of 52.3 ± 0.43%, and a xylose concentration of 28.1 ± 0.99 g/L and a hemicellulose conversion of 38.2 ± 0.51%.
The results indicated that deashing corn cob did not significantly affect the hydrolysis outcome. This result also corroborated the change in biocomposition of corn cob after deashing. The treated corn cob had a higher hemicellulose content, which resulted in a higher released concentration of xylose in the hydrolysate liquid compared to the raw corn cob. Under the same SPS process conditions, deashed sugarcane demonstrated superior hydrolysis results compared to wheat bran and other treated feedstocks, such as magnolia, London plane, wire grass, and chestnut. The increase in sugar concentration is likely due to the reduced ash content in the deashed biomass.
The highest glucose concentrations achieved during hydrolysis were 16.4 ± 1.38 g/L for wheat bran, 10.3 ± 1.82 g/L for magnolia, 8.42 ± 1.18 g/L for London plane, 9.26 ± 1.23 g/L for wire grass, and 4.37 ± 0.94 g/L for chestnut. Correspondingly, the xylose concentrations in the same hydrolysates were 17.4 ± 1.28, 9.80 ± 1.01, 7.75 ± 1.35, 7.64 ± 0.87, 5.92 ± 1.01, and 4.76 ± 1.14 g/L, respectively, which were higher than those obtained from raw biomass hydrolysis, as shown Figure 2a,b, and Table S2. The observed variations in glucose and xylose concentrations, along with the conversion of cellulose and hemicellulose, underscore the impact of biomass composition on hydrolysis efficiency. Deashed biomass generally demonstrated slightly higher conversion, indicating that the removal of ash enhances enzyme accessibility to cellulose and hemicellulose. This is consistent with other studies showing that reducing nonfermentable components improves overall hydrolysis efficiency [3].

3.6. Bioethanol Production
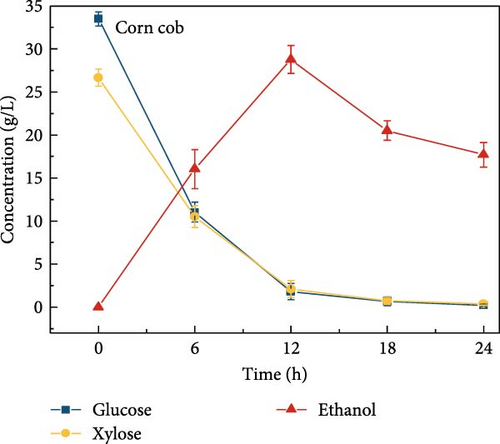
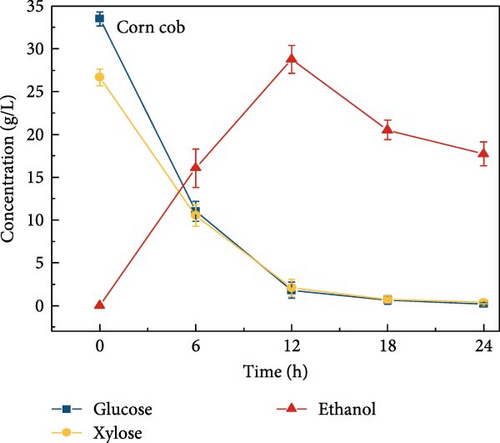
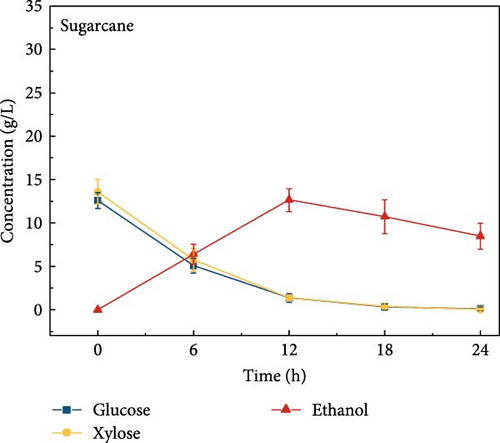
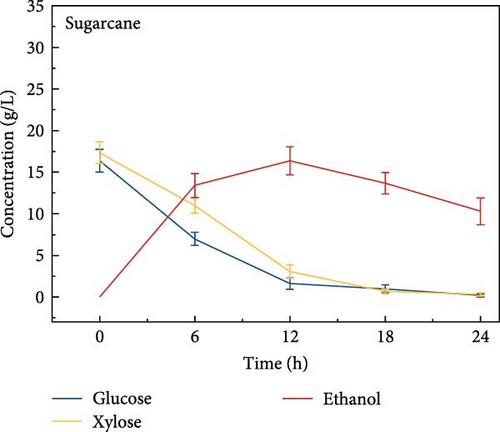
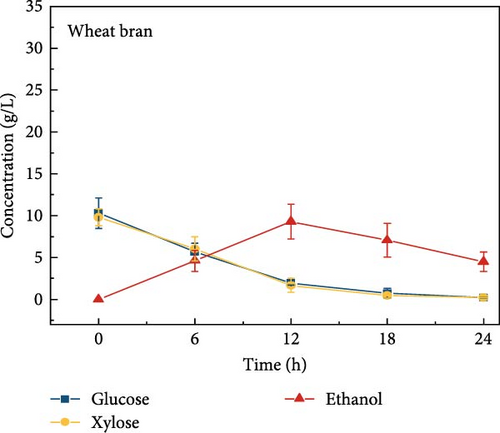
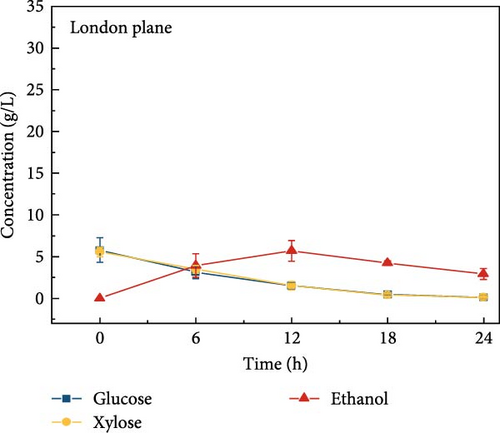
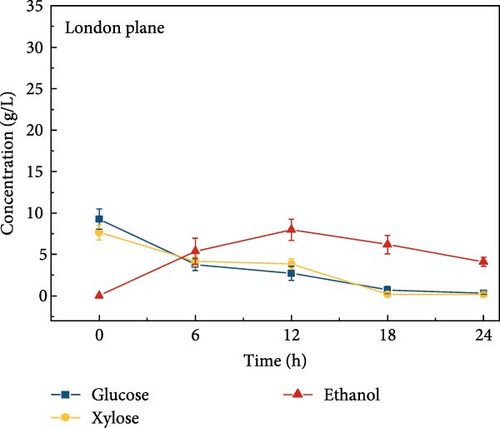
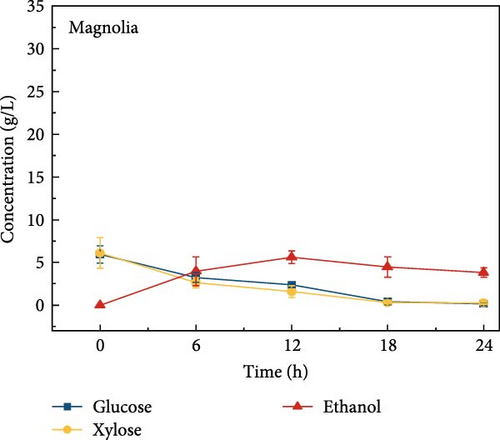
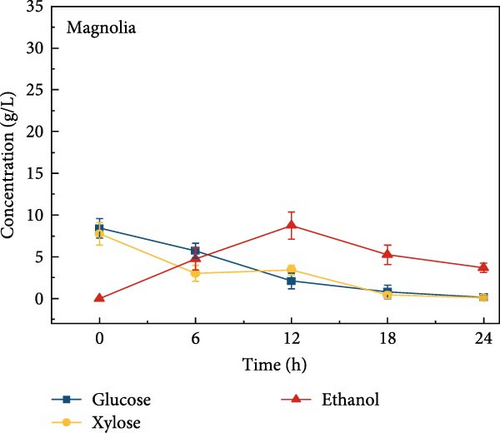
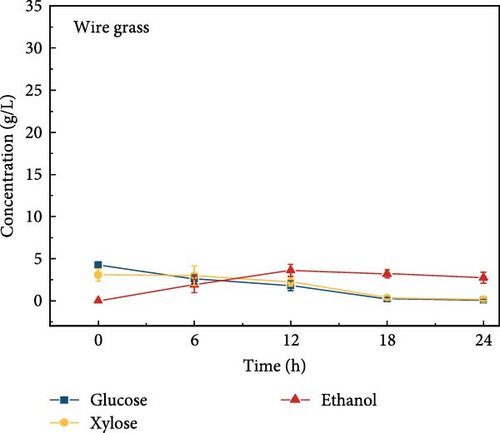
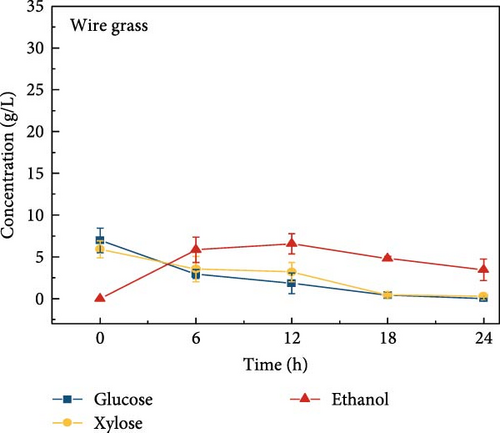
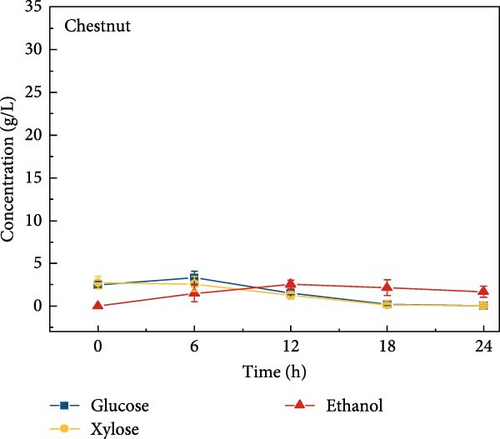
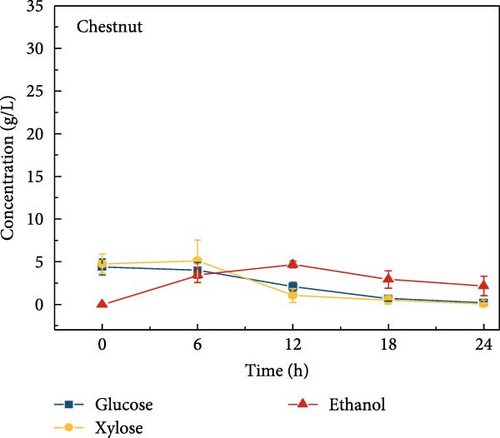
The final hydrolysate obtained from the aforementioned biomass was used to inoculate wild S. cerevisiae for the fermentation process to produce ethanol. This comparative study aimed to demonstrate the effect of deashing on the production of bioethanol at optimum parameters. The results showed that the ethanol production and productivity from the hydrolysate liquid of deashed corn cob were higher compared to all the other tested biomass in this experiment. Both the deashed corn cob and the raw corn cob had higher ethanol concentrations of 28.9 ± 0.15 and 28.8 ± 0.13 g/L, respectively. The corresponding productivities were 2.40 ± 0.15 and 2.39 ± 0.13 g/L/h, respectively within 12 h period (Figure S8). The productivities started to decrease in all feedstocks after 12 h. Therefore, 12 h can be considered as the optimum time for the highest concentration of ethanol in all biomass types. As per obtained results, there was almost no difference in ethanol concentration after deashing corn cob biomass compared to raw corn cob. In the case of deashed sugarcane, the ethanol concentration rose to 16.4 ± 1.68 g/L and the productivity was 1.36 ± 0.14 g/L/h, which was higher than ethanol concentration of 12.7 ± 1.32 g/L and productivity of 1.5 ± 0.11 g/L/h in the raw sugarcane. By utilizing the treated wheat bran, a high ethanol concentration of 9.29 ± 2.05 g/L was achieved, with a maximum productivity of 0.77 ± 0.17 g/L/h. Similarly, high concentrations of ethanol were obtained after deashing magnolia (8.07 ± 1.60 g/L), London plane (7.98 ± 1.27 g/L), wire grass (6.56 ± 1.21 g/L), and chestnut (4.67 ± 0.39 g/L). The corresponding productivities were 0.67 ± 0.13, 0.66 ± 0.10, 0.54 ± 0.10, and 0.39 ± 0.03 g/L/h, respectively (Figure 2c–p). Overall, the chest biomass had a very low concentration of ethanol due to a lower concentration of sugar and a higher percentage of ash, while corn cob had the highest ethanol concentration of 28.9 g/L. Additionally, magnolia is being reported for the first time in the present study as a potential feedstock for bioethanol production. A thorough comparison was carried out to contextualize and analyze the outcomes obtained from the fermentation process utilizing the different biomass as a feedstock in the current study.
Wild S. cerevisiae consistently stands out as the preferred yeast strain to produce ethanol from LCB due to its previous achievements of remarkable fermentation efficacy and tolerance to ethanol. The ability of this microbial strain to produce ethanol from carbohydrates, especially glucose, has been extensively leveraged to generate ethanol, but the limitation of S. cerevisiae is that it cannot naturally metabolize xylose. Genetic engineering is one of the promotable tools used to address the challenge of xylose utilization [36]. Despite numerous efforts to improve xylose consumption in S. cerevisiae, the level of xylose utilization has not yet reached the same efficiency as that of glucose. However, in our previous study, we revealed that in the presence of CeFe3O4 NPs, S. cerevisiae was able to consume xylose along with glucose during the fermentation process [4]. In this study, we also confirmed xylose consumption for ethanol production in all tested biomasses, suggesting that enabling xylose consumption by wild-type S. cerevisiae through CeFe3O4 NPs treatment is a general phenomenon. This was attributed to changes in the genomic and proteomic profiles of the cells, as well as their adaptation to the new conditions involving the presence of the NPs. Furthermore, in our previous study [4], GC–MS analysis of the liquid phase after SPS treatment revealed the formation of low-molecular-weight compounds, such as organic acids, alcohols, and phenolic derivatives. Notably, major fermentation inhibitors like furfural and HMF were not detected, which was further corroborated by HPLC analysis. The CeFe3O4 NPs facilitated selective and efficient delignification while minimizing inhibitory byproducts. Consistent with this, the current study achieved efficient ethanol production without any signs of fermentation inhibition, confirming the suitability of CeFe3O4 NP-based pretreatment for downstream bioethanol processes. Although fermentation kinetics, such as specific growth rate and lag phase duration were not quantified in this study, the consistently high ethanol yield and absence of inhibitory effects across all tested biomasses indicate favorable fermentation behavior. This further supports the applicability of CeFe3O4 NP-assisted pretreatment for efficient and robust bioethanol production.
3.7. Curtailing Citrate Buffer Inhibition Effect During SPS Process
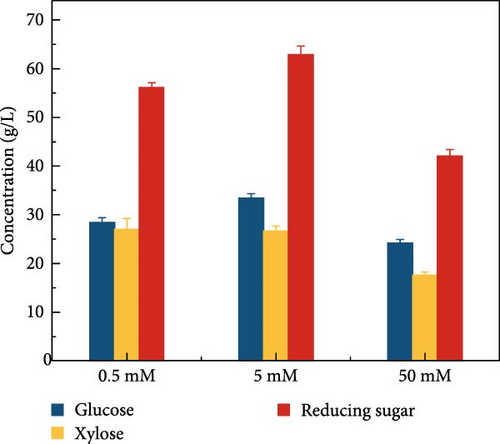
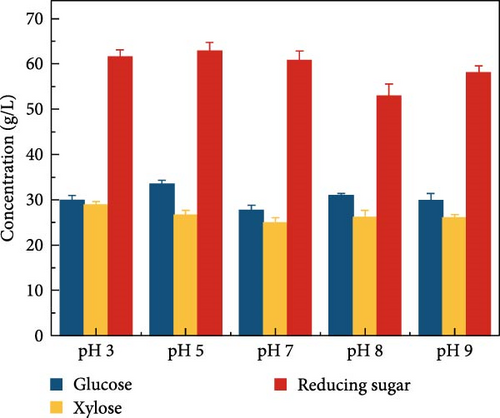
LCB consists of two main components, hemicellulose and cellulose, both of which are involved in hydrolysis. Hemicellulose liberates xylose, acetic acid, mannose, galactose, and glucose, and cellulose is hydrolyzed into glucose [37]. Acidic hydrolysis is hindered by nonselectivity, low enzyme activity, and the formation of byproducts autogenously induced by hemicellulose-derived organic acids [38, 39, 37], leading to potential sugar loss during enzymatic hydrolysis. These issues can result in reduced sugar productivity. To overcome these hydrolysis challenges, this study explored the effects of buffer concentration and pH on the enzymatic hydrolysis of the screened biomass (raw corn cob), aiming to maximize sugar concentration. The SPS experiments tested various buffer concentrations (0.5, 5, and 50 mM) and pH levels (3, 5, 7, 8, and 9). CeFe3O4 NPs were used as a laccase-mimicking enzyme to reduce phenolic compounds, thereby eliminating the need for biomass pretreatment. The highest sugar production was achieved with a buffer concentration of 5 mM at pH 5, glucose at 33.5 ± 0.82 g/L and xylose at 26.7 ± 0.98 g/L. At a 0.5 mM buffer concentration, sugar was liberated slightly lower, with glucose at 28.4 ± 1.00 g/L and xylose at 27.0 ± 2.19 g/L. The lowest sugar production was observed at the highest buffer concentration of 50 mM, with glucose at 24.2 ± 0.66 g/L and xylose at 17.6 ± 0.64 g/L (Figure 3a) at 55°C after 24 h. These results suggest that a low concentration of weak acid buffer system (5 mM and pH 5) is promising for the future direction of the SPS process. However, this strategy was not effective when the enzyme was extracted using a higher buffer concentration, such as 50 mM. Furthermore, pH effect on sugar concentration also investigated in this experiment at different pH level (3, 5, 7, 8, and 9) by following the same parameters. At pH 5, the raw corn cob released the highest concentrations of glucose and xylose, measuring 33.5 ± 0.82 and 26.7 ± 0.98 g/L, respectively. In contrast, at pH levels of 3, 7, 8, and 9, the glucose concentrations were 29.9 ± 1.05, 27.6 ± 1.14, 30.9 ± 0.54, and 29.8 ± 1.57 g/L, respectively. Corresponding xylose concentrations at these pH levels were 28.9 ± 0.76, 24.9 ± 1.11, 26.2 ± 1.47, and 26.0 ± 0.71 g/L (Figure 3b). The results indicated minimal changes in sugar concentration across the different pH levels, with the highest sugar concentration occurring at weak acidic conditions (pH 5). These results support the earlier findings by Hu et al. [39], which suggested that buffers at higher pH levels can induce surface charges, thereby altering the surface hydrophobicity and electrostatic interactions of biomass [39]. Such modifications may enhance the binding affinity of lignocelluloses for cellulase enzymes. Ultimately, the optimal condition for achieving a higher sugar concentration was identified as a buffer concentration of 5 mM at pH 5 in this experiment.

3.8. Effect of Citrate Buffer Concentration and pH on Ethanol Concentration
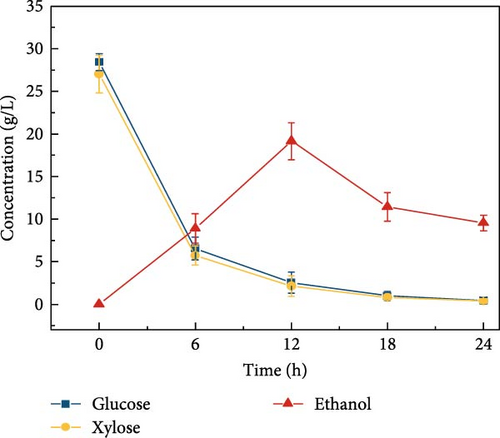
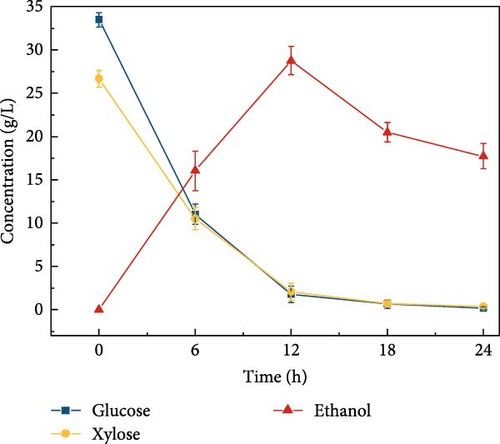
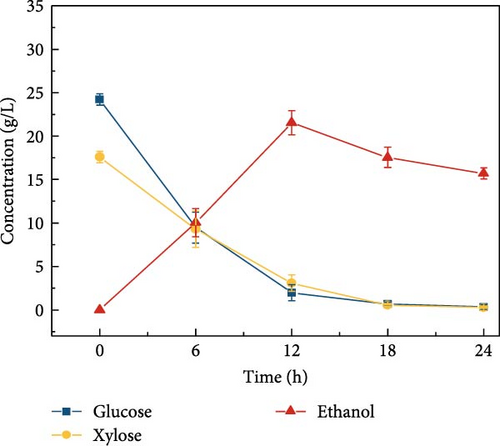
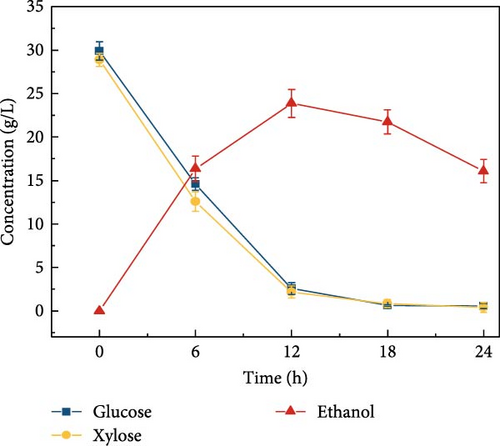
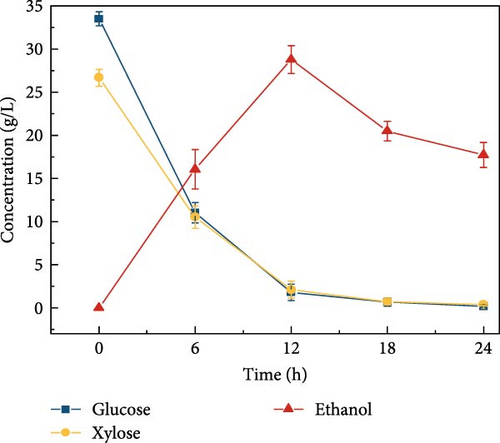
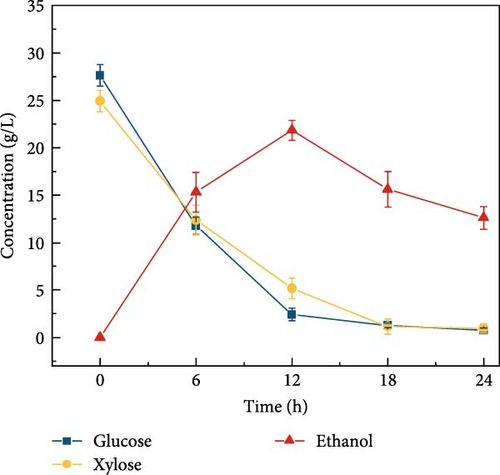
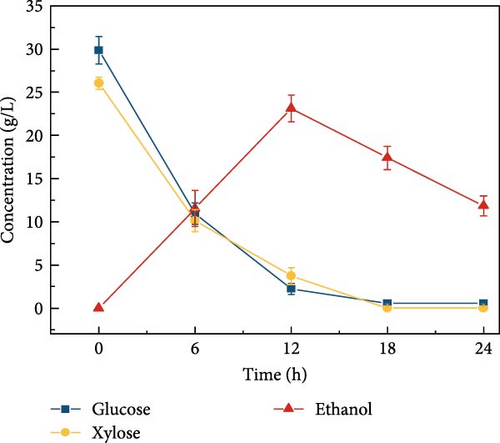
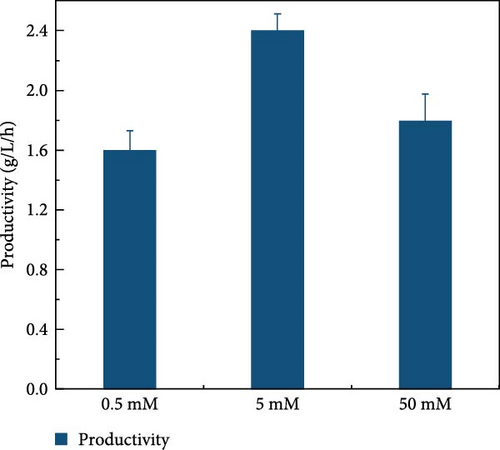
Cellulosic hydrolysates obtained from 0.5, 5, and 50 mM citrate buffer media were fermented to evaluate the citric acid curtailing effect on glucose-fermenting yeast, S. cerevisiae. The highest ethanol production of 28.8 ± 1.63 g/L (Figure 3d) and productivity of 2.40 ± 0.110 g/L/h were observed during the fermentation of the enzymatic hydrolysate derived from the 5 mM citrate buffer. In contrast, utilizing the enzymatic hydrolysate derived from the 50 mM citrate buffer resulted in an ethanol concentration of 21.5 ± 1.39 g/L (Figure 3e) and the productivity of 1.79 ± 0.181 (Figure 3k). For the 0.5 mM citrate buffer-derived hydrolysate, the ethanol concentration was 19.1 ± 2.17 g/L (Figure 3c) and the productivity was 1.60 ± 0.136 g/L/h within 12 h.
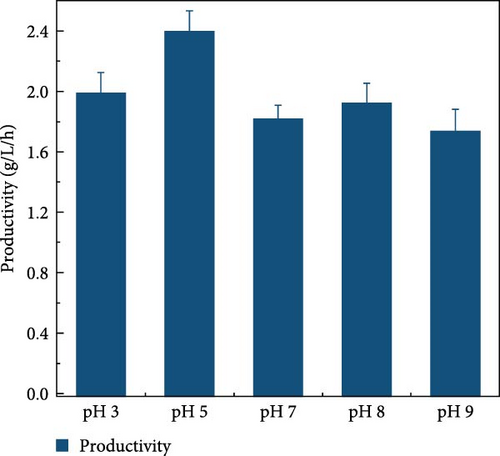
Compared to the fermentations with 0.5 and 50 mM hydrolysate, the fermentation containing 5 mM buffer exhibited 1.5-fold and 1.3-fold higher ethanol production, respectively. The results can be due to the high concentration of citrate buffer in the fermentation medium inhibiting the metabolic growth of the yeast strain. This inhibition occurs due to the chelation of trace elements, ultimately reducing the sugar consumption rate and ethanol productivity [31, 40]. Additionally, the pH effect on fermentation revealed that ethanol concentration was highest at pH 5 compared to other pH levels (3, 7, 8, and 9), as shown in Figure 3f–j. This is likely due to the higher sugar concentration in the hydrolysate at pH 5. Specifically, at pH 5, the ethanol concentration was 28.8 ± 1.63 g/L with a productivity of 2.39 ± 0.13 g/L/h (Figure 3l). In contrast, the ethanol concentrations and productivities at other pH levels were: 23.9 ± 1.61 g/L and 1.99 ± 0.13 g/L/h at pH 3; 21.9 ± 1.05 g/L and 1.82 ± 0.08 g/L/h at pH 7; 23.1 ± 1.53 g/L and 1.92 ± 0.12 g/L/h at pH 8; and 20.9 ± 1.65 g/L and 1.74 ± 0.13 g/L/h at pH 9.
This study suggests that performing enzymatic hydrolysis of biomass using a medium with lower citrate buffer strength, combined with the in-house enzyme (extracted from a low concentration of buffer), significantly improves cellulose conversion efficiency and enhances ethanol conversion efficiency during subsequent fermentation. Additionally, the strain was able to simultaneously utilize both glucose and xylose completely without requiring any additional pretreatment step due to the CeFe3O4 NPs. This is commercially significant for the bioconversion process. The process, which includes the use of CeFe3O4 NPs at a low concentration of citrate buffer, has proven to be highly efficient for converting raw corn cob into bioethanol. This approach could be a viable, eco-friendly, and low-cost solution for industrial-scale implementation.
3.9. Recovery and Reuse of Residual CeFe3O4 NPs From Hydrolyzed Broth
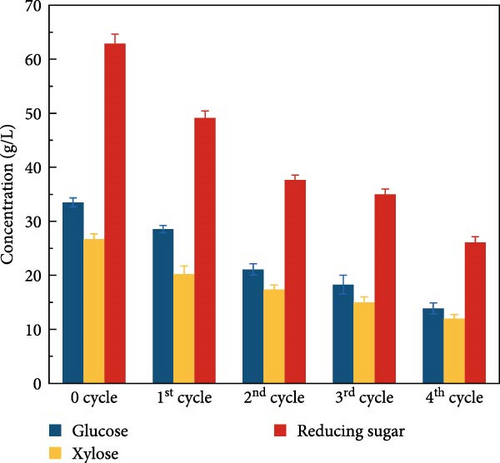
One other advantage of CeFe3O4 NPs is that it is reusable after implementation in the SPS process due to their magnetic properties, which makes them easy to separate from the hydrolysate solution. However, the recovery of the NPs was only around 65% of the initial concentration, as some NPs remained in the hydrolysate and others adhered to the solid residue of the biomass. To determine the reusability efficiency of the CeFe3O4 NPs, four sequential SPS experiments were carried out with recovered NPs and the samples were analyzed by HPLC to compare with the fresh NPs. The comparative results are shown in Figure 4a. It was observed that the concentration of sugars gradually decreased during the recycling process. The glucose liberated during the 1st, 2nd, 3rd, and 4thcycles was 28.5, 21.1, 18.3, and 13.9 g/L, respectively, while the xylose concentration was 20.2, 17.3, 15.0, and 12.0 g/L, respectively. This gradual decrease in sugar concentration could be attributed to the deposition of depolymerized products (as illustrated in Figure S5) on the surface of the NPs, which could reduce their activity. In short, CeFe3O4 NPs stick out with their fabulous laccase-mimicking properties to delignify the biomass along with magnetic properties, which allow for easy removal and recycling for further use.

Additionally, to confirm the deposition of depolymerized products on the surface of NPs, FTIR analysis was conducted. As illustrated in Figure 4b, the band observed at 430 cm−1, representing the Ce─O group, was present in both NP samples and remained unchanged at 430 cm−1. However, in fresh NPs, the band at 552 cm−1 slightly shifted to 549 cm−1 in recovered NPs due to the partial reduction of this functional group. The peaks at 1061 cm−1 in fresh NPs, corresponding to C─O groups on the edge of the CeFe3O4 NPs surface, shifted to 1148 cm−1 in recovered NPs. Additionally, the shoulder at 1720 cm−1 shifted to 1628 cm−1 with much lower intensity. Furthermore, new bands appeared at 1034 and 1298 cm−1 in recovered NPs, indicating the presence of aromatic in-plane C─H bending deformation for G-type lignin and aromatic ring breathing for S and G condensed units, respectively [41]. The structures of the relevant lignin subunits are provided in Figure S7 for reference. These observations provide evidence of the deposition of degraded lignin on the surface of the NPs.
3.10. FTIR Analysis to Evaluate the Compositional Change in Solid Residue During SPS
To obtain a proximate analysis of degrading functional groups during hydrolysis, we conducted FTIR analysis on the solid residue of biomass collected at different intervals (0, 6, 12, 18, and 24 h) during the SPS process. The FTIR spectra (Figure S9) illustrated the breaking of bonds and changes in the stretching vibrations associated with the structural integrity of LCB constituents (cellulose, hemicellulose, and lignin). The spectra of biomass samples before SPS and at specific intervals during SPS (6, 12, 18, and 24 h) depicted structural changes through alterations in peak shape and intensity. Table 3 provides a detailed summary of the FTIR spectroscopy results. Understanding the decomposition pathways of biomass components is crucial before investigating hydrolysis performance. The observed band names are based on earlier studies [41–43]. Numerous bands related to lignin overlapped with those of cellulose and hemicellulose, except for the 1508 cm−1 band attributed to aromatic skeletal vibrations, which did not overlap with holocellulose-related bands. Additionally, deformation modes demonstrating various bending vibrations (scissoring, rocking, wagging, and twisting) were observed [43].
| Peak origin (cm−1) | Dislocation (cm−1) | Bond assignment |
|---|---|---|
| 3440 | 3440 | O─H symmetric and asymmetric stretching vibration (alcohols and phenols) |
| 2908 | 2890 | C─H stretching vibrations in lignin and/or hemicelluloses |
| 1740 | 1718 | Acetyl ester groups of xylan or the ester linkage of the carboxylic group of lignin |
| 1671 | 1681 | C═O group and other anhydrosugars |
| 1645 | 1620 | C═C aromatic skeletal stretching vibrations band with OH bending |
| 1605 | 1588 | Lignin (aromatic skeletal vibration) and hemicellulose (COO─ stretching) |
| 1550 | 1530 | Aomatic skeletal vibrations in cellulose |
| 1490 | 1480 | Aromatic skeletal vibrations in cellulose |
| 1440 | — | C─O─H deformation in plane bending of cellulose and hemicellulose |
| 1350 | — | C─O─H deformation in plane bending of cellulose and hemicellulose |
| 1320 | 1315 | C aryl─O wagging vibration in syringyl derivatives |
| 1250 | — | C ═ O absorption from cleavage of acetyl groups or G-ring stretching |
| 1120 | — | C─O bond vibrations C2 |
| 1110 | — | C─O bond vibrations C3 |
| 1060 | — | C─O bond vibrations C6 |
| 1035 | — | C1─H deformation with C─O, C─C stretching, and C─OH bending in β- (1-4)-glycosidic linkages |
| 990 | — | Cellulose (C6─O6H stretching minor) and lignin (C─O stretchting or ─CH═CH─ out of plane bending) |
| 880 | — | Cellulose, hemicellulose (anometric vibration at β-glycosidic linkage) |
| 845 | — | Lignin (C─H out of plane bending) |
| 820 | 817 | Lignin (C─H out of plane bending) |
The samples exhibited a band around 3400–3000 cm−1, corresponding to O─H symmetric and asymmetric stretching vibrations, indicating the presence of alcohols, phenols, and both physiosorbed and chemisorbed water molecules in cellulose [42]. The 3000–1800 cm−1 range indicated aliphatic hydrocarbon structures with asymmetrical C─H stretching vibrations in hemicelluloses or lignin. However, the 1800–800 cm−1 range displayed more peaks compared to other ranges. All samples showed medium and weak bands around 1800–800 cm−1, indicative of asymmetric and symmetric C─H stretching vibrations and the olefinic C═C and C═O vibrations in the aromatic structures of cellulose, xylose, and/or lignin [2, 42].
The hydroxyl group (─OH) stretching vibrations around 3440 cm−1 are associated with the polysaccharides present in all solid residue samples, as they all contain cellulose. This peak became broader, indicating more vibrational modes of inter- and intramolecular hydrogen bonding and lower amounts of OH groups. Another indication of polysaccharides is the asymmetrical C─H stretching vibrations in hemicelluloses or lignin around 2908 cm−1, which shifted to 2890 cm−1 after 18 h and then disappeared in the sample after 24 h. The peak at 1718–1740 cm−1 was related to the C═O stretching vibration of either the alduronic acids/sugar acid (with both carbonyl and carboxylic acid functional groups) or the acetyl ester groups of xylan, or the ester linkage of the carboxylic group in the ferulic and p-coumaric acids of lignin, pectin, and hemicellulose, which remained very low after the completion of hydrolysis. Similarly, the peak at 1681–1671 cm−1 indicated the C═O group due to furans and other anhydro sugars, suggesting the significant removal of most of the lignin and hemicellulose after the SPS process.
Similarly, the peaks at 1681 and 1671 cm−1 indicate the presence of C═O groups due to furans and other anhydro sugars, suggesting the significant removal of most lignin and hemicellulose after the SPS process. The disappearance of the C═C aromatic skeletal stretching vibrations band with OH bending around 1620–1645 cm−1 in lignin [2, 42] further supports the simultaneous delignification of the biomass, resulting in the transformation of C═O to C─OH groups.
Additionally, the peaks around 1520–1550 and 1480–1490 cm−1, indicating aromatic skeletal vibrations in cellulose, remained the most prominent, suggesting a higher fraction of this functional group in the biomass that was not completely converted during hydrolysis. The vibrations around 1440 and 1350 cm−1, attributed to C─O─H deformation in cellulose and hemicellulose, disappeared over time. The peak at 1320 cm−1, showing C aryl─O wagging vibration in syringyl derivatives (S and G condensed units), also vanished due to delignification [44, 45].
The peak at 1250 cm−1, possibly due to C═O absorption from acetyl group cleavage or guaiacyl ring breathing with C═O stretching [44], disappeared after 24 h, confirming the significant lignin from removal.
The vibrational peaks at 1210 and 1155 cm−1 favor the presence of cellulose and hemicellulose (C1─O─C4′ symmetric, and antisymmetric O─H in-plane bending) in the analyzed samples [43]. The vibrational peaks at 1210 and 1155 cm−1 indicated the presence of cellulose and hemicellulose (C1─O─C4′ symmetric and antisymmetric O─H in-plane bending) in the samples. The vanishing of the glucose ring vibration over time, with peaks near 1120, 1100, and 1060 cm−1, demonstrated the C─O bond vibrations at the 2nd, 3rd, and 6th carbons of the glucose residues of cellulose due to the disruption of cellulose [45, 46]. The peak at 1035 cm−1 was attributed to C1─H deformation with lignin C─O stretching, C─C stretching, and C─OH bending in the β-(1-4)-glycosidic linkages between glucose and cellulose (C6─O6H stretching dominant). The peak at 990 cm−1 was attributed to cellulose (C6─O6H stretching minor) and lignin (C─O stretching or ─CH═CH─ out-of-plane bending), which eventually diminished.
Additional peaks in the solid residue at 900 and 845 cm−1, representing cellulose, hemicellulose (anomeric vibration at β-glycosidic linkage), and hemicellulose (C2─H bending of mannosyl residue), became broader over time. Two additional peaks at 845 and 820 cm−1 were attributed to lignin of aromatic C─H out-of-plane bending in positions 2 and 6 of syringyl (S units) and all positions of p-hydroxyphenyl (H units) [41, 43, 44]. Overall, the intensity of these peaks (0 h > 6 h > 12 h > 18 h > 24 h) evidenced a significant change in cellulose and hemicellulose and the degradation of lignin content over time during the SPS process.
4. Conclusion
This study focused on optimizing CeFe3O4 NPs-assisted bioethanol production by screening biomass resources, employing deashing techniques, and optimizing buffer concentration and pH levels. Out of the seven biomass types examined, corn cob proved to be the most effective for bioethanol production without requiring pretreatment.
Deashing with sodium citrate effectively reduced ash content and associated inhibitory mineral concentrations, while significantly altering biomass composition by increasing cellulose and hemicellulose content and reducing lignin levels. This impact was further confirmed in hydrolysis experiments, where deashed sugarcane bagasse demonstrated improved sugar release, with glucose increasing from 12.6 to 16.4 g/L and xylose from 13.6 to 17.4 g/L. These enhancements directly contributed to improved fermentation performance, with ethanol yields increasing from 12.7 to 16.3 g/L and a productivity from 1.05 to 1.36 g/L/h. Although, corn cob did not benefit significantly from deashing due to its low initial ash content, it exhibited the highest ethanol productivity overall.
CeFe3O4 NPs aided in delignification and functioned similarly to the laccase enzyme. Under optimized hydrolysis conditions (5 mM buffer, pH 5), corn cob biomass yielded high sugar concentrations (glucose: 33.5 g/L and xylose: 26.7 g/L). Subsequent fermentation produced 28.8 g/L of ethanol with a productivity of 2.39 g/L/h over 12 h. Although, wild-type S. cerevisiae typically cannot ferment xylose, the presence of CeFe3O4 NPs enabled simultaneous glucose and xylose utilization, suggesting potential metabolic enhancement, possibly through catalytic effects or cellular adaptation.
In summary, the combined application of sodium citrate deashing and CeFe3O4 NPs synergistically improved fermentable sugar release and bioethanol productivity. This integrated strategy represents a promising and scalable approach for the valorization of high-ash LCB, advancing the development of efficient, sustainable bioethanol production systems.
Conflicts of Interest
The authors declare no conflicts of interest.
Author Contributions
Anju Singh: writing – original draft, investigation, data curation, formal analysis, methodology, conceptualization. Beom Soo Kim: supervision, writing – review and editing, conceptualization.
Funding
This study was funded by the National Research Foundation of Korea (Grant RS-2025-00514181).
Acknowledgments
This research was supported by the National Research Foundation of Korea (Grant RS-2025-00514181).
Supporting Information
Additional supporting information can be found online in the Supporting Information section.
Open Research
Data Availability Statement
The data that support the findings of this study are available from the corresponding author upon reasonable request.


