Single-Step Synthesis of Porous Activated Carbon by CO2 Activation: Process Optimization With Response Surface Methodology and Machine Learning Techniques
Abstract
This study presents an innovative, single-step synthesis approach for producing porous activated carbon (AC) from palm kernel shells (PKS). A high-quality AC was produced by integrating CO2 and ZnCl2 into the carbonization process as activating agents. The pyrolysis parameters, including activation temperature, residence time, activating agent ratio, and heating rate, were optimized using response surface methodology (RSM) to assess the yields and specific surface area (SSA) of the resultant AC. The experimental design was based on a central composite design (CCD), and the process variables were analyzed to understand their interactions and combined effect on the properties of the AC. Further, the extreme gradient boosting (XGB) and random forest (RF) machine learning regressor models predicted the pyrolysis performance and aligned well with the experimental data. The results revealed that optimal conditions were achieved at an activation temperature of 800°C, a heating rate of 10°C/min, and a residence time of 2.75 h with the activating agent to biomass ratio of 1.25, yielding 33% AC with a surface area of 1420 m2/g and significant pore development. This study provides a scalable and environmentally friendly approach to valorizing agricultural waste into value-added products by supporting the goals of the circular economy and net-zero initiatives.
1. Introduction
The global biomass production is escalating rapidly, driven by the agricultural, forestry, and waste sectors, and contributing significantly to the world’s renewable energy sources [1]. However, their abundance is associated with disposal and management challenges. According to the World Bank Report, global waste generation will rise to 3.40 billion tons by 2050, outpacing the population increase over the same period by more than twofold [2]. The improper handling of biomass waste leads to environmental pollution and represents a missed opportunity for energy recovery and material reuse [3]. Among the various types of biomass, palm kernel shells (PKS) stand out, especially in Malaysia, because they are one of the world’s largest palm oil producers [4]. Over 100 million tons of palm waste are generated yearly, with an expected annual growth rate of 5% [5]. Specifically, generating millions of tons of PKS annually, a by-product of the palm oil industry, presents both a disposal challenge and a potential resource for carbon-based products [6]. PKS, owing to its high carbon content and availability, is an excellent source for producing activated carbon, a material known for its high surface area, porosity, and adsorption capacity [7]. The transformation of biomass (PKS) into AC typically involves pyrolysis, a thermal decomposition process carried out in the absence of oxygen that converts biomass into biochar [8]. The parameters of pyrolysis play a crucial role in determining the yield and specific surface area (SSA) of AC. Luo et al. [9] found that modifying the KOH-to-char weight ratio during the activation process significantly influenced the SSA and pore volume of AC.
Similarly, Lua’s research on activating oil palm shells indicated that factors such as pyrolysis temperature, duration, and initial particle size remarkably affected the pore structure and SSA of the resulting AC [10]. Additionally, Menya et al. [11] optimized conditions for producing rice husk char, revealing that temperature, heating rate, and duration impacted the yield and SSA, making it an effective precursor for activated carbon production. Kaur et al. [12] also discovered that varying pyrolysis times and temperatures significantly affected the SSA of bamboo-derived AC, with higher temperatures enhancing surface area and mesoporosity. Together, these studies underscore the vital impact of pyrolysis settings on the yield and SSA of AC. Subsequently, the as-produced biochar undergoes physicochemical upgradation, such as activation with carbon dioxide or steam, to enhance its surface area and porosity, thus converting it into high-quality activated carbon [13, 14 ]. This process provides a sustainable route for waste management and produces valuable materials for various applications, including energy storage and conversion, hydrogen evolution reaction (HER), wastewater treatment, and CO2 capture [13, 15–18]. Recently, AC synthesis with enhanced electrochemical properties has been reported using self-activating agents and self-doping mechanisms using either potassium histidine, magnesium histidine, magnesium folate, potassium folate, H2O2, or zinc gluconate [19–23]. Unlike conventional methods that rely solely on chemical activators such as KOH or H3PO4, which are corrosive and environmentally taxing. Among activators, the dual activation using CO2 and ZnCl2 offers a sustainable alternative and distinct advantages. CO2 is a sustainable, nontoxic, economical physical activator that promotes well-defined pore structures and high surface areas, but requires high temperatures and long reaction times, increasing energy consumption. In contrast, ZnCl2 is a chemical activator that enables efficient carbonization at lower temperatures, yielding microporous structures with precise adsorption characteristics and better pore size control than KOH or H3PO4 [24]. While CO2 provides an environmentally friendly alternative, ZnCl2 enhances efficiency, making their combination a promising approach to balancing performance, cost, and sustainability.
The use of activated carbon produced from PKS and CO2 contributes to the broader goals of waste valorization and environmental protection to achieve net-zero environmental targets by employing waste biomass and greenhouse gases (GHGs) [25, 26]. CO2 activation has been widely studied for its environmental advantages, but it often results in slower activation kinetics and requires higher energy inputs to achieve comparable results. The role of zinc chloride as a chemical activator is invaluable for its dehydration and catalytic effects, which lower the activation energy and enhance the carbon yield with desirable porosity [27]. Meanwhile, CO2, as an activator, further refines the pore structure, ensuring activated carbon production with optimal properties for specific uses [28]. The combined use of ZnCl2 and CO2 in the activation process significantly enhances the porosity and SSA of PKS-derived AC (PKSAC). Moreover, the pyrolysis process parameters were meticulously optimized using RSM, a statistical technique exploring optimal conditions for optimizing the PKSAC yield and SSA while minimizing energy consumption and material waste. Applying RSM to optimize pyrolysis parameters is essential for boosting the production efficiency of biochar and bio-oil from biomass sources such as sugarcane bagasse, algal biomass, and cashew nut shell. Research indicates that by tweaking variables like temperature, reaction time, heating rate, nitrogen flow rate, and particle size, it is possible to achieve optimal yields of biochar and bio-oil, thus enhancing the energy and carbon content of these products [29–32]. RSM facilitates the determination of optimal operational conditions for pyrolysis, leading to significant biochar yields of up to 40.4 wt% [33]. Moreover, in addition to RSM, artificial intelligence and machine learning also aid in accurately predicting and controlling the pyrolysis process, ensuring the production of biochar and bioenergy sources for various industrial applications [34–36]. Recently, Hai et al. [35] explored the use of machine learning models to predict biochar yield and SSA from 46 types of agricultural biomass based on pyrolysis conditions. Random forest (RF) models showed the best performance, with an R2 value of 85%, enabling the prediction of biochar yield and SSA without extensive experimental processes, particularly emphasizing the importance of pyrolysis temperature. However, the single-step physicochemical activation and process optimization are not discussed in detail and will help manage the agricultural waste effectively and model the pyrolysis parameters.
Therefore, this study addresses the single-step synthesis of PKSAC by systematically varying key parameters such as the pyrolysis temperature, residence type, concentration of the ZnCl2, and nature of gases such as N2, CO2, or both. The proposed work presents a green, efficient, and scalable strategy for producing high-performance PKSAC using CO2 and ZnCl2 as activation agents in a single-step pyrolysis. Moreover, the influence of pyrolysis parameters was extensively investigated to optimize PKSAC yield and SSA using the RSM and ML techniques. This single-step synthesis approach leverages the synergistic effects of physicochemical activation in combination with ML-based modeling. It presents an efficient method for producing high-quality AC from biomass waste while contributing to the circular economy and net-zero initiatives.
2. Experimental
2.1. Materials and Methods
Palm kernel shells (PKS) were obtained from a local market in Kuala Lumpur, Malaysia. Zinc chloride (ZnCl2, ≥98% purity) and hydrochloric acid (HCl, 37% purity) were procured from Sigma-Aldrich, USA. All chemicals of analytical grade were used as received without additional purification. In the experimental procedures, deionized water (DI: 18.2 MΩ cm resistivity) from Milli Q Plus (Merck Millipore Co., Germany) was used for solution preparation and cleaning.
2.2. Single-Step Synthesis of PKSAC
Single-step synthesis of PKS-derived AC employing ZnCl2 and CO2 is a noteworthy process for efficiently producing high-surface-area activated carbon. This method capitalizes on the distinct advantages of both ZnCl2 and CO2 to enhance the porosity and surface characteristics of the resultant AC. The process began with collecting PKS, which was thoroughly washed to remove any adhering dirt and organic impurities. After washing, the shells were dried in an oven at 105°C until a constant weight was obtained, ensuring the removal of moisture, which could interfere with the activation process. The dried PKS was then ground into fine particles to facilitate uniform contact with the activating agents and ensure a more consistent activation process across the biomass. Furthermore, PKS was chemically activated by mixing it with ZnCl2 in varying ratios, which was critical for enhancing the development of porosity in the carbon structure [37–39]. ZnCl2 is an excellent chemical activator because of its ability to dehydrate the cellulose structure of PKS, thereby promoting the formation of a porous network. This dehydration reaction is crucial for creating voids within the carbon matrix, increasing the surface area. The mixture was heated at 80°C for 1 h to allow thorough impregnation of ZnCl2 into the PKS matrix. This pretreatment step is pivotal, as ZnCl2 acts not only as a dehydrating agent but also as a catalyst that lowers the pyrolysis temperature required for the activation process. Subsequently, ZnCl2-impregnated PKS was dried to remove any residual moisture. The dried material was transferred to a tubular furnace and underwent pyrolysis under carefully controlled temperature, residence time, and heating rate. The pyrolysis temperature was varied from 700°C to 1000°C to study its effect on the properties of the AC produced [40]. The process was initiated in an inert atmosphere using N2 to prevent combustion and ensure controlled decomposition of the biomass. Halfway through the pyrolysis process, the atmosphere within the furnace was changed to CO2. Notably, CO2 activation of the carbonized PKS enhanced the development of micropores by reacting with carbon to form carbon monoxide, thereby increasing the overall surface area and pore volume of the activated carbon. This physicochemical activation step is essential for tailoring the porosity of the AC for specific applications. The use of CO2, compared to other physical activating agents such as steam, offers the advantage of producing a more controlled pore structure and higher yields of AC [41] and is also a step toward a net zero approach by mitigating or utilizing GHGs.
2.3. Physicochemical Characterization
The surface morphology and SSA of the as-produced PKSAC were measured using a scanning electron microscopy (SEM) and a Brunauer–Emmett–Teller (BET) surface area analyzer, respectively. These methods provide a thorough insight into the structural and morphological characteristics of AC.
2.4. Response Surface Methodology
2.5. Machine Learning Regressor Models
The extreme gradient boosting (XGB) and RF regressor are powerful machine-learning models designed for regression tasks, leveraging distinct algorithms to achieve high accuracy and robustness. These algorithms are well-suited to addressing the challenges presented by the dataset, including nonlinearity, interaction effects, and the need for robust predictions across multiple input variables. These models provide complementary strengths—RF excels in reducing variance through averaging, while XGB focuses on minimizing bias through sequential improvements—making them ideal choices for the dual goals of accuracy and interpretability in optimizing activated carbon synthesis. The XGB is based on the XGBoost algorithm and is renowned for its exceptional performance, especially with large datasets and complex feature interactions. It constructs an ensemble of decision trees sequentially, with each new tree correcting the errors of its predecessors, and incorporates regularization techniques to prevent overfitting, making it a versatile and reliable choice for various regression challenges. On the other hand, the RF is built on the RF algorithm. It excels in handling high-dimensional data and complex interactions by constructing multiple decision trees on random subsets of data and features. The final prediction is made by averaging the outputs of these trees, which helps to reduce variance and enhance generalization. This ensemble approach makes the RF regressor highly resistant to overfitting and capable of delivering accurate predictions even in noisy data. Both models are widely used in academic research and industry due to their adaptability, strong predictive power, and ability to handle diverse regression problems effectively. An 80/20 approach was applied for ML models, using 80% data to train the model and the remaining 20% to validate the model. The performance and accuracy of the regression models were assessed using evaluation metrics such as R-squared (R2), mean squared error (MSE), and root mean squared error (RMSE). The R2 measures the proportion of variance explained by the model, which ranges from 0 to 1; a value closer to 1 indicates a better fit. The performance of the pyrolysis process depends on the reaction temperature, residence time, heating rate, and impregnation ratio. Hence, these four input parameters were used to predict the PKSAC yield and SSA in the developed XGB and RF regression models.
3. Results and Discussion
3.1. Palm Kernel Shells (PKS)-Derived AC and its Electrodes
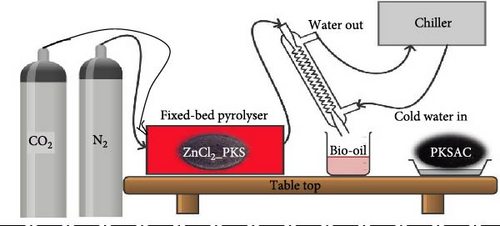
A comprehensive schematic and mechanistic illustration of the synthesis of PKSAC via single-step fixed-bed pyrolysis is presented in Figure 1. Primarily, the as-received PKS underwent initial preparation steps, including washing, drying, and grinding, to ensure uniformity and facilitate chemical reactions. Furthermore, PKS was treated with ZnCl2, by varying the chemical dosage. This step is crucial for developing the porous structure of activated carbon, enhancing its SSA during carbonization. Subsequently, the pretreated PKS was subjected to a tubular furnace for thermochemical conversion and physicochemical activation in the presence of CO2. This step is depicted as the material being exposed to CO2 gas, leading to further development of the porous structure. The use of CO2 not only contributes to the activation process but also aligns with sustainable practices by utilizing GHGs. The combined chemical and physical activation processes result in hierarchical porous carbon (HPC) formation. This carbon material is characterized by a well-developed pore structure, including micropores, mesopores, and macropores, which are essential for high-performance electrochemical applications because of their ability to facilitate ion transport and provide an ample surface area for electrolyte interaction. By utilizing a waste product (PKS) and incorporating CO2 activation, the process addresses environmental concerns while producing a valuable material for demanding applications.


3.2. Materials Characterization
Scanning electron microscopy (SEM) was used to analyze the morphological features of PKSAC by varying the pyrolysis conditions as displayed in Figure 2. The SEM analysis of PKSAC_N2 briefly reveals a porous structure with irregular pore distribution (Figure 2a). The surface appears rough, indicative of a high surface area. This roughness and irregularity help in trapping and binding various molecules, making it suitable for various demanding applications. Further, the PKSAC_N2_ZnCl2 sample shows variations in the surface texture due to the ZnCl2 treatment. This chemical treatment modifies the original pore structures, potentially smoothing some areas and enlarging or restructuring other pores, as shown in Figure 2b. These changes are often aimed at enhancing the material’s capacity to adsorb specific chemicals, leveraging the chemical interaction between ZnCl2 and biomass. Comparatively, in PKSAC_N2/CO2_ZnCl2, where the sample has undergone further activation with CO2 after ZnCl2 treatment, SEM analysis would likely display a more pronounced evolution in the pore structure (Figure 2c). The higher magnification image, as shown in the inset of Figure 2c, reveals finer details, such as increased pore uniformity and connectivity, which are vital for improving the adsorption dynamics. CO2 activation is known to develop micro and mesopores further, significantly increasing the total pore volume and the surface area. This treatment produced high-quality activated carbon, which could be effectively employed, especially in applications requiring precision and enhanced capacity, such as heavy metals remediation, desalination, or complex industrial effluents.

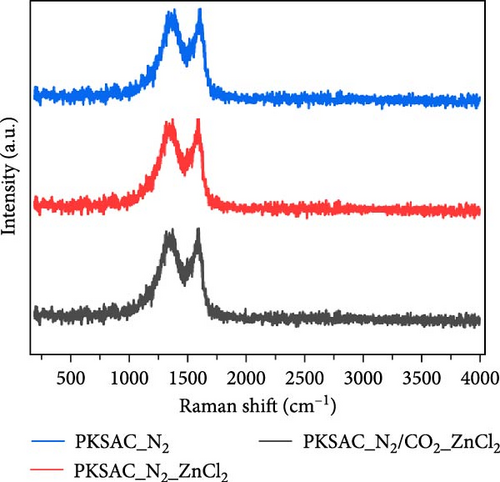
Raman spectroscopy is a powerful analytical technique widely used to investigate the microstructure of porous carbon materials, especially in the context of pyrolysis processes. During pyrolysis, organic precursors are thermally decomposed, and the resulting carbon structures can vary significantly based on several key parameters, including temperature, time, and the atmosphere used during the process. Figure 2d demonstrates the Raman spectra of PKSAC by varying activation conditions. The PKSACs exhibited distinct peaks at ~1350/cm (D band), corresponding to disorder in the carbon structure, while the G-band (~1580/cm) is associated with graphitic or ordered carbon. The intensity ratio of these bands (ID/IG) is particularly important. A higher (ID/IG) ratio indicates a greater degree of disorder, which often correlates with increased porosity and surface area. Conversely, a lower ratio for PKSAC_N2/CO2_ZnCl2 suggests that a more ordered, graphitic structure is present, which is typically favorably responsive for applications in energy storage and catalysis. This is because N2 reduces the likelihood of oxidative reactions that could degrade the carbon quality. In contrast, introducing gases like CO2 can facilitate reactions that improve the porosity of the carbon material, making it more suitable for applications such as adsorbents or battery electrodes. Similarly, using chemical additives, such as ZnCl2, during pyrolysis can enhance the creation of micropores and alter surface functionalities, which can be identified through specific shifts or changes in the Raman spectra (Figure 2d). Overall, a comprehensive understanding of pyrolysis parameters that affect porous carbon microstructure through Raman analysis aids in developing advanced materials with desired functionality, paving the way for innovations in energy storage, environmental remediation, and other fields. The as-produced PKSACs were used to synthesize AC electrodes for electrochemical water desalination, as reported by Hai et al. [42]. The results revealed that the electrode developed from PKSAC_N2/CO2_ZnCl2 achieved a specific capacitance of 365.4 F/g, an electrosorption capacity of 22.5 mg/g, and an average salt adsorption rate of 0.372 mg/g/min under optimized conditions (1.2 V, 7.5 mL/min, and 750 mg/L NaCl) compared to other PKSAC electrodes, showcasing the potential of PKSAC for efficient electrochemical water desalination.
3.3. RSM for Optimizing Pyrolysis Parameters
3.3.1. One Factor at a Time Approach
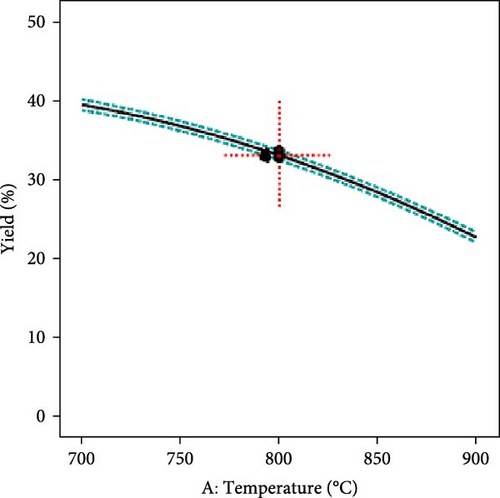
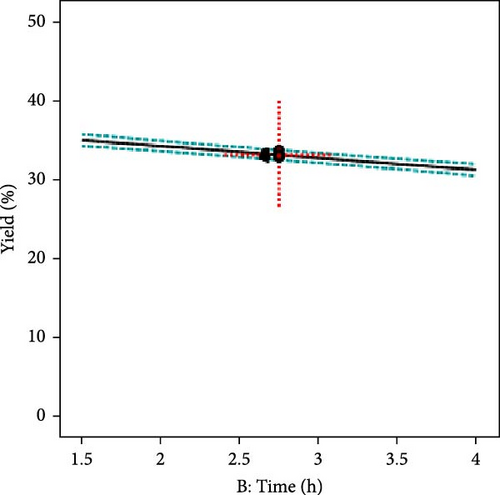
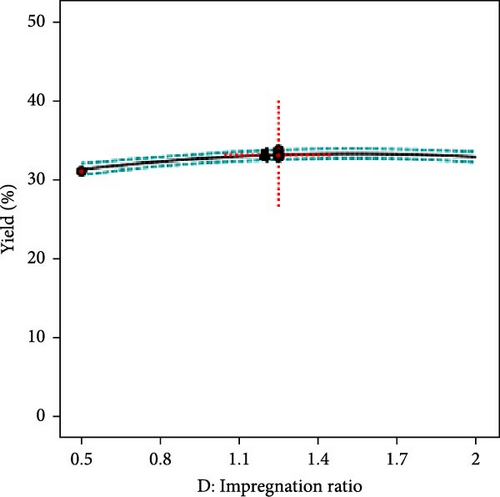
The effect of individual input parameters on the AC yield was investigated by varying the single/one-factor-at-a-time (OFAT) approach to optimize the pyrolysis parameters. The OFAT method involves changing one independent variable while keeping others constant to observe the effect on a dependent variable, such as the yield of activated carbon. Figure 3a illustrates the impact of temperature ranging from 700°C to 1000°C on the AC yield. The results revealed that the yield slightly decreased as the temperature increased. This suggests that higher temperatures may lead to more extensive decomposition of the precursor material, possibly reducing the yield of the solid carbon. However, the AC yield seems relatively constant across the different residence times (1.5–4 h), suggesting that, within this range, time may not be a significant factor influencing the yield, or it has reached a plateau where further increases in time do not significantly alter the yield (Figure 3b). Further, it was observed that 10°C/min and a molar ratio of activating agent to PKS (1.25) showed optimum yields, as shown in Figure 3c and d, respectively. The central point marked with a dotted red cross in each plot represents the central or reference condition for the respective variables. The dashed lines represent the confidence intervals for the predictions, indicating the statistical uncertainty or variability in the measurements. The overall yield stability across various parameters suggests that the activated carbon yield is robust to changes in pyrolysis conditions within the tested ranges.

Similar to the AC yield, the OFAT approach was employed to investigate the individual effects of pyrolysis parameters on the SSA of the as-produced PKSAC. The results revealed a slight upward trend in the temperature, suggesting that the SSA increased as the temperature increased. The range of uncertainty also appeared to increase slightly with temperature, as shown in Supporting Information Figure S1a. Notably, the SSA did not strongly depend on time and heating rate within the given range, as indicated by the relatively flat trend line. The uncertainty appears consistent across the time range, and the error bars are relatively consistent, suggesting that the variability in the SSA is not significantly affected by changes in these two parameters. However, a slight downward trend in the SSA was observed for the impregnation ratio, although the change was relatively small compared with the SSA value range. The uncertainty was slightly larger at higher impregnation ratios (Supporting Information Figure S1d). In summary, these plots are useful for analyzing the effects of various process parameters on the SSA of a material, which is crucial for applications that depend on the surface properties of materials, such as catalysis, adsorption, and sensor design. The error bars and trend lines help in understanding the sensitivity of SSA to changes in each parameter and in optimizing the process conditions for material preparation or modification. However, it is essential to note that the OFAT approach does not account for interactions between variables, which could be significant. Therefore, while the OFAT approach provides initial insights, a more comprehensive study, such as RSM, which considers the interactions between variables, might be necessary to fully optimize the pyrolysis process for maximum yield and SSA, as discussed in the following section.
3.3.2. Multifactor Variation by RSM
The relationship between the pyrolysis performance in terms of AC yield, SSA, and process parameters was optimized using the RSM technique. A CCD was used to develop mathematical correlations to express the relationship, optimize the operating conditions for the production of AC from PKS, and evaluate its yield and SSA. The carbonization/activation process for producing AC is defined by key parameters, such as temperature, time, heating rate, and impregnation ratio, which collectively determine the efficiency and quality of the produced AC. Specifically, these parameters control the environmental conditions, process duration, activation effectiveness, material conversion efficiency, and functional surface area of AC, which is crucial for its application in adsorption and electrochemical reactions. Supporting Information Table S1 demonstrates that the individual runs show variations in these parameters and their effects on AC yield and SSA. For instance, run 6 at a high temperature and high heating rate yielded a lower SSA than run 4, which had a higher temperature but a slower heating rate, leading to a higher SSA. This suggests that slower heating rates at high temperatures might be favorable for developing larger surface areas in the AC. The yield and SSA often had an inverse relationship, as seen in runs 19 and 11. Run 19 had a high yield but a lower SSA, whereas run 11 had the highest yield but one of the lowest SSAs. This could indicate that conditions favorable for yield might be detrimental to the development of the surface area and vice versa. The highest SSA was observed in run 4, with the highest temperature of 1000°C but a moderate heating rate and impregnation ratio. However, it also had one of the lowest yields, suggesting a trade-off between achieving high surface areas and conserving the material. Conversely, the highest yield was found in run 27, conducted at the lowest temperature of 600°C, with a moderate heating rate and impregnation ratio. However, the SSA was significantly lower, indicating that lower temperatures might preserve more material without developing a higher SSA. The variability in the results indicates a complex interplay between the four input variables. RSM helps understand these interactions, determine the optimal conditions for a desired outcome, and balance yield and SSA.
An experiment was conducted using the Design Expert software to thoroughly investigate the interaction of different input variables. For this purpose, an ANOVA was conducted to understand the factors affecting the yield of activated carbon produced from a precursor, as shown in Table 1. The ANOVA results for a reduced quadratic equation showed that the model is highly significant, with an F-value of 311.38 and a p-value less than 0.0001. This suggests a very low probability that these results could be due to random variations; in other words, the model reliably predicts the yield of activated carbon. The regression coefficient estimates for each factor (A for temperature, B for time, C for heating rate, and D for impregnation ratio) and their squared terms (A2, D2) are provided, along with the associated sum of squares (SS), degrees of freedom (df), mean square (MS), F-value, and p-value for each term. The negative coefficients for A, B, and C indicate that an increase in these factors leads to a decrease in the yield of activated carbon. In contrast, the positive coefficient for D suggests that an increase in the impregnation ratio leads to an increase in yield. The significance of each term was confirmed by p-values of less than 0.0500, indicating that these variables had a statistically significant impact on yield. The terms A2 and D2 are also significant, which implies that the relationship between the yield and these factors is not linear but quadratic. The significance of these squared terms suggests the presence of curvature on the response surface, indicating an optimal level of the factors for maximum yield. The fit statistics, including R2 (0.9878), adjusted R2 (0.9847), and predicted R2 (0.9737), were all very high, indicating that the model explained a very high proportion of the variance in the yield data. A high R2 value close to 1.0 indicates a good fit of the model to the observed data. Equation (3) depicts a mathematical correlation to delineate the singular and collective contributions of four individual coded input variables on the yield of AC derived from the PKS.
| Source | Coefficient estimate | Sum of squares | df | Mean square | F-value | p-Value | |
|---|---|---|---|---|---|---|---|
| Model | — | 1933.10 | 6 | 322.18 | 311.38 | <0.0001 | significant |
| Intercept | 33.1 | — | 1 | — | — | — | — |
| A-Temperature | −8.42 | 1701.85 | 1 | 1701.85 | 1644.80 | <0.0001 | — |
| B-time | −1.9 | 86.26 | 1 | 86.26 | 83.37 | <0.0001 | — |
| C-Heating rate | −0.6569 | 9.03 | 1 | 9.03 | 8.72 | 0.0071 | — |
| D-Impregnation ratio | 0.7924 | 11.80 | 1 | 11.80 | 11.40 | 0.0026 | — |
| A2 | −2.01 | 116.32 | 1 | 116.32 | 112.42 | <0.0001 | — |
| D2 | −1.06 | 18.48 | 1 | 18.48 | 17.86 | 0.0003 | — |
| Residual | — | 23.80 | 23 | 1.03 | — | — | — |
| Fit statistics | |||||||
| R2 = 0.9878, Adjusted R2 = 0.9847, Predicted R2 = 0.9737 | |||||||
- Note: A, B, C, D: Independent variables representing activation parameters: temperature (A), activation time (B), heating rate (C), impregnation ratio (D), A2, D2: Quadratic terms capturing the nonlinear effects of temperature and impregnation ratio, respectively. F-value: The ratio of variance the model explains to the variance due to residuals. Higher F-values indicate greater significance of the corresponding term. p-value: Probability that the observed relationship occurred by chance. A p-value < 0.05 indicates statistical significance. The SS: this represents the variability in SSA explained by each term. Mean square (MS): average variability explained by the term, calculated as SS divided by degrees of freedom (df). R2, Adjusted R2, Predicted R2: metrics to assess model fit and predictive accuracy. Values close to 1 indicate excellent model performance.
The final equation is a coded equation that uses coded factor levels to simplify the interpretation of the model coefficients. The coefficients directly indicate the strength and direction of the effect of each factor on yield when the factors are set at their respective high (+1) and low (−1) levels. Practically, this model allows for the prediction and optimization of the yield of activated carbon by adjusting the temperature (A), time (B), heating rate (C), and impregnation ratio (D). Insights from this model can guide future experiments and industrial processes to maximize the efficiency of activated carbon production.
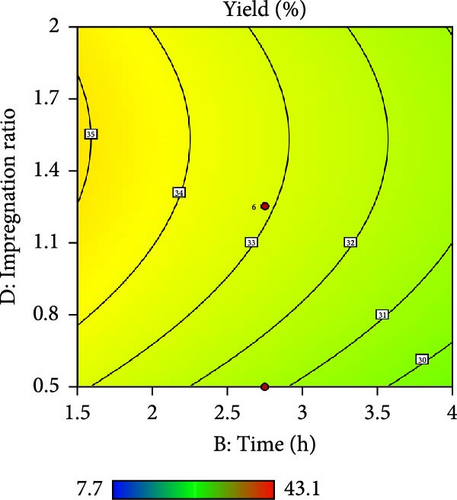
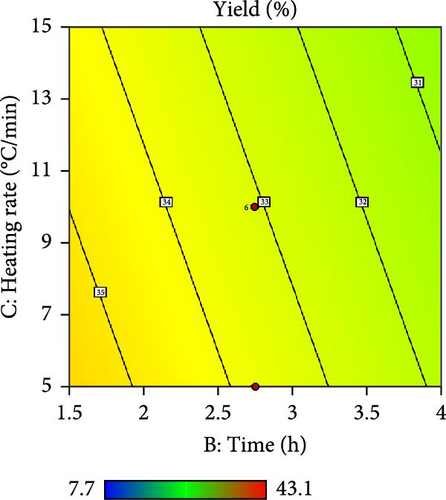
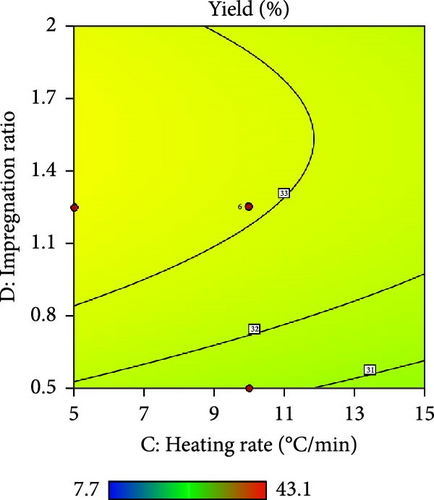
Furthermore, the contour plot and 3D plots obtained from the RSM analysis were used to optimize the pyrolysis parameters for the AC yield, as shown in Figures 4 and 5, respectively. Figure 4a–c shows the interactive effect of the pyrolysis temperature (ranging from 700°C to 900°C) with the residence time, heating rate, and impregnation ratio to assess the variations in the response variable (yield). The results revealed that the yield increased with increasing temperature and plateaued at higher residence times. However, the AC yield increases with increasing temperature and decreasing heating rate. Additionally, Figure 4d,e demonstrate the interaction between the residence time and impregnation ratio and the residence time with respect to the heating rate. The results showed that the optimized AC yield was observed at higher residence times, moderate impregnation ratios, and lower heating rates. Furthermore, Figure 4f illustrates the effect of heating rate and impregnation ratio, with the best yield achieved at lower heating rates and impregnation ratios. The color gradient in each plot, ranging from red to green to blue, represents the yield percentage, with red being the lowest and blue being the highest. The numerical values on the contour lines indicate the specific yield percentages with data points that likely represent the experimental runs. These plots are essential for understanding the effect of the synthesis conditions on the yield and quality of AC.
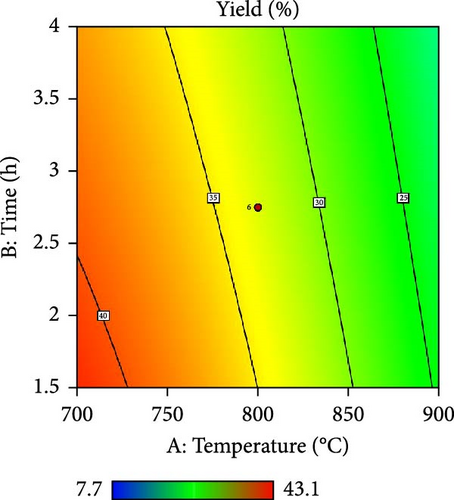
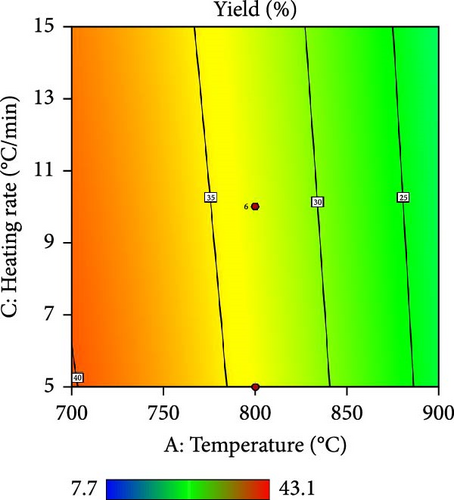
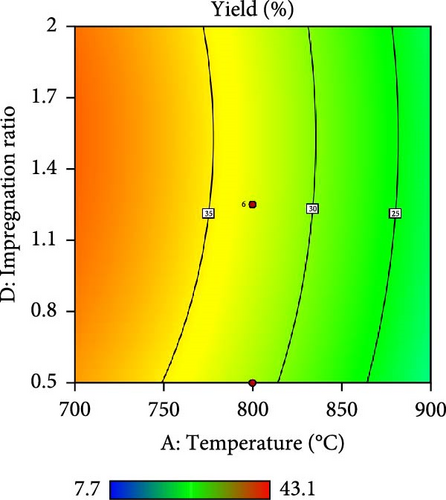
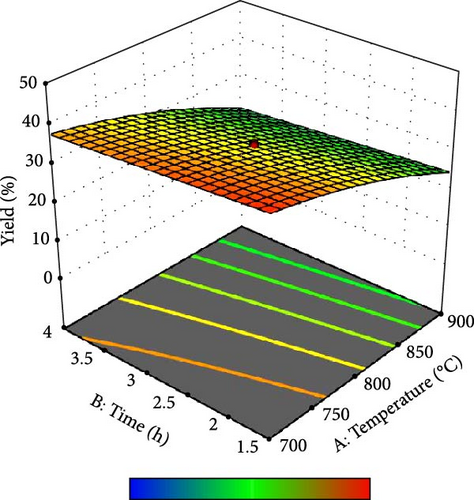
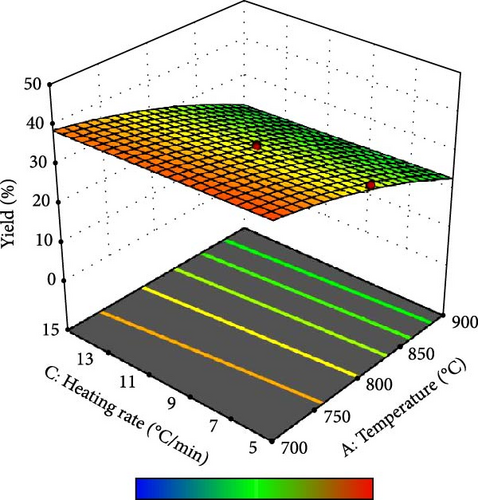
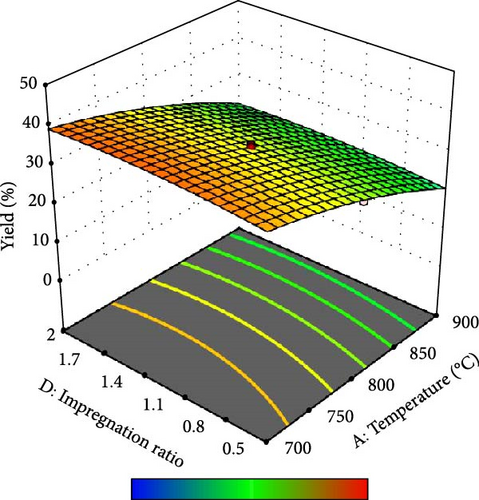
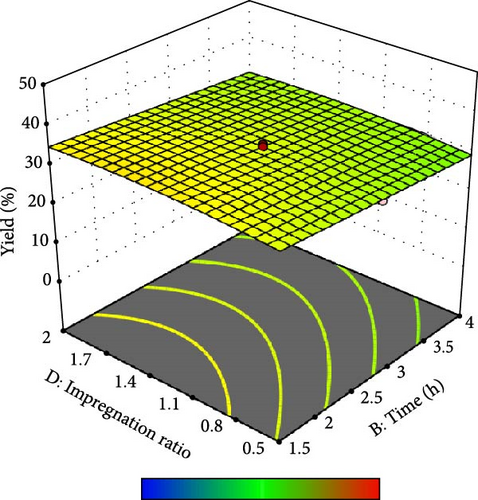

In addition, the set of 3D surface plots provides a visual demonstration of the pyrolysis parameters influencing the yield of PKSAC, with the color gradient representing the yield scale, where warmer colors correspond to higher yields. Figure 5a shows a clear interaction between temperature and time; the yield initially increased with time at lower temperatures, suggesting that an optimal time–temperature combination is required to maximize the yield before it decreases, likely due to over-processing or degradation of the material at prolonged times. However, a relatively flat surface was observed, indicating that variations in the heating rate and time did not significantly alter the yield within the tested range, suggesting that these parameters may be less critical under the studied conditions. Figure 5c reveals a more complex relationship, where the temperature and impregnation ratio (the amount of ZnCl2 used) significantly affected the yield. There is a sweet spot at a moderate temperature and higher impregnation ratio, where the yield peaks before it tapers off at higher temperatures and ratios, possibly owing to excessive burn-off or structural collapse of the carbon matrix. Importantly, it was observed that the interactive effects of impregnation ratio and time are not major influencers within the tested ranges, as the yield remains relatively unchanged across variations in these parameters, which might be beneficial for operational flexibility in industrial settings. Overall, these plots underscore the delicate balance required in the activation process to optimize the yield of the activated carbon. These results suggest that lower heating rates, moderate impregnation ratios, and longer residence times at higher temperatures are optimal for producing a higher yield of activated carbon. These conditions are crucial for ensuring the development of the desired porosity and surface area of activated carbon.
The fit statistics showed a strong R2 of 0.9095, indicating that the model explained a significant proportion of the variability in SSA. The adjusted R2 value for the number of predictors in the model remained high at 0.8860, suggesting that the number of factors included in the model was appropriate. The final equation of the model, expressed in coded terms, allows for predictions of SSA based on the standardized levels of each factor. Coding helps isolate the effect of each factor, making it clear that temperature has the most substantial positive impact on SSA. However, the negative impact of the squared term for time suggests that there might be an optimal time beyond which SSA no longer increases or may even decrease. In summary, the model provides a robust framework for understanding the effects of the processing conditions and optimizing the input variables to achieve the desired SSA of activated carbon.
Furthermore, to extensively explore the interactive effects of process parameters on the SSA of PKSAC, contour and 3D surface plots were obtained using RSM, as shown in Supporting Information Figures S2 and S3, respectively. The results revealed that higher temperatures and longer times tended to increase the SSA, whereas the highest SSAs were found at higher temperatures and lower impregnation ratios, as indicated by the contour lines and color gradient. The interactive effect of residence time and impregnation ratio, a less clear trend was observed; however, it seems that longer times and lower impregnation ratios are favorable for a higher SSA, as seen in the lower right area of the plot (Supporting Information Figure S2). In summary, these contour plots are useful for visualizing the complex interplay between multiple process parameters and their effects on the SSA of materials. Generally, higher temperatures, longer residence times, lower heating rates, and lower impregnation ratios are favorable for achieving a higher SSA based on the provided input variable ranges. However, each plot reflects a different combination of variables, emphasizing the multidimensional nature of the process-optimization problem. Decisions on the process parameters would need to consider all these factors to optimize the SSA for a particular application. Likewise, the 3D surface plot indicates that the SSA increased with both temperature and pyrolysis time, reaching a plateau at higher values for both parameters. In contrast, the SSA appeared to increase with temperature and decrease with an increase in the heating rate, suggesting that slower heating rates are more beneficial for achieving higher SSA at a given temperature (Supporting Information Figure S3b). Furthermore, a lower impregnation ratio, higher pyrolysis temperature, longer residence time, and lower heating rate resulted in a higher SSA of the as-produced AC, as shown in Supporting Information Figure S3c, d, and e, respectively. All plots have a common legend indicating the SSA values, with colors ranging from black for the lowest SSA values to bright green for the highest SSA values. The highest SSA values in each plot seemed to form a ridge or plateau, indicating the optimal region of parameter combinations for maximizing the SSA. The 3D surface analysis can be extremely useful in materials science and chemical engineering for optimizing process conditions to achieve the desired material properties. In activated carbon production, achieving higher SSA often involves conditions that favor extensive pore development, such as higher activation temperatures, prolonged activation times, or increased activator concentrations. These conditions enhance the removal of volatile components and facilitate carbon etching, leading to a highly porous structure. However, these processes also result in greater mass loss from the precursor material, which directly compromises the yield of the final product. For instance, while a higher SSA is desirable for applications such as gas adsorption or energy storage, where a large surface area is crucial for performance, the reduced yield increases production costs and limits scalability, particularly in industries requiring bulk production of AC. Conversely, optimizing for yield typically involves milder activation conditions, such as lower temperatures or reduced activator concentrations, which retain more of the precursor’s mass but may limit pore development and SSA. While such conditions may result in lower production costs, the reduced SSA can hinder the material’s performance in applications that rely on high adsorption capacities, such as water purification or catalysis. However, these materials may still suit applications with less stringent SSA requirements, such as soil conditioning or certain filtration tasks. Balancing SSA and yield, therefore, involves tradeoffs that depend on the target application. For high-value, low-volume applications such as supercapacitors or gas storage, the focus on maximizing SSA is justified, even at the expense of yield. On the other hand, optimizing for a balance between adequate SSA and reasonable yield is more practical for cost-sensitive, large-scale uses such as wastewater treatment. The proposed single-step process offers flexibility in tuning activation parameters to prioritize either yield or SSA, depending on application-specific requirements, thereby enhancing its industrial relevance. This expanded discussion emphasizes the importance of understanding these tradeoffs to guide the tailored production of AC for diverse applications. This helps adjust the pyrolysis temperature, residence time, heating rate, and impregnation ratio during material processing to achieve the highest possible SSA, which is often desired for catalytic or adsorption applications because of the increased number of active sites available for reactions or interactions.
3.4. Machine Learning Regressors
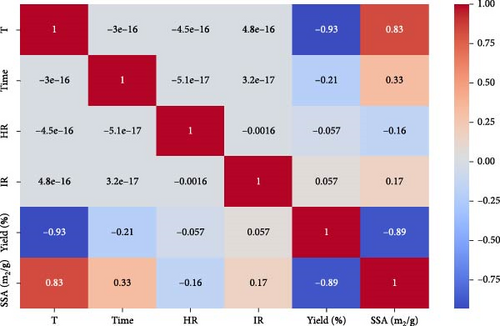
While RSM is an established tool for process optimization, its predictive capability is often limited to the specific experimental range and interactions included in the model. In contrast, ML algorithms such as XGB and RF capture complex, nonlinear relationships and higher-order interactions that RSM may overlook, enhancing predictive accuracy and robustness. Including XGB and RF in this study strengthens the reliability of the optimization process by enabling the generation of predictive models based on a wider dataset, even with limited experimental runs. These algorithms can handle variability in the data and provide insights into parameter importance, which enhances understanding of the factors influencing yield and SSA. The correlation between different independent variables such as temperature, time, HR, IR, and responses such as yield (%) and SSA (m2/g) are presented in the heatmap. The correlation values range from −1 to 1, as depicted by the color bar, with blue shades representing negative correlations and red shades representing positive ones. The strong negative correlation (−0.93) between T and yield (%) suggests that the yield decreases significantly as temperature increases. Similarly, SSA (m2/g) positively correlates with T (0.83), indicating that SSA increases with temperature. A moderate negative correlation (−0.89) between SSA and yield implies an inverse relationship between these variables, as shown in the correlation heatmap (Figure 6). Other variables, such as time, HR, and IR, show minimal correlation with the rest, as indicated by values close to zero. The relationships between multiple variables through scatter plots for each pair of variables, along with histograms on the diagonal representing the distribution of each variable individually, are shown in Supporting Information Figure S4. Variables included are T, time, HR, IR, yield (%), and SSA (m2/g). The scatter plots indicate the relationship between two variables, while the histograms along the diagonal indicate the distribution of the individual variables. The scatter plots reveal a noticeable lack of strong linear relationships between most variables, as most points are scattered without clear patterns, but there is a noticeable pattern between yield (%) and SSA (m2/g). This is visually apparent as a downward trend in the scatter plot between the response parameters. The histograms indicate that SSA has a more evenly spread distribution, similar to T, while yield tends to cluster between 20% and 30%. Other relationships, such as time, HR, and IR with SSA, show no clear patterns, reinforcing the weak correlations. Overall, the plot highlights some variation but suggests no immediate, strong relationships between the variables based on the scatter plot distribution.
Supporting Information Table S3 presents the data distribution along with the standard deviation and mean values for various independent and dependent variables. The outlier free data was used to develop the ML modles using RF and XGB reressors, for predicting yield (%) and SSA (m2/g). The RF model achieved a mean absolute error (MAE) of 0.81, which indicates the average absolute difference between predicted and actual yield values is 0.81 units. It had a MSE of 2.58, signifying that the average squared difference between predicted and actual values is relatively large. The RMSE, which measures the spread of errors, was 1.61. The model’s R2, representing the proportion of variance explained by the model, was 0.76, meaning it explained 76% of the variance in the yield data. Comparatively, the XGB regressor model showed a slightly higher MAE of 0.95, indicating slightly less accurate predictions than the RF model. However, the MSE was significantly lower at 1.66, and the RMSE was also smaller at 1.29, suggesting that the XGB model had smaller error variances and more consistent predictions. Moreover, the R2 value for this model was 0.84, indicating it explained 84% of the variance in the yield, outperforming the RF model in terms of explanatory power. Despite a slightly higher MAE, the XGB provided better overall performance due to lower MSE and RMSE values and a higher R2. Similarly, the pyrolysis parameters were also correlated to develop the prediction models for the SSA of AC using RF and XGB. Herein, the RF model achieved an MAE and RMSE of 165.05 and 239.23, respectively, with the R2 value of 0.73. On the other hand, the XGB regressor showed a lower MAE of 122.90, meaning its predictions were more accurate on average compared to the RF model. Additionally, the MSE for this model was 32,576.58, considerably lower, and the RMSE was 180.49, indicating more precise predictions. Its R2 value was 0.84, showing it explained 84% of the variance in SSA, outperforming the RF model in terms of both prediction accuracy and variance explained. Overall, the XGB regressor provided superior performance for predicting SSA, with smaller errors and higher explanatory power, and hence, can be used to predict the SSA of activated carbon at different pyrolysis conditions. The superior performance of XGB compared to RF model in predicting SSA and yield can be attributed to the fundamental differences in their algorithmic structures and handling of data complexity. XGB, as a gradient-boosting algorithm, builds decision trees sequentially, where each tree attempts to correct the errors made by its predecessors. This iterative learning process allows XGB to effectively capture complex nonlinear relationships and subtle interactions among input features, common in pyrolysis processes involving multiple interdependent parameters such as temperature, activator concentration, and activation time. Additionally, XGB incorporates regularization techniques to prevent overfitting, which is particularly beneficial for smaller datasets like the one used in this study. This combination of error correction and regularization contributes to XGB’s higher accuracy and robustness in predicting SSA and yield. In contrast, RF builds multiple decision trees independently and aggregates their predictions by averaging. While RF is highly effective at reducing variance and less prone to overfitting than single decision trees, it may struggle to model highly complex relationships as efficiently as XGB. Since RF does not use sequential learning, it lacks the iterative refinement process that allows XGB to minimize prediction errors more effectively. In the context of this study, the performance gap is likely due to XGB’s ability to better capture the nonlinear dependencies between pyrolysis parameters and their effects on SSA and yield. For instance, interactions between temperature and ZnCl2 concentration, or activation time and precursor properties, may exhibit intricate patterns that XGB models with greater precision. Furthermore, XGB’s hyperparameter tuning, such as learning rate and maximum tree depth, provides additional flexibility to tailor the model to the specific characteristics of the dataset. Overall, the higher predictive accuracy of XGB makes it more suitable for optimization and prediction tasks in this study, where understanding the nuanced effects of multiple parameters is critical for optimizing the synthesis of activated carbon. This observation underscores the importance of selecting machine learning models that align with the complexity of the data and the objectives of the analysis.
Feature importance rankings have been included in the revised manuscript to highlight the most influential variables affecting yield and SSA in the proposed process. These rankings, derived from the machine learning models (XGB and RF), provide critical insights into the relative impact of activation parameters such as temperature, ZnCl2 concentration, activation time, and precursor properties. The analysis shows that activation temperature consistently ranks as the most significant variable influencing both SSA and yield. Higher temperatures facilitate carbon etching and pore development, which enhance SSA but simultaneously reduce yield due to increased mass loss. ZnCl2 concentration is the second most impactful factor, directly affecting the chemical activation efficiency and pore structure. Moderate concentrations optimize pore formation, while excessively high concentrations can lead to pore collapse or residual chemical retention, adversely affecting both yield and SSA. Activation time also plays a key role in determining yield, with prolonged durations increasing mass loss but enhancing pore structure. Interestingly, interactions between parameters, such as temperature and ZnCl2 concentration, also exhibit high importance in the XGB model, underscoring the nonlinear and interdependent nature of the process. These insights are corroborated by the contour and 3D surface plots, which visually demonstrate the influence of these parameters on the outcomes. The feature analysis clarifies the process dynamics and offers actionable guidance for optimizing activation conditions by including these parametric importance rankings. For example, industries focusing on applications requiring high SSA can prioritize temperature optimization, while those emphasizing yield preservation might adjust ZnCl2 concentration and activation time.
3.5. Comparison Between Predicted Versus Actual Values by RSM and ML
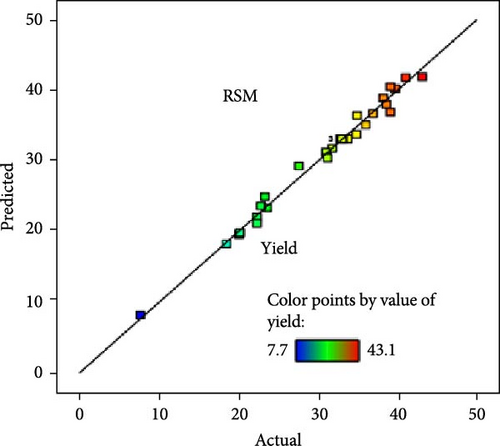
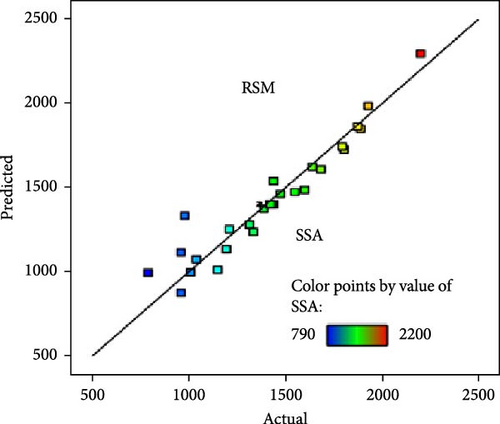
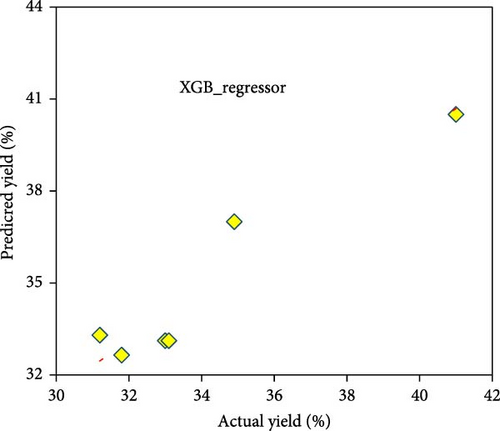
A comparative analysis of the pyrolysis performance in terms of the yield and SSA of the AC was conducted by measuring the predicted values against the actual observed values, using two different modeling approaches, that is, RSM and XGB regressor. Figure 7a,b shows the RSM technique’s predicted values of yield and SSA. Each data point represents a specific experiment or condition within the pyrolysis process, and the color of the points represents the value of the yield and SSA, with the scale provided in the legend ranging from 7.7% to 43.1% and from 790 to 2200 m2/g, respectively. The points are colored according to their yield and SSA values, with blue and red indicating the lowest and highest values, respectively, showing a diagonal line representing perfect predictions. The predicted points closely follow this line, indicating that the RSM model provides relatively accurate predictions. However, there is slight dispersion, particularly for the SSA (Figure 7b), suggesting some deviations for higher values. This could be due to various factors, such as nonlinear behavior in the material properties at larger surface areas or limitations in the model’s assumptions that become more apparent at higher SSA values. On the other hand, Figure 7c,d shows the results of the XGBoost regressor for predicting yield and SSA. The predictions are represented by points overlaid on a dotted red regression line, with much tighter clustering around the line than in the RSM plots, implying higher accuracy for the XGBoost model. This is particularly evident in Figure 7d for SSA, where the XGB model produces almost perfect predictions, as all points are close to the regression line. Overall, the XGB Regressor outperforms the RSM model, especially in predicting SSA, with much less deviation from actual values. Hence, an ML-XGB regressor model is a reliable tool for predicting the outcomes of pyrolysis under various conditions, aiding in optimizing the process for the desired yields and SSA of the as-produced AC.

4. Conclusion
In conclusion, the successful development of a single-step, sustainable synthesis method for porous carbon from PKS with CO2 activation, represents a significant step forward in the pursuit of efficient and eco-friendly biomass valorization technology. By employing CO2 as a physical activator during the synthesis process, this study aligns with global net-zero emissions goals by utilizing a GHG as a resource rather than emitting it. The findings of this study underscore the importance of integrating sustainability principles into material synthesis and process optimization by machine-learning approach. The results suggest that lower heating rates, moderate impregnation ratios, and longer residence times at higher temperatures are optimal for producing a higher yield with the desired porosity and surface area of activated carbon. Utilizing PKS, an abundant agricultural byproduct, along with CO2, a major contributor to GHGs, contributes to waste reduction and emission control, supporting global initiatives for sustainability and carbon footprint reduction.
Ethics Statement
The authors have nothing to report.
Conflicts of Interest
The authors declare no conflicts of interest.
Funding
There is no specific funding for this research work.
Acknowledgments
The authors thank the University of Malaya and Khalifa University for their research support.
Supporting Information
Additional supporting information can be found online in the Supporting Information section.
Open Research
Data Availability Statement
Data can be provided on request.


