Development of a Data-Driven Techno-Economic and Environmental Framework for Solar Energy Deployment in the Energy Mix: A Case Study of Pakistan
Abstract
Numerous countries have outlined their renewable energy objectives for 2030 and 2050; however, the strategy for attaining these targets poses significant challenges. While solar energy is considered a promising solution to address the energy crisis as well as the climate change, it is essential to conduct a comprehensive evaluation of various factors before formulating any national energy policy. This study aims to utilize data-driven techno-economic and environmental optimization models to (1) analyze multiple locations simultaneously to identify the most suitable sites for solar plant deployment based on solar resources; (2) conduct a detailed techno-economic analysis (TEA) to evaluate parameters such as payback period and rate of return on investment (ROROI); and (3) formulate the country’s energy mix to meet multiple objectives and constraints. A comprehensive case study for a developing country is employed to evaluate the proposed models. Optimal sites based on solar resources are identified from a pool of 150 locations that are examined simultaneously. A 40%–70% reduction in electricity costs can be achieved by using solar energy instead of conventional grid sources. A life cycle analysis (LCA) comparing the current grid to a solar-dominant grid reveals a 41% reduction in global warming potential (GWP) when solar energy is utilized to meet national renewable energy targets for 2030. These developed models provide an efficient tool for any country, offering valuable insights to policymakers and stakeholders and facilitating the creation of sustainable energy strategies that prioritize accessibility and environmental friendliness.
1. Introduction
The continuously growing world population, rapid economic development, and urbanization have led to an unprecedented surge in global energy demand. Although fossil fuels have traditionally served as the primary energy source, their finite availability and harmful environmental consequences have prompted a shift toward cleaner alternatives. Recently, solar energy has gained popularity as an alternative energy source. Technological progress and economies of scale have made solar energy competitive with fossil fuels. For instance, from 2010 to 2018, solar photovoltaic (PV) electricity costs dropped by 77%, while the installed capacity grew 100-fold between 2005 and 2018 [1]. Solar PV now plays a crucial role in achieving affordable, reliable, and low-carbon electricity, aligning with the Paris Climate Agreement and the Sustainable Development Goals of many countries.
As numerous countries unveil their renewable energy targets for 2030 and 2050, there has been a notable emphasis on research exploring the nationwide capacity of solar energy. Table 1 presents studies focusing on the viability of solar energy.
| Country | Scope of studies |
|---|---|
| Saudi Arabia | |
| Egypt | |
| Iran | |
| China | |
| India | |
| Algeria | |
| Turkey | |
Numerous studies present models that predict the solar potential of various countries. However, a common limitation in these studies is their focus on a single or a few major locations within a country. This approach fails to provide a robust representation of the entire nation’s situation, given the significant variation in solar potential across different geographies. Many techno-economic analyses in the literature extensively detail the economic feasibility of solar plants, primarily relying on the levelized cost of energy (LCOE) as the evaluation parameter. Furthermore, in examining the widespread environmental implications of large-scale solar energy adoption, most of the aforementioned studies focus solely on evaluating greenhouse gas (GHG) emissions. For a comprehensive analysis, however, it is essential to delve into the entire environmental profile of solar installations, considering factors such as ozone depletion potential, human toxicity potential, and acidification potential, among others. It is also crucial to compare these environmental impacts with the existing conventional grid to gauge the environmental benefits of incorporating solar energy. Additionally, assessing land requirements for extensive solar initiatives at a national level is imperative. Apart from this, for a nationwide analysis, a decision-making tool is required to guide adjustments to the national energy composition, aiming to diminish dependence on conventional fossil fuels and enhance the involvement of more environmentally friendly energy sources like solar and wind, with the goal of achieving carbon neutrality. The primary objective of this study is to develop a framework capable of evaluating solar potential across an entire country, encompassing all the aforementioned aspects. This investigation demonstrates the practical application of this framework in Pakistan, a country rich in solar resources but currently grappling with energy shortages.
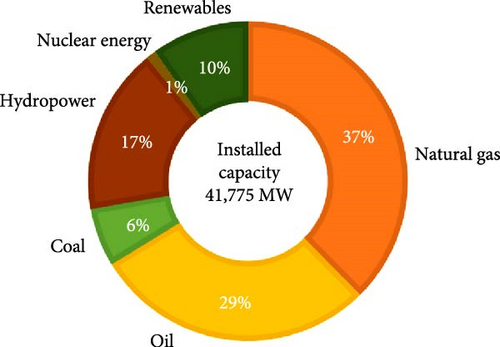
Pakistan has been experiencing a severe energy crisis for several years, significantly disrupting daily life and economic activity [48]. An inefficient energy mix, outdated energy infrastructure, inadequate budget allocations for the energy sector, and ineffective policy measures are the major contributors to this crisis [48–50]. Figure 1 shows Pakistan’s energy mix, which relies heavily on fossil fuels, primarily natural gas (37%) and oil (29%) [51, 52]. However, domestic production of natural gas has not kept pace with demand, and the country is heavily dependent on imported oil and gas, which are expensive and subject to price fluctuations. The share of renewables, which includes solar, wind, geothermal energy, and biomass, remains only about 10% in the energy mix [52].
Due to its geographical location, high population density, and reliance on agriculture, Pakistan is highly susceptible to the impacts of climate change. The country is already witnessing consequences such as changes in temperature and rainfall patterns, more frequent and severe heatwaves, droughts, floods, smog, and rising sea levels [53–55]. These changes negatively affect crop yields and agricultural productivity, impacting the livelihoods of millions who rely on agriculture for their income [56].
Like several other countries, Pakistan adopted the Alternative and Renewable Energy Policy in 2019, which aims to increase the proportion of renewable energy in its energy mix to 60% by 2030 (including hydroelectricity) [57, 58]. Due to several mountain ranges, high solar insolation, and about 1146 km of coastline, the country possesses excellent potential for renewable resources. Pakistan’s average daily global horizontal solar insolation ranges from 4.45 to 5.83 kWh/m2/day, considerably higher than the world average of 3.61 kWh/m2/day [59]. Numerous research endeavors explore Pakistan’s solar resources [60–62] and the factors influencing them [63–65]. However, most of these investigations examine only a limited number of locations. Given Pakistan’s varied topography and climatic conditions, expanding the dataset for analysis is crucial to achieve a comprehensive assessment across the country. Many studies also showcase the techno-economic aspects of solar PV systems in different regions of Pakistan [66, 67]. Nonetheless, there is a scarcity of studies that take a comprehensive approach, examining various (economic, environmental, and planning) aspects while accounting for multiple locations to harness solar energy for fulfilling Pakistan’s national energy requirements.
To achieve renewable targets, large-scale solar farms may be deployed across the country. This study employs an isotropic model to evaluate solar power potential across 150 diverse sites in Pakistan. A mixed integer nonlinear programming (MINLP) is formulated to identify the most favorable sites within each administrative division (provinces and territories) of the country by minimizing the LCOE. Subsequently, a comprehensive techno-economic analysis (TEA) is presented, calculating the required investment, operating and maintenance costs, payback period, net present value (NPV), and rate of return on investment (ROROI) for a 1 MW plant, as well as for plant scales of 1.4 GW, 3 GW, 7 GW, 10 GW, and 14 GW, representing 10%, 25%, 50%, 75%, and 100% of the country’s proposed capacity to meet renewable energy targets, respectively. The study also addresses area requirements and the associated costs essential for increasing the share of solar energy in Pakistan’s energy mix. To evaluate environmental impact comprehensively, a cradle-to-gate life cycle analysis (LCA) is conducted for a solar-dominant grid, with outcomes juxtaposed against the existing grid in Pakistan. To strategize for the year 2030, the study presents a multiperiod optimization model aimed at optimizing Pakistan’s energy mix, with the objective of curtailing CO2 emissions while reducing dependence on fossil fuels. Moreover, the study underscores the significance of implementing specific policies that stakeholders should consider when engaging in large-scale solar projects.
2. Methodology
2.1. Optimization Model for Finding Optimal Locations
To accurately estimate power output, it is important to consider both the total radiation that reaches the panel and the losses that occur during the conversion of that radiation into usable power. In this study, direct, diffuse, and ground-reflected rays were considered to estimate the total radiation received by a tilted panel. Furthermore, losses of around 15% were assumed to account for temperature-related losses, ohmic wiring losses, mismatch losses, inverter losses during operation, etc. It should be noted that the model assumes an isotropic sky and does not account for shading effects from nearby structures (assuming that these projects will be deployed on vacant land rather than residential areas). A monocrystalline PV module with a maximum power of 545 W per panel and an efficiency of 21.3% at standard test conditions (STC) was considered for the analysis. The database “Meteonorm” version 7.0 was used to obtain hourly data for global horizontal irradiance (GHI), global diffuse irradiance (DHI), and ambient temperature for 150 locations in Pakistan [68].
A MINLP model was developed and implemented in general algebraic modeling system (GAMS) to minimize the LCOE across 150 diverse sites in Pakistan. The primary decision variable in this model was the optimization of the tilt angle of the solar panels installed at each site. We optimized the tilt angle monthly to maximize the solar output. The developed MINLP model comprises 1563 constraints, 1528 continuous decision variables (both linear and nonlinear), and 12 binary variables. To find a global optimal solution, the “Lindoglobal” solver was used. The complete mathematical model of solar energy production is provided in the Supporting Information. The model has been validated by simulating a solar plant of the same size in PVSyst at the same locations, showing a percentage error of ~10% between our model and the software. All assumptions used in the model are given in Tables S1 and S2 of the Supporting Information.
2.2. TEA
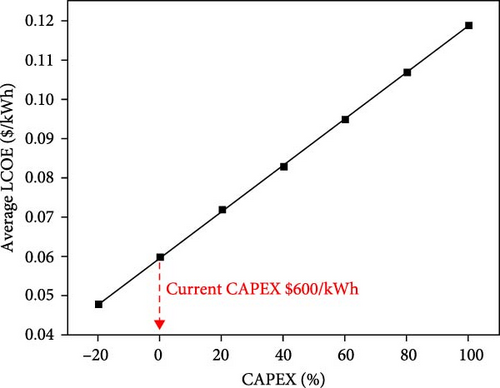
To evaluate the economics of solar electricity production, a discounted cash flow analysis was conducted on a 1 MW plant, considering total capital expenditure (CAPEX), operating costs (OPEX), and specific production calculated from the previous model. The ROROI and NPV were calculated for fixed electricity selling prices, both with and without land costs. A sensitivity analysis assessed the selling price needed to achieve breakeven at zero NPV over the project’s lifetime, while another analysis examined how CAPEX impacts the average LCOE in the country. The TEA model is detailed in the Supporting Information, and the assumptions used in this analysis are provided in Table S2.
2.3. LCA
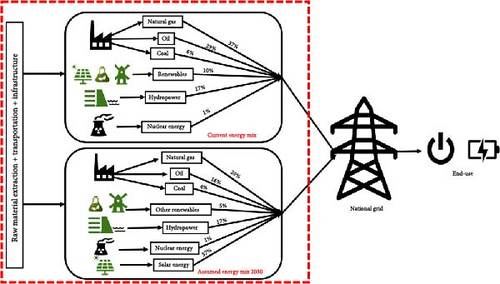
LCA is a holistic and systematic environmental management tool for assessing the environmental impact associated with all stages of a product’s lifecycle according to ISO 14040 and 14044 guidelines. The goal of LCA in this study is to evaluate and compare the environmental impacts of energy production from a solar-dominant grid (achieving a 60% renewable target) and the current energy mix (grid) of Pakistan. A cradle-to-gate boundary was considered for the analysis, as shown in Figure 2. The life cycle inventory for the solar and current grid is shown in Table S3. A functional unit of 1 kWh was selected. Characterization data were extracted from Ecoinvent 3.6 and USLCI (Table S4) and were characterized for life cycle impact assessment using the CML-IA V3.06 method in SimaPro 9.1.0.7. Eleven environmental indicators are considered in this assessment to evaluate the complete environmental profile.
2.4. Optimization Model for Finding Optimal Energy Mix by 2030
A multiperiod nonlinear programming (NLP) model was developed to optimize the energy mix and GHG emissions reduction in the power sector over a 7-year time horizon, from 2023 to 2030. The mathematical programming model considers various energy sources, including natural gas, oil, coal, solar, hydroelectric power, nuclear power, and wind. The objective is to minimize the global warming potential (GWP) associated with the energy mix while ensuring energy balance (demand), adhering to budget constraints, and accounting for yearly GWP limitations. The model allows for yearly expansions and reductions in specific energy sources, providing a comprehensive analysis of the impact of different strategies on the overall energy system and environmental sustainability. The developed NLP model comprises 260 constraints and 238 continuous decision variables (both linear and nonlinear). To find a globally optimal solution, the “Lindoglobal” solver was used. The complete mathematical model is provided in the Supporting Information, and the assumptions used in this analysis are detailed in Tables S5 and S6.
3. Results and Discussion
3.1. Solar Resource Potential in Pakistan
Figure 3 shows a map of Pakistan displaying administrative boundaries, along with the range of specific power output for each division. For this analysis, we considered seven major administrative divisions: four provinces (Punjab, Sindh, Khyber Pakhtunkhwa [KPK], and Balochistan) and three territories (Federally Administered Tribal Area, Gilgit-Baltistan and Azad Jammu and Kashmir).
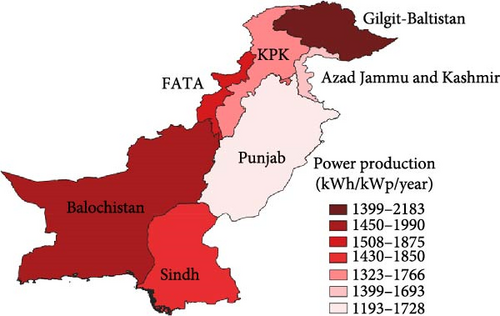
The results reveal that Balochistan and Gilgit-Baltistan exhibit significant solar resources with an average specific power production of 1760 and 1730 kWh/kWp/year, respectively. They are followed by Federally Administered Tribal Area, Sindh, KPK, Punjab, and Azad Jammu and Kashmir, with an average of 1682, 1643, 1608, 1580, and 1550 kWh/kWp/year, respectively.
Interestingly, when the administrative divisions are compared based on area and population (Table 2), an opposite trend emerges. Punjab has the highest population and, consequently, the highest electricity consumption among all the divisions, followed by Sindh and KPK. In contrast, Balochistan has the largest area but a much smaller population and lower electricity consumption compared to Punjab. On the other hand, divisions such as the Federally Administered Tribal Areas, Azad Jammu and Kashmir, and Gilgit-Baltistan have underdeveloped electricity transmission and distribution infrastructure. In these areas, the implementation of solar PV technology would be particularly advantageous for regional development.
| Province/territory | Area (km2) | Population (2017 census) | Electricity consumption (%) | Installed capacity (%) |
|---|---|---|---|---|
| Punjab | 205,354 | 109,989,655 | 54 | 43 |
| Sindh | 140,914 | 47,854,510 | 31 | 26 |
| Khyber Pakhtunkhwa | 74,521 | 30,508,920 | 8 | 15 |
| Balochistan | 347,190 | 12,335,129 | 3 | 9 |
| Azad Jammu and Kashmir | 13,297 | 4,045,366 | 1 | 5 |
| Federally Administered Tribal Area | 27,220 | 4,993,044 | 2 | 1 |
| Gilgit-Baltistan | 72,971 | 1,249,000 | 1 | 1 |
The crucial question is where future solar parks should be located to optimally meet the energy needs of each administrative division. Table 3 presents the top five optimal locations for each administrative division along with their specific power output. These optimal sites have the best solar resources and are economically viable for solar plant deployment, given that they have the lowest LCOE. In Punjab, Dera Ghazi Khan is a promising location with 25 industrial units and various small cottage industries, as well as a large cement factory. Another notable site is Bahawalpur, home to Pakistan’s largest solar park, the Quaid-e-Azam Solar Park with a target capacity of 1000 MW. In Sindh, Karachi shows good potential which is particularly interesting as it is the largest city of Pakistan and an industrial hub with significant energy requirements. Dera Ismail Khan in KPK hosts many textile and flour mills. Locations in Azad Jammu Kashmir and Gilgit-Baltistan are popular tourist destinations. Tourism can be promoted further by providing better facilities powered by solar energy.
| Province/territory | Optimal locations | Annual specific production (kWh/kWp) |
|---|---|---|
| Punjab | Dera Ghazi Khan | 1726 |
| Bahawalnagar | 1701 | |
| Gujarat | 1700 | |
| Rawalpindi | 1669 | |
| Bahawalpur | 1649 | |
| Sindh | Karachi | 1750 |
| Mirpurkhas | 1734 | |
| Umerkot | 1723 | |
| Malir | 1713 | |
| Rann of Kutch | 1701 | |
| Khyber Pakhtunkhwa | Kohistan | 1767 |
| Battagram | 1744 | |
| Bannu | 1741 | |
| Hangu | 1739 | |
| Dera Ismail Khan | 1727 | |
| Balochistan | Chagai | 1990 |
| Qilla Saifullah | 1958 | |
| Kholu | 1926 | |
| Kech | 1925 | |
| Loralai | 1909 | |
| Azad Jammu and Kashmir | Poonch | 1693 |
| Bagh | 1629 | |
| Mirpur | 1604 | |
| Muzaffarabad | 1591 | |
| Bhimber | 1550 | |
| Federally Administered Tribal Area | Largha Shirani | 1875 |
| N. Waziristan | 1803 | |
| Kurram | 1792 | |
| Bajaur | 1651 | |
| S. Waziristan | 1646 | |
| Gilgit-Baltistan | Kargil | 2183 |
| Ladakh (Leh) | 2095 | |
| Chilas | 1851 | |
| Gilgit | 1753 | |
| Shigar | 1751 | |
3.2. Solar Plant Area Requirement, Land Availability, and Cost
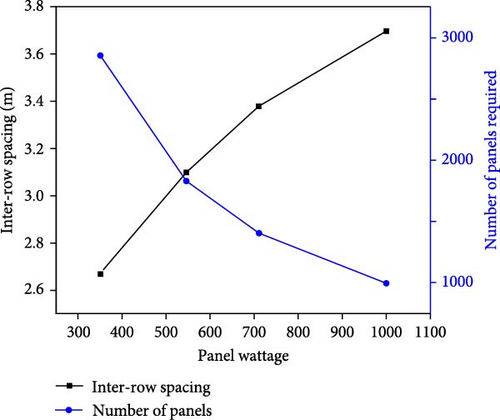
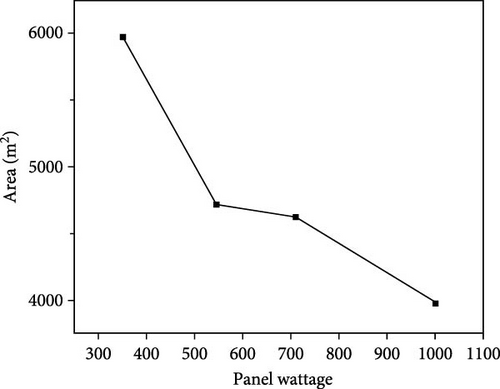
When planning large solar plants, it is essential to consider the required area, particularly in big urban areas where land availability is critical. Additionally, land purchase costs significantly to the LCOE. Figure 4A shows that inter-row spacing is directly proportional to panel wattage, while the number of panels required is inversely proportional. This is because as panel wattage increases, the size of the panels also increases, necessitating larger inter-row spacing to prevent shadowing. Conversely, the number of panels required decreases significantly as panel wattage increases. Figure 4B shows that the area requirement can be reduced by 21% if 545 W panels are used instead of 350 W for a 1 MW plant. With technological advancement, it is likely that 1000 W panels will be commercially available in the near future, which could further reduce area requirements by 33%, saving a significant portion of the land cost.
Despite the abundant renewable resources in Pakistan, solar energy currently accounts for only 1.4% of the country’s energy mix. With government policies actively promoting a shift toward renewable energy, it is crucial to calculate the area and CAPEX required for land acquisition. To meet its renewable energy targets, Pakistan needs to boost its installed capacity from renewable sources by 32%. Table 4 outlines the capacity for solar plants needed, along with the corresponding land requirements and associated costs for reaching milestones of 10%, 25%, 50%, 75%, and 100% achievement toward this target using solar energy. Notably, if all the target is achieved using solar energy, about 66.1 km2 will be required, representing only 0.01% of Pakistan’s total area. While this may seem small, the land cost associated with this area can be substantial. Assuming a conservative minimum land cost of $100/m2, an investment of 6.61 billion dollars is necessary for land purchase alone. This figure may vary based on the division and its population. Large open areas of land may be conveniently available at lower rates in divisions with low populations, such as Balochistan, Gilgit-Baltistan, and Azad Jammu and Kashmir. However, uneven and mountainous terrain in these divisions could increase the installation cost of solar plants.
| Percentage of proposed capacity | Solar plant (GW) |
Area requirement (km2) | Land cost (billion $) | Initial investment (billion $) |
|---|---|---|---|---|
| 10 | 1.4 | 6.6 | 0.66 | 0.84 |
| 25 | 3 | 14.2 | 1.42 | 1.8 |
| 50 | 7 | 33.1 | 3.31 | 4.2 |
| 75 | 10 | 47.2 | 4.72 | 6 |
| 100 | 14 | 66.1 | 6.61 | 8.84 |
3.3. TEA
Investing in large solar plants requires substantial capital investment. However, the current budget allocated to the energy sector is significantly lower than what is needed for large-scale solar plant deployment. Therefore, attracting international investors and companies through major incentives is crucial. A detailed TEA is presented to evaluate the merits and demerits of solar energy production in Pakistan. Table 4 summarizes the initial investment required to install large-scale solar plants at different capacities.
Figure 5A shows the discounted cash flow analysis for Lahore (a major city in Punjab), assuming a 1 MW plant scale, a project life of 30 years, and no land costs. At an electricity selling price of $0.10/kWh, the payback period is 5.8 years, with a ROROI of 15%. Figure 5B shows the same analysis when land costs are included, resulting in a payback period of 15.3 years and a ROROI of 12%. When land costs are factored in, the payback period increases by 62%, while the NPV decreases by 68%. The minimum electricity selling price that results in an NPV of zero is calculated to be $0.049/kWh without land costs and $0.083/kWh with land costs. By considering the land costs, the prices increase by 41% and leave little room for profit. Figure 6 shows variation in the payback period when the electricity selling price is manipulated.
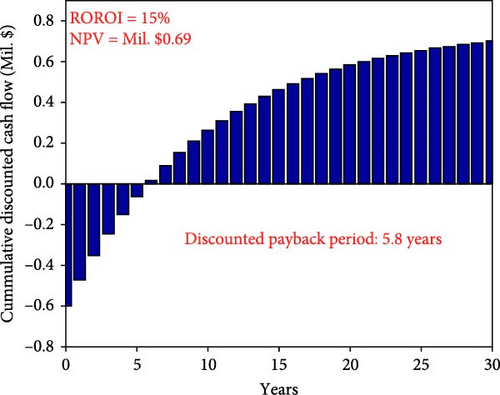
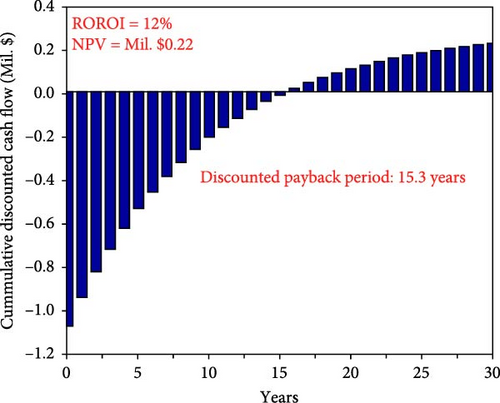
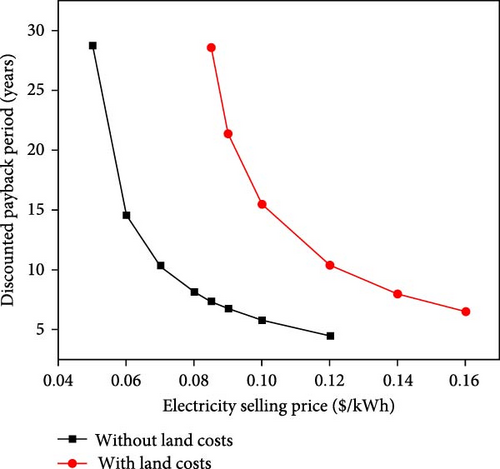
Figure 7A shows the LCOE graduation throughout Pakistan across the 150 sites studied. The country has an average LCOE of around $0.06/kWh. Areas in the southwest (Balochistan) and north (Gilgit-Baltistan) show the lowest LCOE around $0.04/kWh, while most areas in Punjab and Sindh range from $0.058 to 0.06/kWh. Only a few cities have LCOE exceeding $0.07/kWh. The current residential electricity prices in Pakistan (primarily generated from oil and coal) are $0.2/kWh during off-peak hours and $0.23/kWh during peak hours. Figure 7B shows the LCOE graduation when land costs are included, resulting in an average LCOE of $0.091/kWh, 34% higher than without land costs. Figure 7C shows the payback period for a 1 MW plant deployed in these locations at a selling price of $0.10/kWh; areas with good potential have payback periods as low as 3–4 years, with the maximum payback period reaching 9 years. However, including land costs significantly increases the payback period, as shown in Figure 7D.
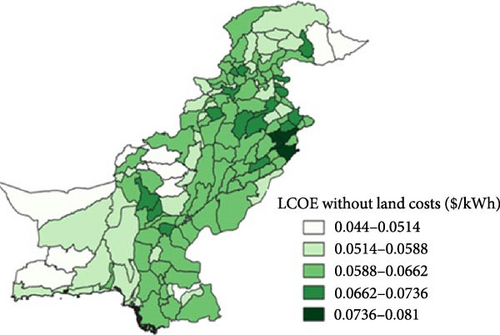
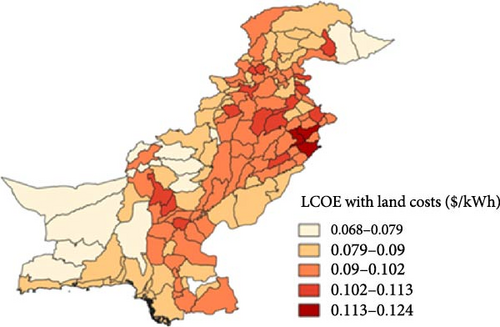
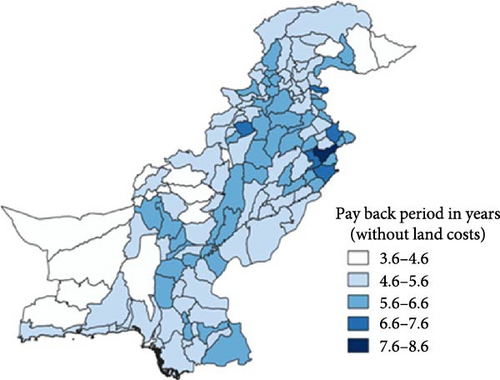
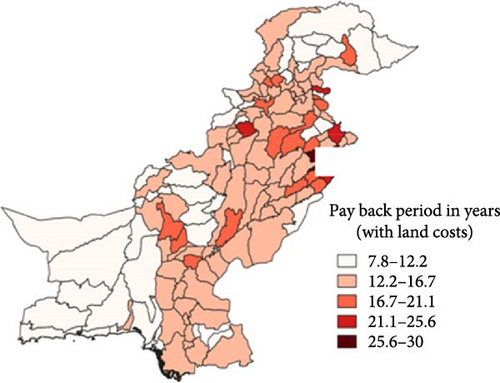
Figure 8 illustrates the variation in CAPEX and its impact on LCOE. In cases where CAPEX increases by 100%, the average LCOE for Pakistan reaches $0.12/kWh, still cheaper than residential electricity during peak hours. Technological advancements and economies of scale are expected to significantly lower module and inverter prices in the coming years, with a projected 40%–50% decline in solar PV CAPEX by 2050, suggesting that solar-generated electricity will be cheaper than current rates. Conversely, fossil fuel electricity costs are likely to rise as these resources are finite.
To validate the economic analysis, the LCOE values obtained in this study are compared (Table 5) with those reported in existing research on Pakistan and its neighboring countries. Many of these studies focus on grid-connected solar PV systems, resulting in slightly higher reported LCOE values than those presented here. Nonetheless, the evaluated LCOE values align well with the existing literature which assumes similar parameters, thereby confirming the validity of the model used. Additionally, LCOE values from other countries in the region are discussed. In the Middle East, solar PV LCOE has reached an impressively low value of $0.03/kWh, primarily due to substantial government support, investments, and incentives. The reduction of import taxes has also significantly lowered the overall CAPEX for solar projects in this region. On the other hand, India is also making considerable investments in renewable technologies and has achieved a competitive LCOE; however, it still faces challenges related to land acquisition and achieving grid parity. Conversely, many Asia–Pacific countries experience higher LCOE values due to less favorable solar resources.
| References | Location | Reported LCOE ($/kWh) | Present study LCOE ($/kWh) |
|---|---|---|---|
| Xu et al. [69] | Sindh, Pakistan | 0.039 | 0.04–0.06 |
| Khosa et al. [70] | Quaid-e-Azam Solar Plant, Bahawalpur, Pakistan | 0.0795 | 0.059 |
| Zubair et al. [71] | Multan, Pakistan | 0.086 | 0.061 |
| Chauhan and Wason [72] | Punjab, Pakistan | 0.05–0.07 | 0.05–0.08 |
| Ahmad et al. [73] | Sargodha, Pakistan | 0.085 | 0.077 |
| Zubair et al. [71] | Karachi, Pakistan | 0.062 | 0.056 |
| Zubair et al. [71] | Gwadar, Pakistan | 0.052 | 0.056 |
| Ahmad et al. [73] | Lahore, Pakistan | 0.093 | 0.064 |
| Other countries | — | — | |
| Apostoleris et al. [74] | Saudi Arabia | 0.03 | — |
| IRENA [75] | Middle East | 0.03–0.05 | — |
| Deshmukh et al. [76] | India | 0.047–0.052 | — |
| Haffaf et al. [77] | Algeria | 0.0655 | — |
| Al Matin and Tanaka [78] | Malaysia | 0.113 | — |
| Pillai and Naser [79] | Bahrain | 0.0423 | — |
| Al Matin and Tanaka [78] | Indonesia | 0.112 | — |
- Note: A range is provided when the studies encompass multiple locations.
If Pakistan can develop strategies to reduce the capital investments required for solar plants, it has the potential to attain one of the lowest LCOE figures in the region [69]. This achievement would significantly contribute to meeting its renewable energy targets.
3.4. LCA of Solar Energy and Current Pakistan’s Energy Mix
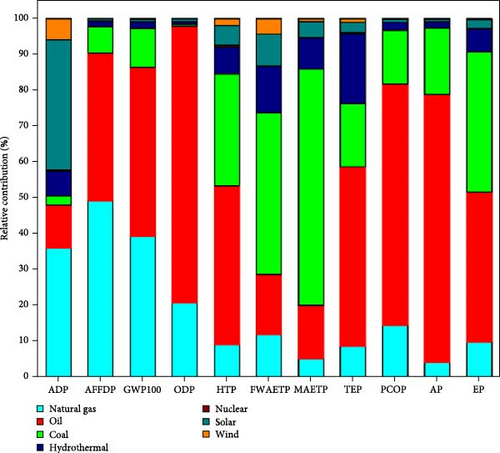
Figure 9 shows the environmental impact (relative contribution) of various energy sources in Pakistan’s energy mix. Table 6 details the scores for each environmental indicator. The results clearly show that the country’s heavy reliance on natural gas, coal, and oil is the main cause of environmental burden. In contrast, hydrothermal, nuclear, and renewable energy sources have minimal environmental impact. The combustion of fossil fuels releases harmful gases that significantly contribute to global warming, ozone layer depletion, and acidification. These emissions not only lead to acid rain but also degrade air quality, adversely affecting both the environment and human health. In recent years, regions in Pakistan have experienced smog that envelops major cities during November and December, causing respiratory issues and disrupting daily activities [80].
| Impact category | Unit | Total | Natural gas | Oil | Coal | HT | Nuclear | Solar | Wind |
|---|---|---|---|---|---|---|---|---|---|
| ADP | kg Sb eq | 5.7E−07 | 2.2E−07 | 7.2E−08 | 1.5E−08 | 5.3E−09 | 2.1E−09 | 2.2E−07 | 3.5E−08 |
| AFFDP | MJ | 7.8E+00 | 3.9E+00 | 3.3E+00 | 5.9E−01 | 6.4E−03 | 8.8E−04 | 4.4E−02 | 8.2E−03 |
| GWP100 | kg CO2 eq | 5.5E−01 | 2.2E−01 | 2.6E−01 | 6.0E−02 | 7.4E−04 | 7.5E−05 | 3.8E−03 | 7.2E−04 |
| ODP | kg CFC-11 eq | 5.5E−08 | 1.2E−08 | 4.3E−08 | 2.8E−10 | 4.6E−11 | 7.8E−12 | 4.5E−10 | 4.9E−11 |
| HTP | kg 1,4-DB eq | 1.1E−01 | 1.1E−02 | 5.4E−02 | 3.8E−02 | 9.3E−04 | 6.6E−04 | 6.7E−03 | 2.4E−03 |
| FWAETP | kg 1,4-DB eq | 6.4E−02 | 8.6E−03 | 1.2E−02 | 3.3E−02 | 7.6E−04 | 2.0E−04 | 6.3E−03 | 3.2E−03 |
| MAETP | kg 1,4-DB eq | 2.3E+02 | 1.3E+01 | 3.7E+01 | 1.6E+02 | 9.7E−01 | 3.7E−01 | 1.1E+01 | 2.4E+00 |
| TEP | kg 1,4-DB eq | 2.9E−04 | 3.1E−05 | 1.8E−04 | 6.4E−05 | 1.8E−06 | 9.4E−07 | 1.1E−05 | 3.7E−06 |
| PCOP | kg C2H4 eq | 1.2E−04 | 1.8E−05 | 8.3E−05 | 1.8E−05 | 1.6E−07 | 2.3E−08 | 1.2E−06 | 2.5E−07 |
| AP | kg SO2 eq | 2.9E−03 | 1.2E−04 | 2.2E−03 | 5.5E−04 | 2.8E−06 | 4.9E−07 | 2.1E−05 | 3.7E−06 |
| EP | kg PO4--- eq | 3.3E−04 | 3.4E−05 | 1.5E−04 | 1.4E−04 | 9.5E−07 | 4.0E−07 | 8.2E−06 | 1.5E−06 |
- Abbreviations: ADP, abiotic depletion potential; AFFDP, fossil fuel depletion potential; AP, acidification potential; EP, eutrophication potential; FWAETP, freshwater aquatic ecotoxicity potential; GWP, global warming potential 100 years; HT, hydrothermal; HTP, human toxicity potential; MAETP, marine aquatic ecotoxicity potential; ODP, ozone depletion potential; PCOP, photochemical oxidation potential; TEP, terrestrial ecotoxicity potential.
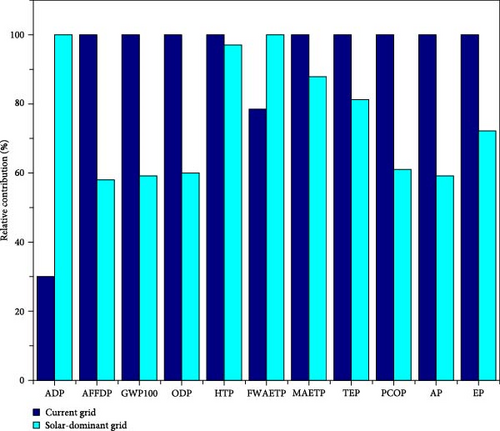
Figure 10 compares the LCA of a solar-dominant grid with the current grid system. Table 7 summarizes the scores for each environmental indicator for both grids. The findings indicate that solar power outperforms conventional grid power in several environmental aspects. For instance, the solar-dominant grid demonstrates reductions in abiotic fossil fuel depletion potential, global warming potential, and ozone depletion potential, which are 1.72, 1.69, and 1.67 times lower, respectively, than the current grid. The acidification potential of the conventional grid is also 1.68 times higher than that of the solar-dominant grid. These improvements suggest that integrating solar energy into the energy mix could significantly enhance multiple environmental indicators.
| Impact category | Unit | Solar-powered grid | Current grid |
|---|---|---|---|
| ADP | kg Sb eq | 1.9E−06 | 5.7E−07 |
| AFFDP | MJ | 4.5E+00 | 7.8E+00 |
| GWP100 | kg CO2 eq | 3.3E−01 | 5.5E−01 |
| ODP | kg CFC-11 eq | 3.3E−08 | 5.5E−08 |
| HTP | kg 1,4-DB eq | 1.1E−01 | 1.1E−01 |
| FWAETP | kg 1,4-DB eq | 8.1E−02 | 6.4E−02 |
| MAETP | kg 1,4-DB eq | 2.0E+02 | 2.3E+02 |
| TEP | kg 1,4-DB eq | 2.4E−04 | 2.9E−04 |
| PCOP | kg C2H4 eq | 7.4E−05 | 1.2E−04 |
| AP | kg SO2 eq | 1.7E−03 | 2.9E−03 |
| EP | kg PO4--- eq | 2.4E−04 | 3.3E−04 |
- Abbreviations: ADP, abiotic depletion potential; AFFDP, fossil fuel depletion potential; AP, acidification potential; EP, eutrophication potential; FWAETP, freshwater aquatic ecotoxicity potential; GWP, global warming potential 100 years; HT, hydrothermal; HTP, human toxicity potential; MAETP, marine aquatic ecotoxicity potential; ODP, ozone depletion potential; PCOP, photochemical oxidation potential; TEP, terrestrial ecotoxicity potential.
Despite the benefits of using solar power, some indicators—such as abiotic depletion potential and freshwater aquatic ecotoxicity potential—are worse for solar energy than for the conventional grid (Figure 10). The production of solar panels requires high-temperature melting of silica, often powered by coal-fired electricity, which has negative environmental impacts [81]. Additionally, manufacturing silicon wafers involves chemicals like silicon tetrachloride, hydrogen fluoride, and methylamine. Improper handling of silicon tetrachloride can cause skin burns, air pollution, and hydrochloric acid emissions when exposed to water, while hydrogen fluoride and methylamine contribute to ozone depletion [82]. The production of inverters (which use copper), mounting systems (which use aluminum and steel), and electrical installations also adds to the environmental impact. Therefore, it is important to consider the material requirements and associated environmental consequences when planning large-scale solar installations.
Recycling solar panels at the end of their life cycle offers a solution to reduce emissions and environmental impact. By recycling materials like glass and silicon wafers, the need for raw materials and energy-intensive manufacturing can be reduced, lowering the carbon footprint of solar panel production. With a recycling rate of 42%, panels can be processed locally and repurposed effectively [83, 84]. This can save energy, reduce waste, and contribute to a more sustainable solar industry. In addition to promoting recycling, selecting appropriate installation sites to avoid critical habitats can help minimize ecological disruption. Implementing rainwater harvesting for cleaning solar panels can also reduce the reliance on freshwater resources.
4. Policy Implications
Recognizing the potential of solar energy in addressing Pakistan’s energy crisis, the government has implemented policies and incentives to boost the solar industry. The net metering policy allows individuals and businesses to sell excess solar power back to the grid, making solar investments more attractive. Tax incentives, subsidies, and low-interest financing schemes have also been introduced. However, inconsistent government policies have resulted in fluctuating net metering tariffs and loan schemes, undermining investor confidence. To build trust, the government must ensure policy stability and consistency.
The main challenge for solar project implementation is the initial investment, which varies depending on the installation site. In less developed areas, costs may be higher due to limited labor availability and increased transportation expenses. Divisional level policies are needed to address these challenges by considering each area’s specific characteristics.
The optimal deployment of large-scale solar plants requires careful location selection. Given the need for extensive open land, the government should identify suitable areas and offer land on favorable lease terms to attract investors. In densely populated provinces like Punjab, Sindh, and KPK, where agricultural land is prevalent, rooftop solar installations on commercial buildings, schools, and universities should be encouraged. Programs offering low-interest loans can help low-income communities afford solar installations.
In Balochistan and Gilgit-Baltistan, where land availability is not an issue, grid infrastructure limitations pose significant challenges. Rural electrification programs and investments in solar parks can help harness the regions’ solar potential. These areas can produce environmentally friendly fuels like hydrogen and methanol, which can be transported to industrial zones. Additionally, raising public awareness and providing training on solar technology maintenance are essential for widespread adoption. Large-scale solar projects can also create numerous job opportunities.
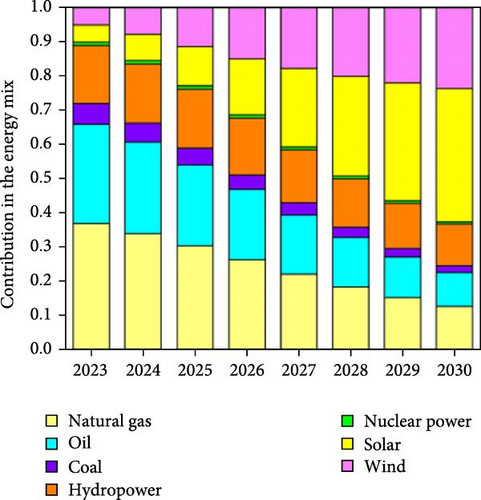
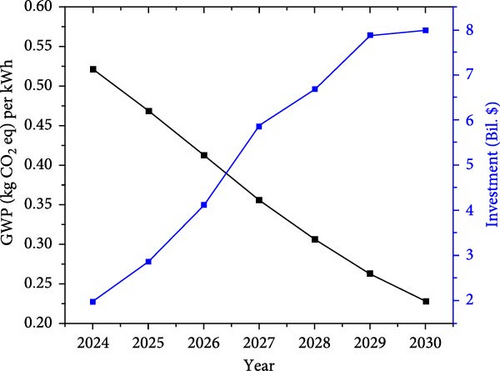
To meet renewable energy targets and align with the Paris Agreement, Pakistan must gradually integrate solar energy into its primary energy mix. Figure 11A shows the projected energy mix until 2030, with a balanced approach aimed at reducing CO2 emissions while managing budget constraints for renewable expansion. By 2030, a 48% reduction in fossil fuel use will be necessary, with solar and wind energy serving as viable alternatives. This transition is expected to significantly cut CO2 emissions by up to 58% (Figure 11B). Achieving this shift will require substantial investment in renewable infrastructure, with an estimated $37.5 billion over the next 7 years. Further studies on location-specific solar potential, considering technical, social, and economic factors, are recommended to provide a realistic overview and attract private investment.
5. Conclusion
A data-driven optimization framework that considers techno-economic, environmental, and planning-related decisions is presented to enhance the implementation of green energy and reduce reliance on fossil fuels. The developed model can simultaneously evaluate multiple locations (up to millions), enabling a nationwide analysis to support optimal decision-making regarding the installation of solar parks at minimum costs. The model can also determine an optimal energy mix for the country in the coming years, meeting local energy demands and budget constraints sustainably, with the overall objective of achieving maximum carbon neutrality. Additionally, cradle-to-gate LCA is presented to evaluate and compare the environmental impact of solar-dominant grid with the current grid across 11 environmental indicators. This adaptable framework can be utilized in any country by considering factors such as solar insolation data, the current energy mix, and renewable energy targets. It identifies optimal sites for solar installations, evaluates environmental impacts, and determines the best energy mix to meet demand and budget constraints, thereby aiding in the development of effective strategies to achieve renewable energy goals.
The developed framework was assessed in Pakistan across 150 diverse locations. The results indicate that to enhance the proportion of solar energy in the overall energy mix, it is necessary to establish expansive solar facilities throughout the region. It is estimated that an investment of $37.5 billion over a span of 7 years will be required to increase the contribution of renewable resources such as solar and wind from 10% to 55%. This transition would result in an overall reduction of CO2 emissions by 56%. The TEA indicates that the LCOE in the region ranges from $0.04/kWh to $0.081/kWh based on the current CAPEX of solar PV in Pakistan. Nevertheless, the considerable land area necessary for these plants poses practical challenges, particularly in densely populated divisions. When land costs are included, the LCOE range for the country increases from $0.068/kWh to $0.124/kWh. To reduce land costs, it is recommended that the government provides installation sites.
LCA indicates that the adoption of a solar-dominant grid leads to a reduction of 1.69 times in CO2 emissions compared to the current grid. The current grid also exhibits significantly higher potential for ozone depletion, and acidification.
The overall environmental impact of solar energy remains significantly lower than that of the fossil-based grid. The study’s findings suggest that harnessing Pakistan’s solar potential is the key to meeting the country’s renewable energy targets while addressing the energy crisis. Implementing divisional-level policies that incorporate strategies to mitigate environmental impact is crucial to instill confidence among potential investors in this field.
Nomenclature
-
- PV:
-
- Photovoltaic
-
- LCOE:
-
- Levelized cost of energy
-
- GHG:
-
- Greenhouse gas
-
- MINLP:
-
- Mixed integer nonlinear programming
-
- GHI:
-
- Global horizontal irradiance
-
- DHI:
-
- Global diffuse irradiance
-
- GAMS:
-
- General algebraic modeling system
-
- TEA:
-
- Techno-economic analysis
-
- LCA:
-
- Life cycle analysis
-
- CAPEX:
-
- Capital expenditure
-
- OPEX:
-
- Operating costs
-
- ROROI:
-
- Rate of return on investment
-
- NPV:
-
- Net present value
-
- NLP:
-
- Nonlinear programming
-
- GWP:
-
- Global warming potential.
Conflicts of Interest
The authors declare no conflicts of interest.
Author Contributions
Abiha Abbas: conceptualization, methodology, data curation, software, visualization, investigation, writing–original draft, reviewing and editing. Mohammad Ansub Khan: conceptualization, methodology, data curation, visualization. Nauman Ahmad Zaffar: conceptualization, methodology, discussions. Muhammad Mustafa Tahir: reviewing and editing, visualization. Ali Rauf: reviewing and editing, visualization, discussions. Rofice Dickson: supervision, funding acquisition, conceptualization, methodology, software, validation, reviewing and editing.
Funding
This work was supported by the National Research Program for Universities (NRPU), Research and Development Division, Higher Education Commission of Pakistan (20-14827/NRPU/R&D/HEC/2021).
Acknowledgments
This work was supported by the National Research Program for Universities (NRPU), Research and Development Division, Higher Education Commission of Pakistan (20-14827/NRPU/R&D/HEC/2021). During the preparation of this work, the authors used ChatGPT-4o in order to improve the readability and language of the manuscript. After using this tool, the authors reviewed and edited the content as needed and take full responsibility for the content of the published article.
Supporting Information
Additional supporting information can be found online in the Supporting Information section.
Open Research
Data Availability Statement
The data supporting this article are included in the Supporting Information.


