Machine Learning-Based Signature for Predicting Prognosis and Drug Sensitivity in Ovarian Cancer With Macrophage M2-Related Genes
Abstract
Background: Ovarian cancer is the third most prevalent gynecological malignancy globally. M2 macrophages play crucial roles in promoting angiogenesis, cancer cell proliferation, metastasis, and immunosuppression.
Methods: We identified markers associated with M2 macrophages using weighted gene co-expression network analysis. A machine learning approach, encompassing ten algorithms, was employed to construct a macrophage M2-related signature (MRS) based on data from TCGA, GSE14764, and GSE140082 datasets. The predictive value of MRS for immunotherapy response was assessed using immunophenoscore, TIDE score, tumor mutational burden (TMB) score, and immune escape score.
Results: The optimal MRS, developed using the lasso algorithm, emerged as an independent risk factor and demonstrated robust performance in predicting overall survival in ovarian cancer patients. The C-index of our MRS surpassed that of clinical stage, tumor grade, and several established prognostic signatures. Patients with lower risk score exhibited higher ESTIMATE score, increased levels of immune cells, elevated PDI and CTLA4 immunophenoscore, higher TMB score, lower TIDE score, reduced immune escape score, and decreased IC50 values for certain drugs. The nomogram for survival prediction showed significant potential for clinical application in forecasting 1-, 3-, and 5-year overall survival rates in ovarian cancer patients.
Conclusion: Our study developed a stable MRS for ovarian cancer, which serves as a valuable indicator for predicting prognosis and drug sensitivity in this disease. Further prospective studies should be performed to further explore the role of MRS in predicting the clinical outcome and immunotherapy benefits of ovarian cancer patients.
Trial Registration: ClinicalTrials.gov identifier: NCT02108652
1. Introduction
Ovarian cancer is the third most prevalent gynecological malignancy globally and is associated with the highest mortality rate among gynecologic cancers [1]. Evidences show that ovarian cancer takes 140,000 lives each year globally [2]. Due to the lack of effective screening methods and clear early clinical symptoms, the majority of patients are already in an advanced stage at the time of their initial diagnosis with ovarian cancer [3]. Nearly all ovarian cancer patients will experience a recurrence of the disease, and the management available to treat recurrent disease are few and little effect [1]. Less than 50% of ovarian cancer patients living > 5 years following diagnosis, which may be caused by high rate of tumor recurrence and metastasis and drug resistance [4]. Immunotherapy is considered as one of the most promising means for treating tumors, especially for advanced tumors [5]. However, data about ovarian cancer response to immunotherapy is limited [6]. The utility of current clinical markers, such as CA125 and HE4, in predicting patient prognosis is still a matter of debate. Therefore, there is a need for further research to identify novel biomarkers that can effectively predict both the prognosis and the potential benefits of immunotherapy for ovarian cancer patients.
The interaction between cancer cells and the tumor immune microenvironment (TME) is crucial for tumor progression, metastasis, and drug resistance, including in ovarian cancer [7]. Macrophages, a key component of the TME, play critical roles in regulating angiogenesis, extracellular matrix remodeling, cancer cell proliferation, metastasis, and immunosuppression [8]. Macrophages can be classified into two functionally distinct subtypes: M1 macrophages and M2 macrophages [9]. It is generally believed that in the initial stage of tumor, M1 dominates and plays an anti-tumor role by mediating immune responses [10]. With the progression of the tumor, the proportion of M2 increases and promotes the vascular invasion and metastasis of the tumor [11, 12]. The ratio of M2 to M1 macrophages is significantly associated with tumor progression, clinical outcomes, and the benefits of immunotherapy in patients [13–15]. Therefore, investigating the role of M2 macrophages in the prognosis and immunotherapy response of ovarian cancer is essential.
In this study, we developed a prognostic macrophage M2-related signature (MRS) using ten machine learning algorithms across three independent public datasets. Additionally, we assessed the potential of MRS in predicting clinical outcomes and immunotherapy benefits in ovarian cancer. Our findings may offer new options for biomarkers in ovarian cancer prognosis and treatment response.
2. Materials and Methods
2.1. Datasets Acquisition and Processing
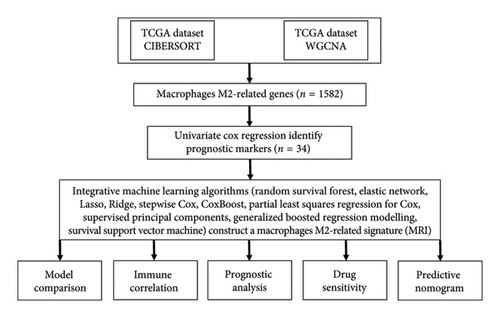
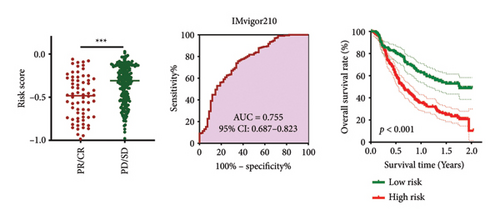
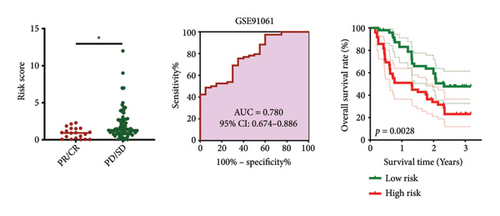
We followed the methods of Dianqian Wang and Lipeng Pei et al. 2023 [16, 17]. Figure 1 illustrates the workflow of our study. Bulk RNA-seq data and genomic mutation data for ovarian cancer (n = 375) were obtained from The Cancer Genome Atlas (TCGA) database (https://portal.gdc.cancer.gov/). Two additional GEO datasets, GSE14764 (n = 80) and GSE140082 (n = 380), were utilized as validation sets. IMvigor210, a Phase 2 study targeting PD-L1/PD-1 in metastatic urothelial carcinoma, enrolled 298 patients received one or more doses of atezolizumab (68 responders and 230 nonresponders) [18]. GSE91061 contained 58 RNA-Seq samples of advanced melanoma received ipilimumab (CA209-038 study, 16 responders and 42 nonresponders) [19]. In these studies, responders were defined as patients achieving a complete response (CR) or partial response (PR), while nonresponders were classified as those with progressive disease (PD) or stable disease (SD). IMvigor210 and GSE91061 were used to explore the predictive value of MRS in predicting immunotherapy benefits.
2.2. CIBERSORT and Weighted Gene Co-Expression Network Analysis (WGCNA)
The CIBERSORT algorithm was employed to estimate the abundance of cell types and gene expression from the RNA-seq data of the TCGA ovarian cancer dataset [20]. Following the quantification of M2 macrophage abundance, we conducted WGCNA to identify gene sets associated with M2 macrophages. WGCNA is a robust method for pinpointing gene sets of interest from large and diverse gene pools, facilitating correlation analysis with specific phenotypes [21]. In this analysis, the β value was set to 0.9 during network construction to minimize weak correlations between genes in the adjacency matrix. To identify the most representative genes, module eigengenes (MEs), we used a Pearson’s correlation coefficient threshold of 0.25. Genes within modules that showed significant positive correlations (Cor > 0.3, p < 0.001) with M2 macrophages were designated as M2 macrophage-related genes. This approach ensured the selection of gene sets strongly associated with M2 macrophages, providing a solid foundation for further analysis.
2.3. Machine Learning-Based MRS
- 1.
Univariate Cox Regression Analysis: We performed univariate Cox regression on the TCGA dataset to identify potential prognostic biomarkers.
- 2.
Machine Learning Integration: The identified biomarkers were then subjected to an integrative machine learning process using a leave-one-out cross-validation (LOOCV) framework within the TCGA dataset to generate signatures.
- 3.
Validation in External Cohorts: All generated models were validated in two independent GEO cohorts.
- 4.
Model Evaluation: For each model, Harrell’s concordance index (C-index) was calculated across all TCGA and GEO datasets. The model with the highest average C-index was selected as the optimal MRS. Similar machine learning algorithms could be seen in previous studies [22–26]. Detailed parameter tuning information for the R scripts used in this study is available on our GitHub repository (https://github.com/Zaoqu-Liu/IRLS).
2.4. Evaluation of the Performance of MRS
Ovarian cancer cases were divided into two groups—high-risk and low-risk—based on the median value of the risk score. Using the “survival” package, we generated overall survival (OS) curves. To assess the predictive value of the MRS for clinical outcomes in ovarian cancer, we constructed time-dependent ROC curves and clinical ROC curves using the “timeROC” package. We collected a total of 55 prognostic models, including both mRNA and lncRNA-related models, and calculated their C-indexes using the “CompareC” package. Univariate and multivariate Cox regression analyses were performed to identify significant prognostic risk factors in ovarian cancer. Additionally, we developed a nomogram based on the MRS and clinical characteristics using the R packages “rms” “nomogramEx” and “regplot” This nomogram integrates these factors to provide a comprehensive prediction tool for ovarian cancer prognosis.
2.5. TME and Genetic Mutation Landscape
The ESTIMATE algorithm was employed to calculate the immune microenvironment score for each ovarian cancer case. The infiltration levels of immune cells were quantified using the “immunedeconv” R package, which estimates immune cell fractions from bulk RNA-sequencing data through seven computational methods: CIBERSORT, MCPcounter, QUANTISEQ, XCELL, CIBERSORT-ABS, TIMER, and EPIC [27]. To investigate the biological functions associated with the high-risk and low-risk groups, we conducted Gene Set Enrichment Analysis (GSEA). Additionally, we utilized the “maftools” package to generate a waterfall plot of single nucleotide variants (SNVs).
2.6. Evaluation of the Performance of MRS in Predicting Drug Sensitivity
The immunophenoscore (IPS) and TIDE score for each ovarian cancer patient were retrieved from The Cancer Immunome Atlas (TCIA, https://tcia.at/home) and the TIDE platform (https://tide.dfci.harvard.edu), respectively. Using the gene expression data and corresponding coefficients of the MRS, we calculated the risk score for each patient in the IMvigor210 and GSE91061 cohorts. This allowed us to investigate the correlation between the risk score and immunotherapy response. To further analyze drug sensitivity, we utilized data from the Genomics of Drug Sensitivity in Cancer (GDSC) database (https://www.cancerrxgene.org/). We then calculated the half-maximal inhibitory concentration (IC50) values for common chemotherapy and targeted drugs using the “oncoPredict” package.
2.7. Statistical Analysis
Statistical analyses were conducted using R software (version 4.2.1). For comparing continuous variables, we employed the Wilcoxon rank-sum test or Student’s t-test, as appropriate. The correlations between two continuous variables were assessed using Spearman’s rank correlation analysis. To evaluate differences in Kaplan–Meier survival curves, we applied the two-sided log-rank test. Nomogram was tested by proportional hazard assumption.
3. Results
3.1. WGCNA Identified Macrophage M2-Related Genes in Ovarian Cancer
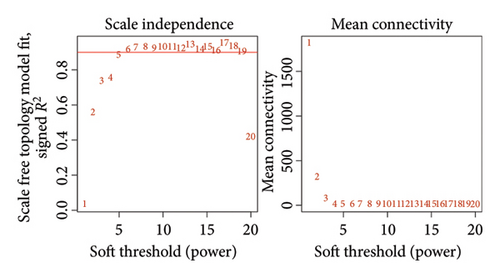
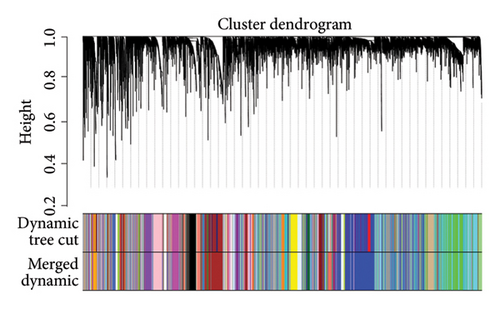
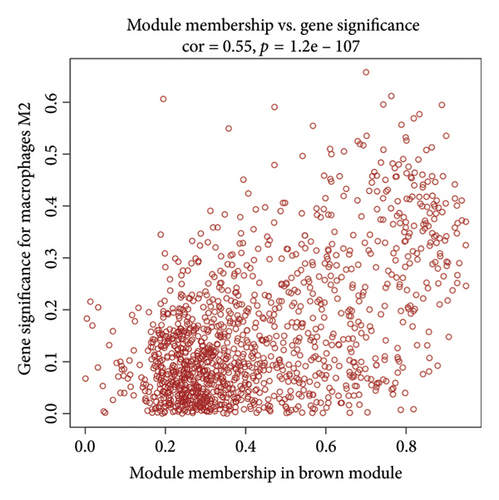
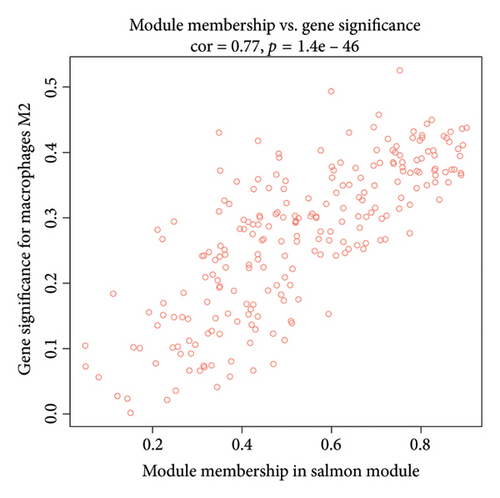
We determined the optimal soft-threshold power to be 5 by setting the β value for the degree of independence at 0.9 (Figure 2(a)). The clustering tree of the 80 differentially colored modules is presented in Figure 2(b). Supporting Figure 1 showed the association between modules and immune cells. In order to find more macrophage M2-related genes, we selected the top two most significant modules for further analysis, including brown module (correlation = 0.34, p = 2e − 11) and salmon (correlation = 0.43, p = 1e − 18) module. The correlation coefficient between gene significance (GS) and module membership (MM) was 0.55 for the brown module and 0.77 for the salmon module, respectively (Figures 2(c) and 2(d)). Both the brown and salmon modules collectively encompassed 1582 macrophage-related genes (Supporting Table 1).
3.2. Integrative Machine Learning Algorithms Constructed a Prognostic MRS
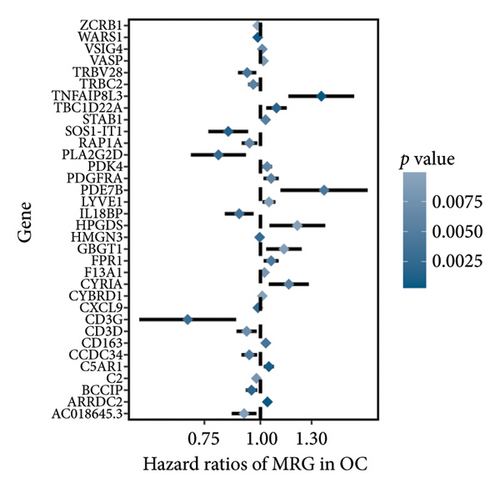
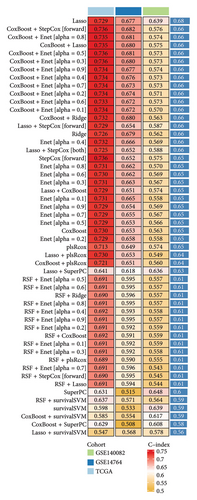
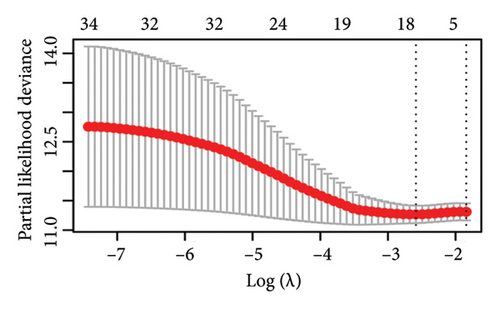
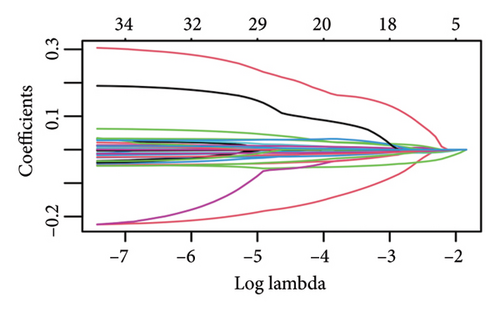
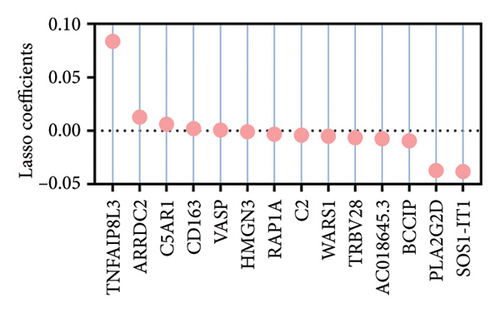
The 1582 macrophage-related genes were subjected to univariate Cox analysis, yielding 34 potential prognostic biomarkers (Figure 3(a), p < 0.05). These 34 biomarkers were then processed through a machine learning-based integrative procedure to develop an accurate and stable prognostic MRS. This resulted in the generation of 52 prognostic models (Figure 3(b)). Figure 3(b) displays the C-index of each model across the TCGA, GSE14764, and GSE140082 cohorts. The Lasso method-produced model was selected as the optimal MRS due to its highest average C-index of 0.68 (Figure 3(b)). In the Lasso regression, the optimal λ was determined when the partial likelihood deviance reached its minimum value using the LOOCV framework (Figures 3(c) and 3(d)). Ultimately, 14 macrophage-related genes were included in the MRS based on the Lasso method (Figures 3(c) and 3(d)). The coefficient of each candidate gene in MRS are shown Figure 3(e). Based on the coefficients of each gene and their expression pattern, the risk score of each ovarian cancer case was calculated as follows: risk score = (−0.0371) × PLA2G2Dexp + (−0.0381) × SOS1-IT1exp + 0.19 × HMGN3exp + (−0.0033) × RAP1Aexp + (0.0127) × ARRDC2exp + (−0.0093) × BCCIPexp + 0.0060 × C5AR1exp + (−0.0074) × AC018645.3exp + 0.0006 × VASPexp + 0.0838 × TNFAIP8L3exp + (−0.0063) × TRBV28exp + (−0.0051) × WARS1exp + (−0.0042) × C2exp + (0.0020) × CD163exp. Ovarian cancer patients were divided into two groups—high-risk and low-risk—using the median value of the risk score as the cutoff.
3.3. Evaluation of the Performance of MRS
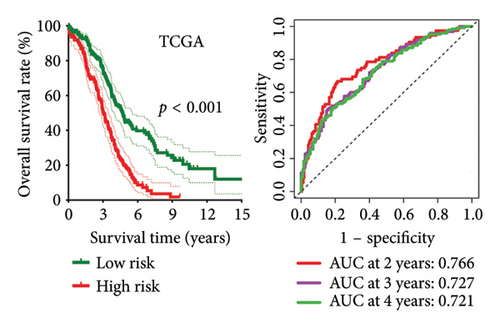
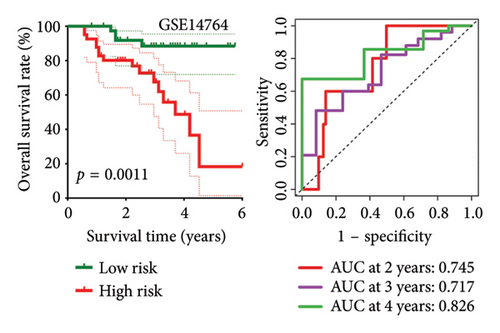
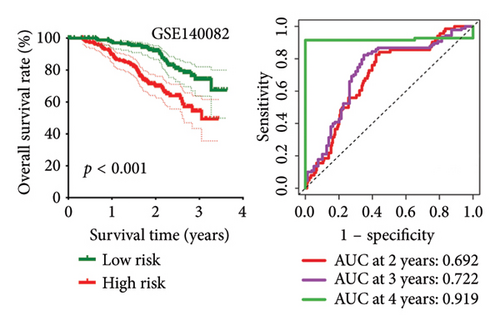
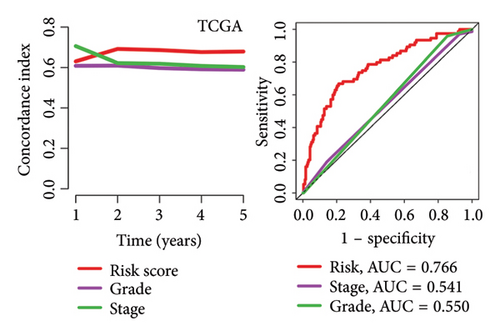
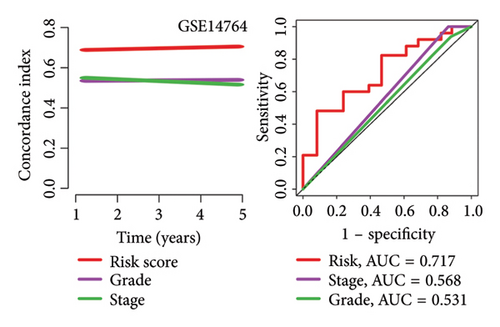
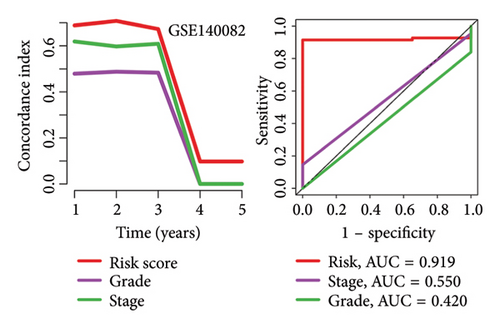
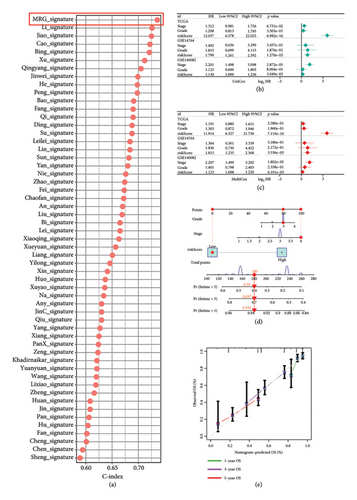
High risk score indicated lower OS rate in ovarian cancer patients and the AUCs of 2-, 3-, and 4-year ROC curve were 0.766, 0.727 and 0.721 in TCGA cohort (Figure 4(a)), 0.745, 0.717 and 0.826 in GSE14764 cohort (Figure 4(b)), and 0.692, 0.722 and 0.919 in GSE140082 cohort (Figure 4(c)), respectively. The C-index and AUC value of the risk score regarding the MRS in predicting OS rate was higher than that of grade and stage in the TCGA, GSE14764, and GSE140082 cohort, as Figures 4(d), 4(e), 4(f) illustrates. We next gathered 55 prognostic signatures (Supporting Table 2) and determined their C-index because numerous prognostic signatures had been produced for ovarian cancer. Interestingly, our MRS’s C-index outperformed all of these prognostic indicators for ovarian cancer (Figure 5(a)), indicating that it performed well in predicting the OS of ovarian cancer patients. In the TCGA, GSE14764, and GSE140082 cohort, univariate and multivariate Cox regression analysis similarly indicated that the MRS-based risk score was an independent risk factor for ovarian cancer (Figures 5(b) and 5(c)). Next, taking into account MRS, stage, and grade, we created a survival prediction nomogram (Figure 5(d)). According to the findings, the calibration curves had a rather good predictive value for the OS rate over the next one, three, and 5 years (Figure 5(e)).
3.4. The Correlation Between MRS and TME in Ovarian Cancer
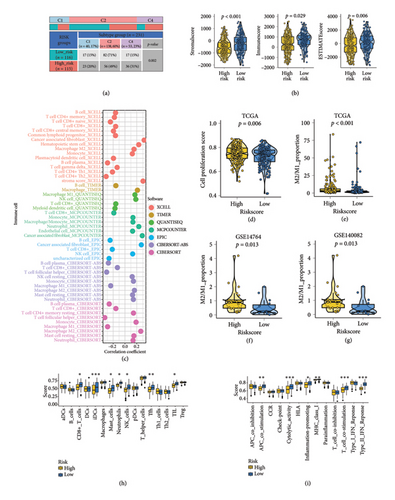
As illustrated in Figure 6(a), the IFN-γ dominant subtype (C2) was more prevalent in the low-risk group compared to the high-risk group, while the lymphocyte-depleted subtype (C4) was less common in the low-risk group (p = 0.002). Patients with low risk score exhibited higher ESTIMATE scores, immune scores, and stromal scores in ovarian cancer (Figure 6(b), all p < 0.05). Figure 6(c) highlights the significant correlation between the risk score and immune cell infiltration (p < 0.05). Further analysis revealed that patients with high risk score had elevated cell proliferation scores (Figure 6(d)) and a higher proportion of M2/M1 macrophages in the TCGA, GSE14764, and GSE140082 cohorts (Figures 6(e), 6(f), 6(g)). These findings suggest a greater likelihood of tumor progression in high-risk ovarian cancer patients.
3.5. MRS-Based Treatment Strategy for Ovarian Cancer
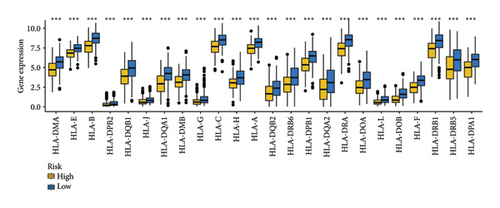
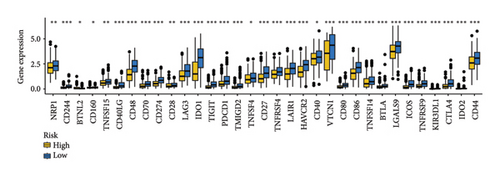
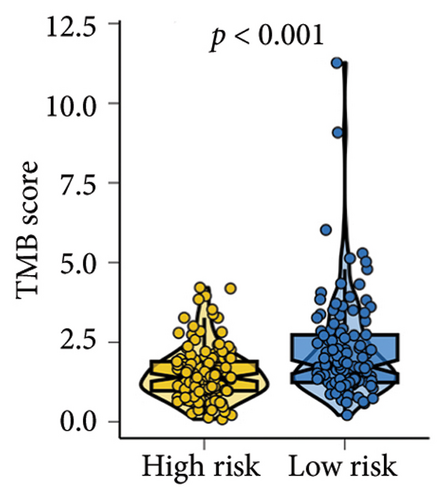
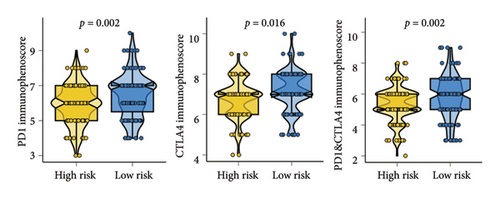
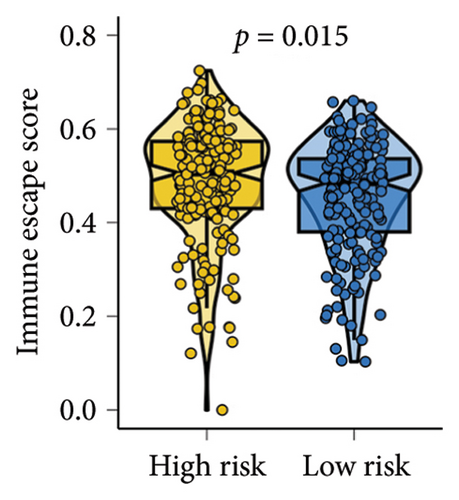
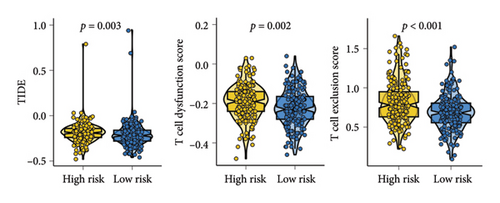
As shown in Figures 7(a) and 7(b), patients with low risk score exhibited higher expression levels of immune checkpoint and HLA-related genes in ovarian cancer (p < 0.05). Further analysis revealed that low-risk cases had significantly higher TMB scores, as well as elevated CTLA4 IPS, PD1 IPS, and combined CTLA4/PD1 IPS scores (Figures 7(c) and 7(d), p < 0.05). Conversely, high-risk patients were associated with higher immune escape scores, TIDE scores, and increased T cell dysfunction and exclusion (Figures 7(e) and 7(f), p < 0.05). These findings suggest that low-risk ovarian cancer patients may have a better response to immunotherapy. In the IMvigor210 cohort, nonresponders had significantly higher risk scores compared to responders (Figure 8(a), p < 0.001), with an AUC of 0.755 (Figure 8(b)). Additionally, a high risk score was linked to lower OS rates (Figure 8(a), p < 0.001). In the GSE91061 dataset, responders had significantly lower risk scores compared to nonresponders (Figure 8(b), p < 0.05), with an AUC of 0.780 (Figure 8(b)). High-risk scores were also associated with poorer OS rates (Figure 8(b), p = 0.0028). We further evaluated the differences in IC50 values of common drugs between different risk groups. As illustrated in Figures 9(a) and 9(b), low-risk ovarian cancer patients showed lower IC50 values for several chemotherapeutic agents, including 5-Fluorouracil, Cisplatin, Cyclophosphamide, Docetaxel, Paclitaxel, Crizotinib, Foretinib, KRAS Inhibitor-12, Lapatinib, and Nilotinib (all p < 0.05). This suggests that low-risk patients may be more sensitive to these treatments.


4. Discussion
In this study, we developed an optimal MRS using an integrative machine learning approach that incorporated 10 different algorithms. The MRS emerged as an independent risk factor for ovarian cancer and demonstrated robust performance in predicting patient prognosis. Further analysis revealed that patients with a low risk score exhibited higher TME scores, increased levels of immune cell infiltration, elevated IPS, and greater tumor mutational burden (TMB). Additionally, these patients had lower TIDE scores and reduced IC50 values for various drugs. These findings suggest that individuals with a low risk score are more likely to benefit from immunotherapy.
The MRS was developed using 14 macrophages-related genes (PLA2G2D, SOS1-IT1, HMGN3, RAP1A, ARRDC2, BCCIP, C5AR1, AC018645.3, VASP, TNFAIP8L3, TRBV28, WARS1, C2, CD163). Previous study showed that RAP1A accelerated tumor metastasis via ERK/p38 and notch signaling in ovarian cancer [28]. ARRDC2 was suggested as a potential indicator for predicting the prognosis and immune microenvironment in ovarian cancer [29]. Human INO80/YY1 chromatin could remodel complex transcriptionally by regulating BCCIP in cells [30]. The ribosomal protein S19 inhibited antitumor immune responses by regulating C5AR1 in ovarian cancer [31].
Previous studies had developed many prognostic signatures for ovarian cancer. Liu et al. developed an immune-related gene signature for ovarian cancer [32]. Moreover, the pyroptosis-related lncRNAs signature serve as a biomarker for prognoses and immunotherapy benefit in uterine corpus endometrial carcinoma [33]. Another study also found that m1A methylation modification made an essential function in the prognosis of ovarian cancer patients and in shaping the immune microenvironment [34]. Exosome-associated gene signature also served as a prognostic biomarker for ovarian cancer patients [35]. Necroptosis-related modification patterns could also depict the clinical outcome of ovarian cancer patients [36].
One of the more promising cancer treatments was immunotherapy. Nivolumab and pembrolizumab, among other inti-PD-L1/PD1 medicines, have been approved for use as first-line cancer therapies [37–39]. There is currently little data regarding how immunotherapy affects ovarian cancer. In our investigation, we discovered that patients with low risk scores exhibited higher levels of immune cells, TME scores, IPS, TMBs, and HLA-related genes. They also had lower TIDE scores. A greater variety of antigen presentation, a higher chance of presenting more immunogenic antigens, and a higher chance of benefiting from immunotherapy were all suggested by high HLA-related gene expression [40]. Anti-CTLA-4 and anti-PD-1 antibody responses were better predicted by IPS, and a low IPS suggested a greater likelihood of immunological escape [41]. A lower TIDE score was associated with a greater immunotherapy benefit [42, 43]. TIDE was an indicator used to assess the benefits of immunotherapy. An improved response to immunotherapy was suggested by higher TMB [44]. Patients with low risk scores for ovarian cancer may therefore respond better to immunotherapy. Chemotherapy has been proposed as one of the most important treatments for ovarian cancer. In our research, patients with ovarian cancer who had a low risk score had lower IC50 values for 5-fluorouracil, Cisplatin, Cyclophosphamide, Docetaxel, Paclitaxel, Crizotinib, Foretinib, KRAS Inhibitor-12, Lapatinib, and Nilotinib. This suggests that patients with low risk ovarian cancer were highly responsive to chemotherapy and target therapy.
Our study has several limitations that should be acknowledged. The training and testing cohorts for the MRS were sourced from different databases, which, despite normalization efforts, may still introduce some heterogeneity. Additionally, the MRS has not been validated using an in-house clinical cohort, which would have provided stronger evidence for its applicability. To enhance the robustness of our findings, it would be beneficial to further validate the functions of the MRS genes through additional experiments in more cell lines. Future research could also delve deeper into the specific roles and underlying mechanisms of these MRS genes in ovarian cancer, providing a more comprehensive understanding of their impact on disease progression and prognosis. Addressing these limitations in subsequent studies will help solidify the reliability and clinical utility of the MRS as a prognostic tool for ovarian cancer patients.
5. Conclusion
Our study developed a stable MRS for ovarian cancer using 10 machine learning algorithms. The MRS acted as an indicator for predicting the prognosis and drug sensitivity in ovarian cancer. Further prospective studies should be performed to further explore the role of MRS in predicting the clinical outcome and immunotherapy benefits of ovarian cancer patients.
Ethics Statement
This study did not involve human participants or human material. The transcriptome data and clinical information were downloaded from the TCGA and GEO databases, which are publicly available. Therefore, this study did not require the approval of the local ethics committee. All methods were performed in accordance with the Declaration of Helsinki and relevant regulations.
Conflicts of Interest
The authors declare no conflicts of interest.
Author Contributions
Xianxi Liu, and Xinhua Huang: writing – original draft preparation, investigation.
Lifei Wang: methodology and supervision, reviewing, Ruiqian Liu: conceptualization, methodology, conceptualization, methodology.
Yang Liu: study design, reviewing.
Xianxi Liu and Xinhua Huang contributed equally to this study. All authors read and approved the final manuscript.
Funding
This study was funded by the Science and Technology Bureau of Deyang City (grant number: 2023SZZ011).
Acknowledgments
The authors have nothing to report.
Supporting Information
Additional supporting information can be found online in the Supporting Information section.
Open Research
Data Availability Statement
All relevant data are within the paper and its Supporting Information files.


