Individual and Joint Associations of Depression-Related Symptoms and Sleep Quality With Overall Survival Among Patients With Ovarian Cancer: Evidence From a Prospective Cohort Study
Abstract
Background: As the evidence linking depression and sleep quality to overall survival (OS) is lacking, we aim to evaluate the individual and joint associations of depression-related symptoms and sleep quality with OS among patients with ovarian cancer (OC).
Method: A total of 554 patients with OC were included. Depression-related symptoms and sleep quality were measured using the Patient Health Questionnaire (PHQ-9) and the Pittsburgh Sleep Quality Index (PSQI). The primary analysis utilized the average levels of depression-related symptoms and sleep quality by averages of PSQI score and PHQ score between pre-diagnosis and post-diagnosis. Deaths were ascertained until February 16, 2023, via medical records and active follow-up. Cox proportional hazard regression was used to estimate hazard ratios (HRs) and 95% confidence intervals (CIs) of the joint and individual associations of sleep quality and depression-related symptoms with OC survival.
Result: A total of 205 deaths occurred during a median follow-up of 44.6 months. The average level of depression-related symptoms and sleep quality were independently associated with OS (HRdepression vs. no depression = 1.55, 95% CI = 1.10–2.17; HRpoor sleep vs. good sleep = 2.05, 95% CI = 1.51–2.75). We documented multiplicative and additive interactions between these two factors in relation to OS (Pinteraction < 0.01; relative excess risk due to interaction = 0.16, 95% CI = 0.01–0.31). Combinations of depression-related symptoms and poor sleep quality were positively associated with OC mortality (HR = 2.61, 95% CI = 1.70–4.00), compared to patients with good sleep quality and without depression-related symptoms.
Conclusion: Poor OC survival was observed among patients with poor sleep quality and depression-related symptoms, independently and jointly.
1. Introduction
Ovarian cancer (OC) has emerged as a leading cause of death in gynecological malignancies, with 324,603 instances and 206,956 deaths reported globally in 2022 [1]. The majority of patients diagnosed with OC present with advanced-stage cancer and suffer from poor prognosis, with a survival rate of 5 years below 50% [2]. Although clinical factors, such as histological type, play a significant role in determining prognosis [2], they are challenging to alter, highlighting an urgent need to identify new modifiable factors that could enhance survival rates for patients with OC.
Depression is a mental illness defined by a persistent low mood and a diminished interest in activities, and its prevalence has been rising globally [3]. A meta-analysis conducted in 2020 quantified that depression might have an etiologic role and prognostic impact on cancer [4]. Moreover, a recent report in 2023 proposed that depression might influence OC outcomes by altering the tumor immune microenvironment, including increasing T cell exhaustion and reducing the number of antibody-producing B cells [5]. In addition to depression, sleep quality emerges as a significant factor affecting overall mortality [6]. Moreover, numerous studies have indicated that sleep characteristics, especially sleep disorders, were associated with both the incidence and prognosis of OC [6, 7].
Notably, the relationship between depression and sleep quality is complex. Several studies have revealed a bidirectional relationship between sleep quality and depression [8–10]. For example, a bidirectional Mendelian randomization study suggested that abnormal sleep patterns and sleep disorders might serve as indicators for depressive disorders [11]. In a study involving 17,732 individuals receiving psychological treatment, the results indicated that depressive symptoms might exert a greater influence on sleep than vice versa [12]. Moreover, decreased or increased sleep duration are considered as one of the depression criteria in classification systems such as DSM-5 and ICD-11, underscoring the close relation between sleep quality and depression symptoms [13, 14]. However, as the evidence linking depression symptoms and sleep quality to OS is lacking, it is not clear whether there is a joint association of depression and sleep quality with the risk of OC mortality.
Therefore, to clarify whether depression and sleep quality are independent or overlapping prognostic factors for OC, our primary aim was to evaluate the individual and joint associations of depression-related symptoms and sleep quality with OS based on participants from a prospective cohort of patients with OC in China, the Ovarian Cancer Follow-Up Study (OOPS). Furthermore, our secondary aim was to investigate whether changes in depression-related symptoms and sleep quality from pre-diagnosis to post-diagnosis were associated with OC survival, either separately or in combination. Through these efforts, we aimed to provide novel insights into the factors of long-term outcomes for OC survivors and explore potential intervention opportunities to enhance their quality of life and survival.
2. Method
2.1. Study Population
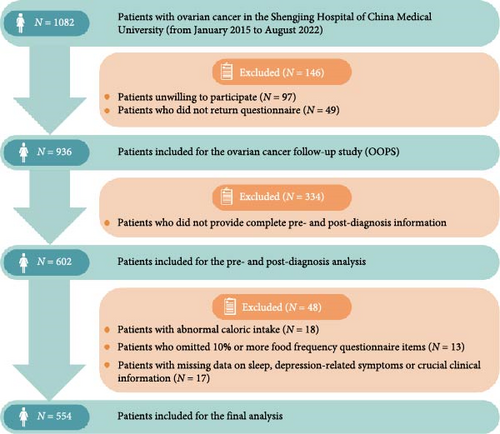
The OOPS is a large, ongoing hospital-based study aimed at investigating the relationship between biological, clinical, environmental, and lifestyle factors and OC prognosis [15]. From January 2015 to August 2022, 1082 patients aged 18–79 with histologically confirmed OC diagnosis were recruited during the baseline survey. The follow-up and medical treatment were conducted at the gynecological oncology ward at Shengjing Hospital of China Medical University, Shenyang, China. After excluding patients who were unwilling to participate or failed to return the questionnaire, the final study population consisted of 936 patients. Of these, 602 patients provided complete pre-diagnosis and post-diagnosis information. We additionally excluded patients with abnormal caloric intake (<500 or >3500 kcal per day) (n = 18) [16, 17] and those who left 11 (10%) or more food items blank (n = 13) [18]. Any patients who had missing data related to sleep quality, depression-related symptoms, or other crucial clinical information were not included in the study (n = 17). Finally, 554 patients were included in the final analysis (Figure 1). The study was approved by the Institutional Review Board of the Ethics Committee of Shengjing Hospital of China Medical University, and all the patients signed the informed consent form.
2.2. Data Collection
The demographics and lifestyle factors of patients with OC were obtained from a self-administered questionnaire conducted by well-trained interviewers. The pre-diagnosis questionnaire was sent out when patients were first diagnosed with OC to collect the pre-diagnosis information, and the post-diagnosis information was collected 12 months after diagnosis. The questionnaires gathered information including socioeconomic characteristics, sleep parameters, mental health status, healthcare product use, reproductive history, dietary consumption, individual living habits, cigarette smoking, alcohol drinking, physical activity, and family history of chronic diseases. For most lifestyle factors, such as diet and physical activities, we asked patients to recall the information of the year before diagnosis in the pre-diagnosis questionnaire and the information of the last 1 year in the post-diagnosis questionnaire. In particular, we utilized the Patient Health Questionnaire (PHQ−9) to assess the depressive symptoms 2 weeks before the pre-diagnosis and post-diagnosis questionnaires and the Pittsburgh Sleep Quality Index (PSQI) questionnaire to evaluate the pre-diagnosis and post-diagnosis sleep quality 1 month before the two questionnaires. The mean daily energy intake was calculated by multiplying the frequency of food consumption by the caloric content of specified portions and summing the calories of all food items in the patient’s diet, based on Chinese food composition tables [19]. Clinical characteristics, including age at diagnosis, histological type, International Federation of Gynecology and Obstetrics (FIGO) stage, residual lesions, and comorbidities [20], were collected according to the electronic medical records of the Shengjing Hospital information system. In addition, anthropometric measurements, including the weight, height, and circumference of the waist and hips, were collected by trained staff adhering to a standardized protocol [21, 22]. Body mass index (BMI) was calculated as weight (kg)/height (m2).
2.3. Assessment of Depression-Related Symptoms and Sleep Quality
A nine-item depression screening instrument, PHQ-9, was utilized to determine the onset of depression-related symptoms in the current study [23, 24]. It has been proven with high consistency and validity among patients with depressive disorders in China hospitals, with the Cronbach’s α coefficient over 0.80 [25–27]. Response categories for the nine-item questionnaire were scored from 0 to 3 based on the frequency of symptoms, including “not at all,” “several days,” “more than half the days,” and “nearly every day.” After adding up the nine items, a total score ≥10 was considered as symptomatic depression in the present analysis [28]. Furthermore, the depression-related symptom was categorized into five groups: minimal (0–4), mild (5–9), moderate (10–14), moderately severe (15–19), and severe (20–27) [29].
Pre-diagnosis and post-diagnosis sleep quality were assessed by the PSQI questionnaire, one of the most widely recognized standardized measures [30]. The Cronbach’s α of PSQI among Chinese individuals in a previous study was 0.62 [31]. The questionnaire generates a global score of sleep quality and scores seven components: subjective sleep quality, sleep latency, sleep duration, sleep efficiency, sleep disturbance, use of sleeping medication, and daytime dysfunction due to sleepiness [32]. Each component weighs 0–3 scales equally, giving the total PSQI score ranging from 0 to 21 points. A lower score on PSQI indicates better sleep quality, and a score higher than five indicates poor quality of sleep [32]. In addition, patients were asked if they had a midday nap habit, and they were asked for the usual midday nap duration if the answer was affirmative. Total sleep duration corresponds to the sum of daytime napping and night sleep duration. The sleep disturbance included failing to fall asleep within half an hour, waking up during the night, and having to go to the bathroom during sleep, etc.
2.4. Follow-Up and Outcome Ascertainment
Patients diagnosed with OC were closely monitored until either their death from any cause or the last follow-up on February 16, 2023. The participants’ vital status was verified through medical records and active follow-up. The primary outcome of the study was the overall survival (OS), with the survival duration calculated from the date of OC diagnosis to the date of death or the final follow-up for those who remained alive.
2.5. Statistical Analysis
The primary analysis utilized the average level of depression-related symptoms and sleep quality, utilizing time-varying cumulative averages of PSQI score and PHQ score between pre-diagnosis and post-diagnosis [33]. For descriptive analysis, we compared the general and clinical characteristics based on the average levels of depression-related symptoms and sleep quality using the Student’s t-tests or the Kruskal–Wallis test for continuous variables and the Chi-square tests for categorical variables. Results were presented as mean with standard deviation (SD) or median with interquartile (IQR) for continuous variables and counts with percentages for categorical variables. The Kaplan–Meier technique was employed to plot crude survival curves and estimate the OS probabilities for OC.
The Cox proportional hazards regression model was utilized to estimate the hazard ratios (HRs) and two-sided 95% confidence intervals (CIs) for the individual and joint associations of depression-related symptoms and sleep quality with OS. Before the Cox regression analyses, we evaluated the proportional hazards assumption by adding an interaction term between each activity variable and log survival time, confirming that no violations were found (all p > 0.05). We evaluated the individual associations of depression-related symptoms and sleep quality with OS using a two-step approach. First, we assessed the associations of depression-related symptoms and sleep quality with OS without adjusting for each other. PSQI and PHQ scores were analyzed as both continuous and categorical variables. When treated as categorical variables, patients with PSQI ≤ 5 or PHQ < 10 served as the reference groups [34, 35]. In this step, three settings of models were utilized for both associations. The selection of all covariates for the models was informed by their correlation with sleep quality, depression, and clinical significance, as well as previous studies, all of which were further depicted by a directed acyclic graph (DAG) (Figure S1) [36]. Model 1 was adjusted for age at diagnosis (continuous, years). In Model 2, we additionally adjusted for education (junior secondary and below, senior high school/technical secondary school, or junior college/university and above), family income per month (<5000 yuan, 5000–10,000 yuan, or >10,000 yuan), cigarette smoking (current, past, or never), alcohol drinking (current, past, or never), menopausal status (yes or no), BMI (continuous, kg/m2), and physical activity (continuous, MET∗hours/day). Model 3 was further adjusted for clinical characteristics, including FIGO stage (I–II or III–IV), histological type (serous or non-serous), residual lesions (none, <1 cm, or ≥1 cm), and comorbidities (yes or no) [20]. Of note, we evaluated multicollinearity among covariates through the variance inflation factor, and there was no multicollinearity among all the variables in the fully adjusted model. Second, based on Model 3, depression-related symptoms and sleep quality were mutually adjusted in Model 4. Furthermore, to explore potential nonlinear associations, we used restricted cubic splines (RCS) with three knots (i.e., 10th, 50th, and 90th percentiles) [37].
To assess the joint association of depression-related symptoms and sleep quality with OC survival, we also employed a two-step approach. First, we examined the potential multiplicative interaction of depression-related symptoms and sleep quality by adding cross-product terms in the fully adjusted model. In addition, additive interactions were assessed by calculating the relative excess risk due to interaction (RERI), attributable proportion, and synergy index [38]. Second, if the interaction was identified, we further divided the patients into four groups according to the joint categories of depression-related symptoms and sleep quality: with good sleep and without depression, with good sleep and depression, with poor sleep and without depression, and with poor sleep and depression. Hazard ratios (HRs) and 95% confidence intervals (CIs) were calculated using patients with good sleep quality and no symptoms of depression as the reference group. Confounding variables were also adjusted in this analysis with three different model settings.
To assess changes from pre-diagnosis to post-diagnosis in depression-related symptoms and sleep quality, we utilized Cox proportional hazard models in two steps to evaluate the individual and joint associations with OS. First, participants were categorized into three groups (no change, decreased, and increased) according to changes in PSQI score and changes in PHQ score, respectively. The “no change” group served as the reference group. The models were adjusted by baseline PSQI (or PHQ) score, age at diagnosis, family income per month, education level, menopausal status, baseline and change in cigarette smoking, baseline and change in alcohol drinking, baseline and change in BMI, baseline and change in physical activities, FIGO stage, histological type, comorbidities, and residual lesions. Additionally, changes in PSQI and PHQ scores were mutually adjusted based on the models. Second, to assess the joint association of improved sleep quality and relieved depression-related symptoms with OS, we divided patients into four groups based on the decrease of two scores: no decrease (as the reference group), only a decrease in PSQI score, only a reduction in PHQ score, and a decrease in both. Similarly, we also divided the whole crowd into four groups according to the increase of two scores to explore whether the worsened sleep quality and depression-related symptoms were jointly associated with OC survival. In addition to the confounding variables above, both PSQI and PHQ scores at baseline were adjusted in the models of this step.
Several sensitivity analyses were implemented to test the robustness of the primary findings. In addition to examining the average levels in the primary analysis, we further explored the associations of depression-related symptoms and sleep quality, both individually and jointly, with OC survival before and after diagnosis. To mitigate the potential for reverse causality due to disease severity, considering the low 5-year survival rate of OC, we performed 1-year lagged analyses in which we excluded patients with a follow-up period of less than one year. Moreover, we conducted further analyses to determine whether the severity of depression-related symptoms and poor sleep quality were associated with OC survival, controlling for these variables within the same multivariate model. To further address potential confounding from the consumption of tea and coffee [39–41], we made additional adjustments for tea (never, past, or current) and coffee drinking (never, past, or current). Furthermore, we assessed the association between seven specific components in PSQI score and OS among patients with OC [42].
To assess the potential impact of any unmeasured residual confounding, we utilized E-values derived from the HRs and 95% CIs obtained from fully adjusted models, which allowed us to estimate the minimum level of association required to sustain a robust model [43, 44]. A large E-value implies a robust model, as it would require a considerable unmeasured confounding effect to explain the independent impact of the exposure. To better control the confounding, stratified analyses were conducted for age at diagnosis (≤50 or >50 years), FIGO stage (I–II or III–IV), histological type (serous or non-serous), residual lesions (yes or no), and BMI (<24 or ≥24 kg/m2). Multiplicative and additive interactions of sleep quality and depression-related symptoms, individually and jointly, with these stratified variables were analyzed in the final model, respectively.
Analyses were performed using SAS version 9.4 (SAS Institute, Cary, NC, USA). GraphPad Prism software version 9.0.0. was used for visualizing the results. Two-sided P values less than 0.05 were considered statistically significant.
3. Result
3.1. Basic Characteristics
General characteristics of patients with OC stratified by the average level of sleep quality and depression-related symptoms are shown in Table 1. Upon reviewing the medical records of patients in our cohort, we found that no patient was diagnosed with psychiatric disorders prior to the current study. During a median follow-up of 44.60 months (IQR range 27.20–67.57 months), 205 deaths were documented due to all causes during the follow-up period to February 16, 2023. Among 554 eligible patients with OC, 295 (53.2%) had poor sleep quality, and the prevalence of depression-related symptoms was 20.8% (n = 115) before the diagnosis of OC. For post-diagnosis, 243 (43.9%) patients had poor sleep quality and 113 (20.4%) had related symptoms of depression. Among patients exhibiting symptoms related to depression, 41 (7%) and 44 (8%) patients were likely to have major depressive disorder according to the PHQ-9 for pre-diagnosis and post-diagnosis, respectively. According to the PSQI, 72 (13%) patients were evaluated as having sleep disorders before the diagnosis of OC, and 44 (8%) patients after diagnosis. The Cronbach’s α of PSQI in the current cohort was 0.73 for pre-diagnosis and 0.70 for post-diagnosis. The Cronbach’s α of PHQ-9 was 0.84 for pre-diagnosis and 0.85 for post-diagnosis. Patients with poor sleep quality tend to have lower educational levels than those with good sleep quality. In comparison to patients who do not exhibit related symptoms of depression, those with depression-related symptoms had lower educational levels and the habit of smoking currently. As shown in Table S1, advanced FIGO stage (III–IV) and larger size of residual lesions (>1 cm) were significantly associated with higher mortality among patients with OC.
| Characteristics | All patients | Sleep quality | p Valuea | Depression-related symptoms | p Valuea | ||
|---|---|---|---|---|---|---|---|
| Good (PSQI ≤ 5) | Poor (PSQI > 5) | No (PHQ < 10) | Yes (PHQ ≥ 10) | ||||
| No. of deaths/total | 205/554 | 69/261 | 136/293 | <0.01 | 157/448 | 48/106 | 0.05 |
| Median (IQR) PSQI score | 5.50 (3.50–7.50) | 3.50 (2.50–4.50) | 7.50 (6.50–9.50) | — | 5.00 (2.50–7.00) | 5.00 (5.50–10.50) | <0.01 |
| Score of subjective sleep quality | 1.00 (0.50–1.50) | 0.50 (0.50–1.00) | 1.50 (1.00–1.50) | <0.01 | 1.00 (0.50–1.00) | 1.50 (1.00–2.00) | <0.01 |
| Score of sleep latency | 1.00 (0.50–2.00) | 0.50 (0.50–1.00) | 1.50 (1.00–2.00) | <0.01 | 1.00 (0.50–1.50) | 1.50 (1.00–2.00) | <0.01 |
| Score of sleep duration | 0.50 (0.00–1.00) | 0.50 (0.00–0.50) | 1.00 (0.50–1.00) | <0.01 | 0.50 (0.00–1.00) | 0.50 (0.50–1.00) | 0.01 |
| Score of sleep efficiency | 0.50 (0.00–1.50) | 0.00 (0.00–0.50) | 1.00 (0.50–1.50) | <0.01 | 0.50 (0.00–1.50) | 0.75 (0.00–1.50) | 0.18 |
| Score of sleep disturbance | 1.00 (1.00–1.50) | 1.00 (0.50–1.00) | 1.50 (1.00–2.00) | <0.01 | 1.00 (0.50–1.50) | 1.50 (1.00–2.00) | <0.01 |
| Score of use of sleeping medication | 0.00 (0.00–0.00) | 0.00 (0.00–0.00) | 0.00 (0.00–0.00) | <0.01 | 0.00 (0.00–0.00) | 0.00 (0.00–0.00) | <0.01 |
| Score of daytime dysfunctions due to sleepiness | 1.00 (0.50–1.50) | 0.50 (0.00–1.00) | 1.50 (1.00–2.00) | <0.01 | 1.00 (0.50–1.50) | 1.50 (1.00–2.00) | <0.01 |
| Median (IQR) PHQ score | 6.00 (4.00–8.50) | 5.00 (3.50–7.00) | 7.50 (5.50–10.00) | <0.01 | 5.50 (3.00–7.25) | 12.00 (11.00–14.00) | — |
| Median (IQR) survival time, (months) | 44.60 (27.20–61.57) | 49.83 (32.83–64.17) | 38.87 (22.20–57.50) | <0.01 | 47.73 (30.58–63.75) | 31.22 (17.63–46.87) | <0.01 |
| Median (IQR) age at diagnosis, (years) | 53.00 (48.00–60.00) | 53.00 (47.00–60.00) | 54.00 (48.00–59.00) | 0.79 | 53.00 (48.00–59.50) | 52.00 (47.00–61.00) | 0.85 |
| Median (IQR) body mass index, (kg/m2) | 23.15 (20.83–24.80) | 23.24 (21.38–24.77) | 22.96 (20.57–24.88) | 0.29 | 23.24 (20.83–24.80) | 22.92 (20.60–24.80) | 0.80 |
| Median (IQR) physical activity, (MET∗h/d) | 8.93 (6.20–13.52) | 9.18 (6.51–13.21) | 8.63 (5.80–13.98) | 0.45 | 9.01 (6.28–13.96) | 8.40 (5.10–11.67) | 0.18 |
| Age at diagnosis, (years) | — | — | — | 0.39 | — | — | 0.72 |
| ≤50 | 206 (37.18) | 102 (39.08) | 104 (35.49) | — | 165 (36.83) | 41 (38.68) | — |
| >50 | 348 (62.82) | 159 (60.92) | 189 (64.51) | — | 283 (63.17) | 65 (61.32) | — |
| Alcohol drinking | — | — | — | 0.71 | — | — | 0.53 |
| Current | 41 (7.40) | 17 (6.51) | 24 (8.19) | — | 36 (8.04) | 5 (4.72) | — |
| Past | 153 (27.62) | 71 (27.20) | 82 (27.99) | — | 122 (27.23) | 31 (29.25) | — |
| Never | 360 (64.98) | 173 (66.29) | 187 (63.82) | — | 290 (64.73) | 70 (66.03) | — |
| Coffee drinking | — | — | — | 0.09 | — | — | 0.56 |
| Current | 88 (15.88) | 33 (12.64) | 55 (18.77) | — | 74 (16.52) | 14 (13.21) | — |
| Past | 21 (3.79) | 8 (3.07) | 13 (4.44) | — | 18 (4.02) | 3 (2.83) | — |
| Never | 445 (80.32) | 220 (84.29) | 225 (76.79) | — | 356 (79.46) | 89 (83.96) | — |
| Comorbidities | — | — | — | 0.76 | — | — | 0.41 |
| No | 320 (57.76) | 149 (57.09) | 171 (58.36) | — | 255 (56.92) | 65 (61.32) | — |
| Yes | 234 (42.24) | 112 (42.91) | 122 (41.64) | — | 193 (43.08) | 41 (38.68) | — |
| Education level | — | — | — | 0.02 | — | — | <0.01 |
| Junior secondary or below | 324 (58.48) | 138 (52.87) | 186 (63.48) | — | 246 (54.91) | 78 (73.58) | — |
| Senior high/technical secondary school | 108 (19.49) | 53 (20.31) | 55 (18.77) | — | 95 (21.21) | 13 (12.26) | — |
| Junior college/university or above | 122 (22.03) | 70 (26.82) | 52 (17.75) | — | 107 (23.88) | 15 (14.15) | — |
| FIGO stage | — | — | — | 0.43 | — | — | 0.56 |
| I-–I | 228 (41.16) | 112 (42.91) | 116 (39.59) | — | 187 (41.74) | 41 (38.68) | — |
| III–IV | 326 (58.84) | 149 (57.09) | 177 (60.41) | — | 261 (58.26) | 65 (61.32) | — |
| Histological type | — | — | — | 0.56 | — | — | 0.58 |
| Serous | 414 (74.73) | 198 (75.86) | 216 (73.72) | — | 337 (75.22) | 77 (72.64) | — |
| Non-serous | 140 (25.27) | 63 (24.14) | 77 (26.28) | — | 111 (24.78) | 29 (27.36) | — |
| Income per month, (Yuan) | — | — | — | 0.21 | — | — | 0.40 |
| <5000 | 308 (55.60) | 135 (51.72) | 173 (59.04) | — | 244 (54.46) | 64 (60.38) | — |
| 5000 to <10,000 | 161 (29.06) | 84 (32.18) | 77 (26.28) | — | 131 (29.24) | 30 (28.30) | — |
| ≥10,000 | 85 (15.34) | 42 (16.10) | 43 (14.68) | — | 73 (16.30) | 12 (11.32) | — |
| Menopause status | — | — | — | 0.91 | — | — | 0.39 |
| No | 169 (30.51) | 79 (30.27) | 90 (30.72) | — | 133 (29.69) | 36 (33.96) | — |
| Yes | 385 (69.49) | 182 (69.73) | 203 (69.28) | — | 315 (70.31) | 70 (66.04) | — |
| Residual lesions | — | — | — | 0.98 | — | — | 0.82 |
| No | 442 (79.78) | 208 (79.69) | 234 (79.86) | — | 355 (79.24) | 87 (82.08) | — |
| ≤1 cm | 79 (14.26) | 37 (14.18) | 42 (14.33) | — | 66 (14.73) | 13 (12.26) | — |
| >1 cm | 33 (5.96) | 16 (6.13) | 17 (5.81) | — | 27 (6.03) | 6 (5.66) | — |
| Smoking status | — | — | — | 0.32 | — | — | <0.01 |
| Current | 7 (1.26) | 2 (0.77) | 5 (1.71) | — | 5 (1.12) | 2 (1.89) | — |
| Past | 53 (9.57) | 29 (11.11) | 24 (8.19) | — | 53 (11.83) | 0 (0.00) | — |
| Never | 494 (89.17) | 230 (88.12) | 264 (90.10) | — | 390 (87.05) | 104 (98.11) | — |
| Tea drinking | — | — | — | 0.54 | — | — | 0.23 |
| Current | 260 (46.93) | 69 (26.44) | 70 (23.89) | — | 112 (25.00) | 27 (25.47) | — |
| Past | 155 (27.98) | 76 (29.12) | 79 (26.96) | — | 132 (29.46) | 23 (21.70) | — |
| Never | 139 (25.09) | 116 (44.44) | 144 (49.15) | — | 204 (45.54) | 56 (52.83) | — |
- Note: Values are numbers (percentages) unless stated otherwise. The bolded characters in the table indicate a statistical significance at the p-value of less than 0.05.
- Abbreviations: FIGO, The International Federation of Gynecology and Obstetrics; IQR, interquartile range; MET, metabolic equivalents of the task; PHQ, Patient Health Questionnaire-9; PSQI, Pittsburgh sleep quality index.
- ap Value was determined by Kruskal–Wallis test or Chi-square test.
3.2. Associations of Depression Related Symptoms and Sleep Quality With OC Survival
Individual and joint associations of the average level of depression-related symptoms and sleep quality with OS among patients with OC are summarized in Table 2 and Figure S2. When depression-related symptoms and sleep quality were not simultaneously adjusted for in Model 3, patients experiencing poor sleep quality and depression-related symptoms had significantly poor OS (HRdepression vs. no depression = 1.55, 95% CI = 1.10–2.17; HRpoor sleep vs. good sleep = 2.05, 95% CI = 1.51–2.75). When regarded as continuous variables, each 1 score increase in PSQI and PHQ score was significantly associated with a 32% and 36% reduction in survival, respectively. The association between sleep quality and OS was slightly attenuated but remained significant when depression-related symptoms and sleep quality were mutually adjusted in Model 4 (HRpoor sleep vs. good sleep = 1.96, 95% CI = 1.44–2.66; HRper 1 score increase = 1.21, 95% CI = 1.04–1.40). For depression-related symptoms in Model 4, a positive association with OC mortality was noted when the PHQ score was treated as a continuous variable (HR = 1.24, 95% CI = 1.05–1.46), but nonsignificant as a binary variable (HR = 1.34, 95% CI = 0.95–1.90). Additionally, we identified significant linear associations with OS for both PSQI and PHQ scores (Figure S3).
| Characteristics | Death/Total | Model 1a | Model 2b | Model 3c | Model 4d |
|---|---|---|---|---|---|
| Sleep quality | |||||
| Good (PSQI ≤ 5) | 69/261 | 1.00 (ref) | 1.00 (ref) | 1.00 (ref) | 1.00 (ref) |
| Poor (PSQI > 5) | 136/293 | 2.19 (1.64, 2.93) | 1.99 (1.48, 2.69) | 2.04 (1.51, 2.75) | 1.96 (1.44, 2.66) |
| Continuous (per 1 score increase) | — | 1.41 (1.24, 1.61) | 1.30 (1.14, 1.49) | 1.32 (1.16, 1.51) | 1.21 (1.04, 1.40) |
| Depression symptoms | |||||
| No (PHQ < 10) | 157/448 | 1.00 (ref) | 1.00 (ref) | 1.00 (ref) | 1.00 (ref) |
| Yes (PHQ ≥ 10) | 48/106 | 1.82 (1.31, 2.51) | 1.60 (1.14, 2.24) | 1.55 (1.10, 2.17) | 1.34 (0.95, 1.90) |
| Continuous (per 1 score increase) | — | 1.37 (1.20, 1.56) | 1.33 (1.16, 1.52) | 1.36 (1.18, 1.56) | 1.24 (1.05, 1.46) |
| Joint categories | |||||
| Good sleep and no depression | 61/235 | 1.00 (ref) | 1.00 (ref) | 1.00 (ref) | NA |
| Poor sleep and no depression | 96/213 | 2.07 (1.50, 2.85) | 1.99 (1.43, 2.76) | 1.98 (1.42, 2.75) | NA |
| Good sleep and depression | 8/26 | 1.59 (0.76, 3.33) | 1.77 (0.83, 3.76) | 1.41 (0.66, 3.01) | NA |
| Poor sleep and depression | 40/80 | 3.08 (2.06, 4.60) | 2.49 (1.63, 3.78) | 2.61 (1.70, 4.00) | NA |
- Note: The bolded characters in the table indicate a statistical significance at the p-value of less than 0.05.
- Abbreviations: NA, not appliable; PHQ, Patient Health Questionnaire; PSQI, Pittsburgh sleep quality index; ref, reference.
- aModel 1: Adjusted for age at diagnosis.
- bModel 2: Model 1 + family income per month, education level, menopausal status, smoking status, alcohol drinking, BMI, and physical activities.
- cModel 3: Model 2 + FIGO stage, histological type, comorbidities, and residual lesions.
- dModel 4: Further included both PSQI score and PHQ score in Model 3.
In the assessment of the joint associations, we documented significant multiplicative and positive additive interactions between depression-related symptoms and poor sleep quality in relation to OS (Pinteraction < 0.01; RERI = 0.16, 95% CI = 0.01–0.31). In the fully adjusted model, combinations of depression-related symptoms and poor sleep quality were positively associated with mortality, compared to patients with good sleep quality and without depression-related symptoms (HR = 2.61, 95% CI = 1.70–4.00). The additive interaction accounted for 10% (0.16/1.61) of the observed death events.
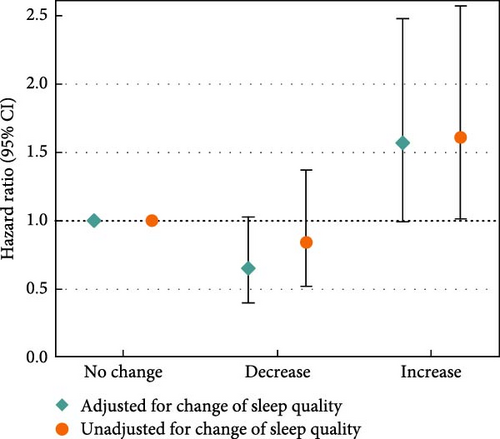
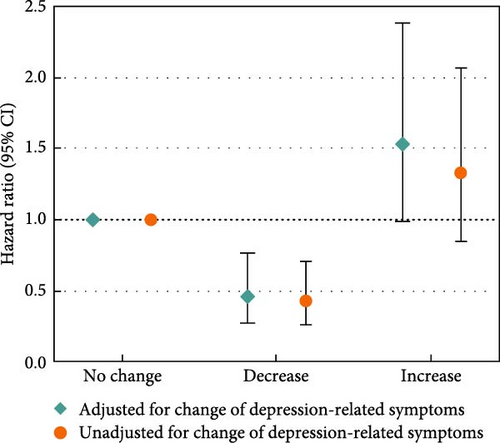
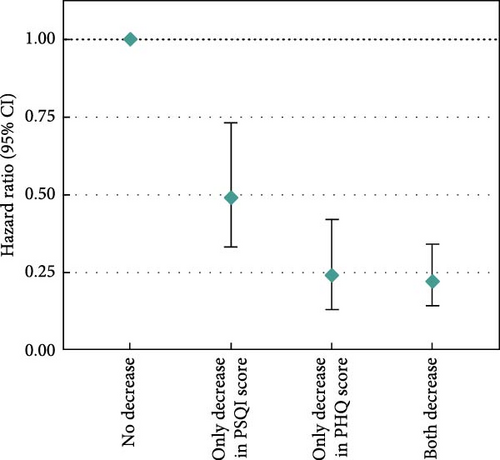
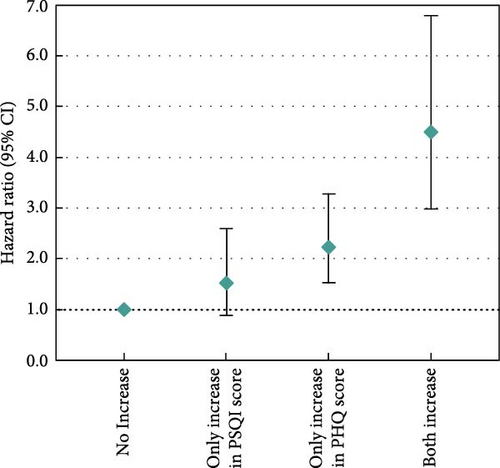
Moreover, we examined changes in depression-related symptoms and sleep quality according to changes in PSQI and PHQ scores from pre-diagnosis to post-diagnosis (Figure 2). Increased PSQI score was associated with worse OS when mutually adjusted with depression-related symptoms (HRincreased vs. no change = 1.61, 95% CI = 1.01–2.57; Figure 2a). Decreased PHQ score showed a beneficial association with OS in the fully adjusted models (HRdecreased vs. no change = 0.46, 95% CI = 0.28–0.76), and the association was slightly stronger after adjustment of sleep quality (HRdecreased vs. no change = 0.43, 95% CI = 0.26–0.71; Figure 2b). In the assessment of joint associations, we observed significant associations of decrease in both PSQI and PHQ scores with better OS (HRboth decrease vs. no decrease = 0.22, 95% CI = 0.14–0.34; Figure 2c), and increase in both scores was associated with reduced OS (HRboth increase vs. no increase = 4.50, 95% CI = 2.98–6.79; Figure 2d).
3.3. Sensitivity Analyses
When evaluating associations with OS separately for pre-diagnosis and post-diagnosis depression and sleep quality, most results aligned closely with those from the primary analysis (Table S2). Notably, pre-diagnosis depression-related symptoms showed no association with OS. Excluding patients with a follow-up time of less than 1 year or further adjusting for consumption of tea and coffee yielded consistent results with the primary analysis (Tables S3 and S4). Worse survival was detected for patients with severe depression-related symptoms when compared with non-depression symptom patients (Figure S4). Additionally, we observed a significant association between the average level of sleep disturbances and OS when examining the seven sleeping elements in the PSQI score (Table S5). The E value comparing the extreme groups was 3.27 for the joint categories of sleep quality and depression-related symptoms, surpassing the values for the individual categories (2.64 comparing poor sleep with good sleep and 2.03 comparing depression-related symptoms with non-depression symptoms). The result of E values suggested that the associations were more robust for the joint categories and were more unlikely to be explained away by an unmeasured confounder.
3.4. Stratified Analyses
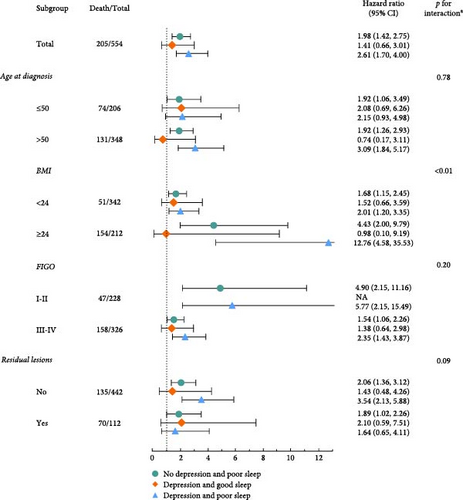
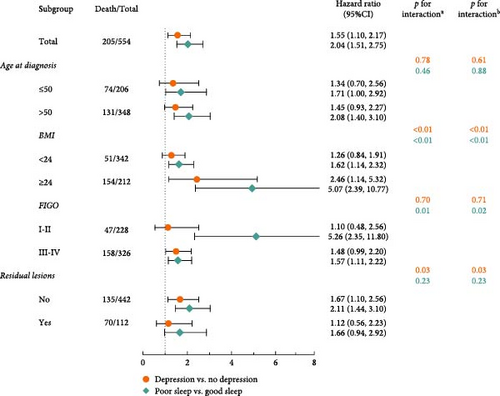
Consistent findings were observed in stratified analyses of age at diagnosis, FIGO stage, BMI, and residual lesions (Figure 3). Stronger associations were identified among patients with BMI ≥24 kg/m2, highlighting significant multiplicative interactions with BMI for the joint categories of sleep quality and depression-related symptoms (p < 0.01) (Figure 3a). Notably, multiplicative and additive interactions were observed in BMI with the average level of both depression-related symptoms and sleep quality. In addition, significant multiplicative and additive interactions were identified between the FIGO stage and sleep quality (Figure 3b). Patients with older age at diagnosis, BMI ≥24 kg/m2, early FIGO stage, and no residual lesions exhibited slightly stronger associations between sleep quality and OS. Meanwhile, stronger associations between depression-related symptoms and OS were observed among patients with BMI ≥ 24 kg/m2 and no residual lesions (Figure 3b).
4. Discussion
In this prospective cohort study, we demonstrated the independent associations of sleep quality and depression-related symptoms with OS among patients with OC. Moreover, we first revealed the interactions between sleep quality and depression-related symptoms concerning OS, indicating that these factors may overlap as prognostic indicators for OC. Improvements in sleep quality and reductions in depressive-related symptoms following diagnosis were associated with enhanced OS, whereas the deterioration of them was related to poor OS among the survivors. In addition, significant interactions with BMI were noted for both sleep quality and depression-related symptoms.
In the current study, poor sleep quality and depression-related symptoms were associated with a 104% and 55% increase in mortality among survivors with OC, respectively. In addition, patients with OC are particularly vulnerable to poor sleep quality and depression [45, 46], which suggests greater attention should be directed toward the mental health and sleep quality of these patients. In line with our findings, growing evidence has reported a link between depression and cancer mortality, especially among older adults [47, 48]. A meta-analysis of 14 cohort studies in 2024 revealed that depression in older adults with cancer significantly increased the risk of both all-cause and cancer-related mortality [48]. Moreover, a report in 2022 from the National Health and Nutrition Examination Surveys (2005–2014) involving 25,978 participants indicated that the association between depression and total mortality was stronger in women than men [49], which suggested women were more susceptible to depression and the negative outcomes of them tend to be more severe. Regarding sleep, the previous finding from OOPS indicated that longer total and night sleep duration was associated with better OS, whereas poor quality of sleep correlated with poor OS among OC survivors [34]. Moreover, a meta-analysis of 11 prospective cohort studies indicated that longer duration of sleep correlated with death caused by cancer, aligning with our current finding [50]. Furthermore, we found the inverse associations of depression-related symptoms and sleep quality with OS were attenuated when these two factors were included simultaneously in the models, which indicated the close relationship between these two factors and was consistent with several previous studies [51, 52].
When investigating the interactions between the two factors in relation to OS, poor sleep quality, and depression-related symptoms have an additive interaction that results in a 10% increase in mortality risk. It indicated that 10% of deaths among patients could potentially be prevented if either poor sleep quality or depression-related symptoms were effectively managed. Consistent with our findings, Cheng et al. [52] demonstrated that additive interaction accounted for 56% of the all-cause death events among 261,297 participants with both short sleep duration and depression. In contrast, the findings from Li et al. [49] in 2022 suggested no joint effect of depression and sleep disorder on total mortality. This discrepancy might stem from the different indicators to evaluate sleep quality and different methods to determine symptoms of depression. To be specific, Cheng et al. focused on sleep duration, while Li et al. focused on sleep disorders. Moreover, Cheng et al. defined patients with depression according to three sources of data (i.e., self-reported history of depression, antidepressant use, and depression-related hospitalization records), but Li et al. only utilized PHQ−9 to determine depression symptoms. Future studies are warranted to clarify the intricate interactions between sleep and depression on OS.
Notably, significant interactions with BMI were observed for sleep quality and depression-related symptoms in the stratified analyses. Moreover, the joint associations between these two factors and OS were particularly pronounced among patients with BMI ≥ 24 kg/m2. This indicates that overweight patients with OC who experience both poor sleep quality and depression may be at a substantially increased risk of mortality. Evidence from a meta-analysis published in 2014 found that obesity 5 years before OC diagnosis was associated with a poor prognosis [53]. As a prognostic factor for OC, BMI was also associated with deteriorating sleep quality and heightened levels of depression [54–56]. With respect to gynecological oncology, a clinical trial in 2020 revealed that endometrial cancer survivors with a higher level of obesity would have worse sleep quality, higher risk of depression, and a diminished quality of life [55], all of which may contribute to poor prognosis. Additionally, a previous cross-sectional study with 2575 older adults demonstrated a positive association between obesity and trouble sleeping with the mediation of depressive symptoms [56]. These findings underscore the necessity of paying attention to the prognosis of obese patients with poor sleep quality and depression. To gain further insights, more prospective studies are warranted to validate the interactions further and investigate potential underlying mechanisms.
The possible biological mechanisms explaining the significantly higher risk of death among OC survivors exhibiting both depression-related symptoms and poor sleep quality can be attributed to several biological mechanisms. A prominent theory highlights chronic inflammation as a critical factor in the progression of OC [57–59]. Adequate nocturnal sleep is vital for the circadian profile of interleukin (IL)−6 levels and production of tumor necrosis factor (TNF) by Toll-like receptor 4-stimulated monocytes [60, 61]. In addition, nighttime sleep deprivation activates inflammatory signaling pathways, such as those involving nuclear factor-κB and activator protein 1 [57, 62], which increases levels of mRNAs encoding proinflammatory cytokines, and boosts the production of IL-6 and TNF by Toll-like receptor 4-stimulated monocytes [63, 64]. Moreover, two meta-analyses have highlighted proinflammatory cytokine differences between patients with major depressive disorder and controls, including IL-6 and TNF-α [65, 66]. Chronic inflammation can induce malignant cell transformation in the surrounding tissue and facilitate the invasive growth of OC [67]. Several proinflammatory cytokines such as IL-6, IL-8, TNF-α, and transforming growth factor-β have also been shown to contribute to the progression of cancer [68]. Future studies should further elucidate the exact and detailed biological mechanisms of depression and sleep and their influence on the prognosis of OC.
Notably, our study has several unique strengths. First, this is the first study investigating the joint associations of sleep quality and depression-related symptoms with OS among OC survivors. Second, our study utilized the validated PHQ−9 and PSQI scales to assess depression-related symptoms and sleep quality, respectively. Our analysis not only includes baseline data but also incorporates assessments conducted after diagnosis, allowing us to capture the dynamic changes in sleep quality and depression-related symptoms from pre-diagnosis to post-diagnosis. Third, as a diverse array of potential confounders rigorously adjusted in our analyses, the robustness and rationality of multivariate models in the analyses were confirmed by the E-value and the DAG, thereby enhancing the reliability of the findings. Fourth, we assessed the multiplicative and additive model interaction effects between sleep quality, depression-related symptoms, and several potential confounders, uncovering significant results among overweight patients.
However, some limitations should be noted when interpreting our findings. First, although the PHQ-9 serves as a reliable and efficient tool for assessing depressive-related symptoms, it is important to recognize its limitations. The PHQ scale can only assess the severity of depressive-related symptoms, while some key information about depressive symptoms, such as duration, psychiatric treatments, and differential diagnosis of depressive symptoms, were not available from the questionnaire [69, 70]. However, PHQ−9 is a validated and reliable screening tool commonly used in primary care and non-psychiatric settings [71, 72], and its validity and performance have also been validated in cancer survivors [73, 74]. Similar to our study, many cohort studies investigating the associations between depressive-related symptoms and survival among patients with cancer utilized PHQ-9 scores rather than psychiatric interviews for the ascertainment of depressive symptoms [75, 76]. Additionally, the PHQ offers comparable validity with greater efficiency than the Primary Care Evaluation of Mental Disorders, which requires clinicians to spend more time on direct interviews for diagnostic information [77]. Second, due to the observational nature of the study, we were unable to determine the causal relationship between sleep quality, depression-related symptoms, and OS among patients with OC. Nevertheless, intervention studies on sleep quality and depressive symptoms are challenging to conduct. Moreover, with a high participation and follow-up rate, potential differential selection and withdrawal biases could be minimized. Third, patients with poor sleep quality or depression-related symptoms have poor compliance and delayed treatment. Some important confounders such as treatment of mental disorders were not assessed and modeled, raising concerns regarding the effect of residual unmeasured confounding. Although we applied E-values to estimate the unmeasured confounding, we must acknowledge that it is almost impossible to completely remove the effects of confounding factors in a cohort study, which might affect our results [78]. Fourth, all patients were recruited from a single referral hospital in China. Given that differing rates of depression and sleep quality have emerged between racial and ethnic groups [79], more oncology centers should be established in the various regions. Last, the study did not evaluate OC-specific mortality as the data for the cause of death was unavailable. However, evidence suggests that overall and OC-specific mortality may be highly consistent [80].
5. Conclusion
In conclusion, in this prospective study, poor OC survival was associated with poor sleep quality and depression-related symptoms, separately and jointly. Our findings might be applied to improve cancer management. People at high risk of OC should pay particular attention to improving their sleep quality and maintaining a good mood to mitigate the risk of developing depressive disorders. It also emphasized the importance of clinicians being attentive to psychiatric symptoms among patients in daily lives, rather than addressing them only after a formal diagnosis of mental disorders. Further, longitudinal studies are required to investigate whether patients with poor sleep quality and depression are susceptible to death, as this may ultimately guide individual treatment strategies for OC.
Conflicts of Interest
The authors declare no conflicts of interest.
Author Contributions
Jia-Nan Sun: conceptualization, writing–original draft, writing–review and editing. Yi-Zi Li: methodology, validation, writing–review and editing. Lan Wang: Conceptualization, resources, investigation. Xin-Jian Song: software and formal analysis. Jia-Xin Liu: software and validation. Jia-Cheng Liu: investigation and data curation. Jia-Yi Wang: investigation and data curation. Yu Li: investigation. Yu-Han Chen: software. Jia-Ming Li: formal analysis. Jin Xu: resources. Ke-Xin Li: investigation. Qi Bao: validation. Ming-Li Sun: formal analysis. Lang Wu: visualization. Song Gao: resources. Xiao-Ying Li: supervision. Dong-Hui Huang: validation. Qi-Peng Ma: supervision and data curation; Tao Tao: Data curation validation. Qi-Jun Wu: project administration, funding acquisition, writing–review and editing. Ting-Ting Gong: project administration, funding acquisition, writing–review and editing. Jia-Nan Sun, Yi-Zi Li, Lan Wang, Xin-Jian Song contributed equally to this work.
Funding
This work was supported by the National Key Research and Development Program of China (No.Grant 2022YFC2704205 to Qi-Jun Wu), the Natural Science Foundation of China (No. 82073647 and No. 82373674 to Qi-Jun Wu and No. 82103914 to Ting-Ting Gong), and Scientific Research Project of Education Department of Liaoning Province (No. LJKMZ20221137 to Ting-Ting Gong).
Supporting Information
Additional supporting information can be found online in the Supporting Information section.
Open Research
Data Availability Statement
The data that support the findings of this study are available from the corresponding author upon reasonable request.


