Distributed White Matter Abnormalities in Major Depressive Disorder: A Diffusion Tensor Imaging Combined Support Vector Machine Study
Abstract
Objectives: Existing research by machine learning analysis based on neuroimaging in major depressive disorder (MDD) is limited. This study intends to investigate the integrity of white matter in patients with MDD using diffusion tensor imaging (DTI) combining machine learning approaches and to develop a model to differentiate MDD patients from healthy controls (HCs).
Materials and Methods: Clinical and neuroimaging data were collected from 60 MDD patients and 52 HCs. The tract-based spatial statistics (TBSS) and automated fiber quantification (AFQ) techniques were employed to analyze DTI data. Differences in diffusion metrics were then used in a support vector machine (SVM) model to determine the most significant features for distinguishing MDD patients from HC.
Results: No significant differences were observed in the TBSS between two groups. The AFQ analysis revealed that MDD patients exhibited reduced axial diffusivity (AD) and fractional anisotropy (FA) in specific segments of nerve fibers. The combined FA + AD model demonstrated better predictive performance with an area under the receiver operating characteristic (ROC) curve (AUC) of 0.833 and a predictive accuracy of up to 85.00%, surpassing models utilizing single FA or AD metrics.
Conclusion: DTI combined with machine learning distinguished MDD patients through specific white matter alterations, underscoring the role of microstructural connectivity in depression pathology.
1. Introduction
Major depressive disorder (MDD) is a prevalent mental health condition characterized by a sustained low mood, anhedonia—defined as the loss of interest or pleasure, and the presence of suicidal ideation [1, 2]. Despite its high prevalence, disability, and relapse rates, the pathogenesis of MDD remains unclarified. Current diagnostic criteria for MDD are primarily based on clinical observations and self-reports, which are subject to variability and lack objective biological validation [1, 3]. This diagnostic approach may not fully account for the heterogeneity in the biological underpinnings of depressive symptoms, highlighting the need for reliable biomarkers to enhance diagnostic precision [1].
In recent years, magnetic resonance imaging (MRI) has emerged as a crucial tool in elucidating the neural underpinnings of MDD and in enhancing its diagnosis and treatment. Our understanding has been significantly advanced by structural MRI (sMRI) studies, which have consistently reported brain structural abnormalities in MDD patients. These abnormalities are particularly evident in gray matter regions critical for emotion regulation, decision-making, and reward processing, such as the frontal lobe, hippocampus, and limbic system [1, 4–6]. Previous meta-analyses synthesize findings from various fMRI studies to identify consistent brain activation abnormalities in MDD, particularly in areas like the prefrontal cortex, anterior cingulate cortex, and amygdala, which are crucial for emotion regulation and cognitive functions [7, 8]. Additionally, diffusion tensor imaging (DTI), currently the only technique capable of noninvasively exploring white matter nerve fiber tracts in the living human brain, maps the direction of white matter nerve fibers by measuring the diffusion characteristics of water molecules and has been widely applied in the study of the pathological mechanisms of mental illnesses [9]. Previous studies have utilized DTI to investigate the microstructural abnormalities in white matter associated MDD. Kieseppä et al. [10] reported decreased fractional anisotropy (FA) in specific white matter regions, suggesting disruptions in the neural networks implicated in mood regulation. Ota et al. [11] compared white matter integrity between melancholic and atypical features of MDD, contributing to the understanding of subtype-specific differences in brain structure. Further, Sacchet et al. [12] used a machine learning approach to classify MDD patients based on whole-brain graph metrics derived from DTI data, highlighting the potential of these techniques for diagnostic purposes. Up to now, the most frequently mentioned white matter structural abnormalities in MDD were found in regions such as the corpus callosum (CC), cingulate gyrus, inferior occipital gyrus, and anterior thalamic radiation [13, 14].
In DTI research, FA, mean diffusivity (MD), radial diffusivity (RD), and axial diffusivity (AD) are the most commonly used metrics. Abnormalities in these metrics reflect changes in the integrity of white matter. Tract-based spatial statistics (TBSS), a DTI–based analysis approach, is primarily used to study microstructural changes in white matter fiber tracts. This method reduces registration distortion through skeletonization, making it suitable for comparative analysis at the group level. Koshiyama et al. [15] conducted a large-sample analysis using the TBSS method to study and compare white matter microstructural alterations across four major psychiatric disorders, providing insights into the pathophysiology of these diseases. On the other hand, automated fiber quantification (AFQ) takes into account the microanatomical features and diffusion characteristics of white matter fiber tracts, allowing for detailed analysis of specific white matter fiber bundles [16, 17]. It provides quantitative evaluation along the entire pathway of each fiber bundle. The AFQ approach has been successfully applied to various diseases such as obsessive-compulsive disorder (OCD) [18], schizophrenia [19], and cerebral small vessel disease [20]. It has also begun to receive attention and application in studies of MDD. One previous study performed AFQ analysis on diffusion-weighted imaging (DWI) for 14 female MDD patients and 18 healthy female controls. The results showed increased FA in the corticospinal tract fiber pathways in the bilateral posterior limbs of the internal capsules, the right corona radiata, and segments of the left external capsule in MDD patients [21]. One recent research conducted AFQ studies on postpartum depression (PPD) patients at the first episode and found that, compared to the non-PPD group, the PPD group showed significantly increased FA and AD in the right anterior thalamic radiation and increased FA and decreased RD in the cingulum [22]. Zhang et al. [23] performed AFQ studies on DTI data of MDD patients with and without suicidal tendencies and found abnormalities in the left inferior fronto-occipital fasciculus (IFOF), right anterior thalamic radiation, and bilateral cingulum. When comparing the suicidal and nonsuicidal MDD groups, the suicidal group showed increased AD in the right anterior thalamic radiation and increased MD in the left IFOF, with the suicidal group showing significantly lower MD in the left cingulum compared to healthy controls (HCs). These AFQ studies on MDD have identified different white matter metric abnormalities in specific segments of fiber tracts such as the IFOF, anterior thalamic radiation, and cingulum. However, existing results were highly heterogeneous.
Neuroimaging manifestations of mental illnesses are often subtle and not easily detectable [24], making it challenging to identify minute changes in the brain with conventional methods. This may result in the omission of imaging markers that are crucial for the accurate diagnosis of mental disorders [25]. Additionally, current simple brain imaging group comparison studies have limited value in advancing the individualized diagnosis of mental illness patients in clinical practice [26]. To date, there has been only one study involving AFQ–based machine learning analysis in MDD brain imaging research [27]. This study identified abnormalities in the right uncinate fasciculus and the left anterior thalamic radiation in MDD patients compared to HC. Further machine learning results suggested that the FA of the left anterior thalamic radiation could distinguish between bipolar disorder and MDD with an accuracy of 68.33%. However, the study did not extend its classification to distinguish between MDD and HC. Support vector machine (SVM) is a linear classifier widely used in the field of imaging machine learning, primarily for binary classification of data. This method is capable of seeking a maximum-margin hyperplane to achieve more accurate and valuable group differentiation [28]. Furthermore, due to its efficiency in classification tasks and good performance in handling small sample datasets, SVM is more practical for neuroimaging data analysis, leading to its widespread application in deciphering the mechanisms of mental disorders.
Our study aims to conduct TBSS and AFQ analyses of DTI data to explore changes in white matter fiber integrity in MDD patients and identify specific abnormal segments of white matter fiber tracts in their brains. Subsequently, we will build an SVM machine learning model based on prior results to investigate its predictive classification ability between MDD patients and HC and to identify the best classification prediction indicators. We hypothesize that MDD patients may exhibit microstructural white matter abnormalities in the core nerve tract such as the cingulum cingulate and CC, and these alterations can serve as discriminative features of MDD.
2. Materials and Methods
2.1. Participants
This study was approved by the Clinical Trial Ethics Committee of Shandong Daizhuang Hospital (approval number 2021-06-01). The written informed consents were obtained from all participants before the study. Sixty patients diagnosed with MDD according to the DSM-5 were included, from both the inpatient and outpatient departments of Shandong Daizhuang Hospital. A total of 52 HCs were also recruited, including medical students, hospital stuff, and individuals from the general population. Only right-handed and under 60 years of age Han Chinese individuals were included in this study, and the exclusion criteria for both groups were as follows: secondary depression; major physical illnesses, including those impacting the cardiovascular, hepatic, renal, hematological, or endocrine systems; the presence of other significant psychiatric or neurological disorders, such as schizophrenia, substance (drug and alcohol) dependence, epilepsy, cerebrovascular disease, and brain injury; contraindications for MRI due to claustrophobia or other reasons; a history of substance abuse; pregnancy; and any abnormal brain structures identified through routine MRI scans. Depressive and anxious symptoms were evaluated using the Hamilton Depression Rating Scale (HAMD), and Hamilton Anxiety Scale (HAMA), respectively.
2.2. Image Acquisition
MRI scanning was carried out at a Siemens 3.0T MAGNETOM Lumina MRI scanner (Siemens Medial Solutions, Erlangen, Germany) and by a skilled radiological technician. Using a 32-channel phased-array head coil, perform T1- and T2-weighted scans for plain imaging, followed by 3D sMRI (3D-T1) and DTI scans for each subject. Using the magnetization-prepared rapid gradient echo (MPRAGE) sequence for T1-weighted imaging to acquire high-resolution structural images.
The scanning parameters for T1 were as follows: TE = 1.85 ms, FOV = 256 mm × 256 mm, TR = 2530 ms, voxel size = 1 mm × 1 mm × 1 mm, FA = 15°, slice thickness = 1 mm, without gap, and scan time = 6.02 min. DTI imagings were acquired with the following scanning parameters: TE = 7.38 ms, FOV = 224 mm × 224 mm, TR = 732 ms, voxel size = 2 mm × 2 mm × 2 mm, slice thickness = 2 mm, without gap, b-values = 0 and 1000 s/mm2, and scan time = 2.47 min.
2.3. DTI Data Preprocessing
Using FMRIB Software Library (FSL) version 5.0 (https://fsl.fmrib.ox.ac.uk/fsl) [29] perform the following preprocessing steps on all DTI data intended for AFQ processing: First, convert the initial DICOM format data to NIfTI format. Next, use the Brain Extraction Tool (BET) to remove nonbrain structures. Then, perform head motion and eddy current correction as well as gradient direction correction on the image data. Finally, use the Dtifit program to compute tensor metrics from the corrected images, obtaining FA, MD, AD, and RD indices.
2.4. TBSS Based on White Matter Skeleton Analysis
Comparative analysis of tensor metrics was conducted using the TBSS method in FSL (https://fsl.fmrib.ox.ac.uk/fsl/fslwiki/). Initially, individual FA images were registered to the standard FA template using both linear and nonlinear methods, and the mean FA of all subjects was calculated. The mean FA was then skeletonized, and a threshold of 0.2 was applied to the skeleton FA values to remove spurious skeletons, retaining the primary white matter fiber skeleton (portions with FA values greater than 0.2). All registered FA images were projected onto the mean FA skeleton to obtain individual subject FA skeletons. Subsequently, the tbss_nonFA command was used to project individual MD, AD, and RD onto the FA skeleton. Statistical analysis of the microstructural metrics was performed using the randomise tool in FSL, conducting a two-sample t-test with sex and age as covariates, and 5000 permutations. Significance was assessed using threshold-free cluster enhancement (TFCE) correction, with p ≤ 0.05. Differences in brain regions were reported based on the JHU White-Matter Tractography Atlas.
2.5. AFQ
Further processing of the preprocessed DTI data was conducted using the AFQ software package [16, 17] based on Matlab. First, whole-brain fiber tractography was performed using a deterministic fiber tracking algorithm with termination criteria set to a turning angle greater than 30° or FA < 0.2, resulting in whole-brain fiber tracts. Then, fiber tracts were identified based on regions of interest (ROIs) as described by Wakana. When the fibers passed through two ROIs, they were recognized as specific fiber tracts and segmented. An iterative algorithm with a 3D Gaussian filter was used to refine and clean the fiber tracts by excluding fibers whose length exceeded four standard deviations from the mean length and fibers whose distance from the core fiber bundle exceeded four standard deviations. Next, the central positions of the fiber bundles were corrected by adjusting the tracked fibers to the central position defined by the two ROIs for each fiber bundle. Finally, for each of the 20 fiber bundles, 100 equidistant nodes were sampled per fiber. FA, MD, AD, and RD values were calculated for each node, and the weighted average of the diffusion metrics at each node was computed. Independent samples t-tests were conducted on the FA, AD, RD, and MD metrics at 100 nodes along each fiber bundle in each group using Matlab software, with gender, age, and slice thickness included as covariates. Multiple comparisons were corrected using the false discovery rate (FDR).
2.6. SVM Analysis
The identified neuroimaging differences were selected as features to construct the SVM model. Participants were randomly assigned to either the training set, which constituted 80% of the total sample or the test set, comprising the distribution of the remaining 20%. This stratified randomization ensured that both groups were representative of the entire sample, maintaining the integrity of our model training and validation processes. Specifically, the training set includes 40 cases and the test set includes 10 cases from both the HC and MDD groups, ensuring balanced representation in our analysis. The Z-score method was then used to scale the dataset’s feature values to a mean of 0 and a standard deviation of 1 for data normalization. Feature selection was conducted by initially using a t-test to select the top 10% of features based on t-values, followed by LASSO to further refine and select the optimal features. Specifically, this involved identifying the fiber bundle nodes with the most pronounced differences in AD and FA values between the MDD and HC groups. These nodes were then subjected to LASSO regression to determine their relative importance and contribution to the classification model, ensuring that only the most discriminative features were included in the final SVM model. Each model’s performance was assessed using a fivefold cross-validation method, which included calculating the area under the receiver operating characteristic (ROC) curve (AUC), sensitivity, specificity, and overall diagnostic accuracy. These metrics were used to evaluate the ability of neuroimaging features to effectively classify and predict MDD patients from healthy subjects.
2.7. Statistical Analysis
Statistical analysis of general statistical data and all scale data was conducted using SPSS 21.0 (Statistical Product and Service Solutions, Chicago, Illinois). Quantitative variables were analyzed using the t-test, while qualitative variables were analyzed using the chi-square (χ2) test. Results were expressed as mean ± standard deviation (x ± s). The χ2 test was used to compare gender differences between the MDD patient group and the control group. Independent samples t-tests were used to compare differences in age, HAMD, and HAMA scale scores between the two groups.
3. Results
3.1. Demographic and Clinical Characteristics
Demographic and clinical data of the 60 MDD patients and 52 HCs are shown in Table 1. There were no significant differences in sex and age between the two groups (p > 0.05), but the patient group showed significantly higher HAMD and HAMA scores.
| Variables | MDD (n = 60) |
HC (n = 52) |
t/χ2 | p |
|---|---|---|---|---|
| Sex (male/female) | 20/40 | 21/31 | 0.33 | 0.565 |
| Age | 27.17 ± 11.11 | 27.50 ± 9.83 | 0.17 | 0.870 |
| HAMD | 21.82 ± 4.55 | 0.38 ± 0.75 | −35.94 | <0.001∗ |
| HAMA | 16.52 ± 5.55 | 0.35 ± 0.84 | −22.28 | <0.001∗ |
- Abbreviations: HAMA, Hamilton Anxiety Scale; HAMD, Hamilton Depression Rating Scale; HC, healthy control; MDD, major depressive disorder.
- ∗p < 0.001.
3.2. Results of TBSS
After TFCE correction, no significant differences were observed in the TBSS analysis. Uncorrected results are shown in Tables S1–S4.
3.3. Results of AFQ
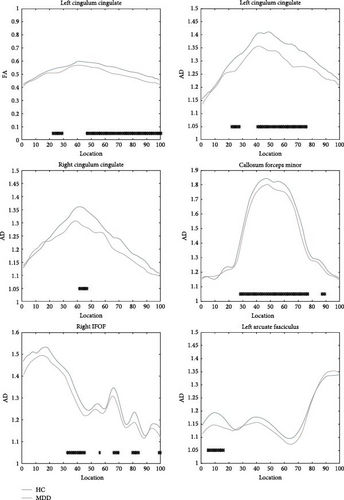
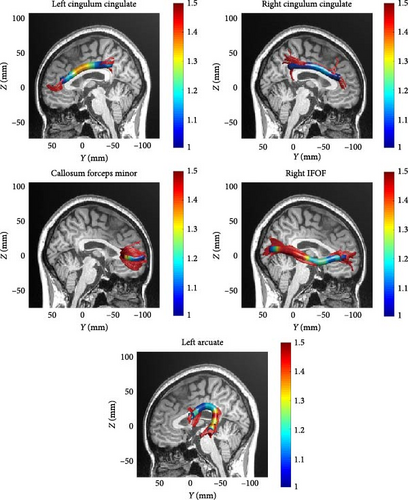
Due to the strict criteria used in AFQ fiber bundle identification, not all 20 fiber bundles could be identified for each subject. The two hippocampal fiber bundles on both sides were excluded according to the AFQ algorithm, ultimately resulting in successful tracking of 18 fiber bundles. For subjects where specific fiber bundles were not tracked, those instances were excluded from statistical analysis to maintain data integrity and prevent the introduction of false data. The 18 white matter fiber bundles are as follows: bilateral anterior thalamic radiation, bilateral corticospinal tract, bilateral cingulum cingulate, bilateral IFOF, bilateral inferior longitudinal fasciculus, bilateral superior longitudinal fasciculus, bilateral uncinate fasciculus, bilateral arcuate fasciculus, callosum forceps major, and callosum forceps minor. Compared to the HC, the MDD patients showed reduced FA values in the left cingulum cingulate (segments 23–29 and 47−100). Additionally, reduced AD values were observed in the left cingulum cingulate (segments 23–28 and 41−76), right cingulum cingulate (segments 42–47), callosum forceps minor (segments 28–89), right IFOF (segments 33–45, 56, 66–70, 80−84, and 99–100), and left arcuate fasciculus (segments 5–16). There were no significant differences in the MD and RD metrics after correction. Specific results are shown in Table 2 and Figure 1. A midsagittal view of the five white matter fiber bundles is shown in Figure 2.
| Parameter | Bundle name | Number of significant nodes (p < 0.05, uncorrected) |
Number of significant nodes (p < 0.05, FDR corrected) |
|---|---|---|---|
| FA | Left cingulum cingulate | 67 | 61 |
| AD | Left cingulum cingulate | 50 | 42 |
| Callosum forceps minor | 57 | 53 | |
| Right IFOF | 47 | 26 | |
| Left arcuate fasciculus | 19 | 12 |
- Abbreviations: AD, axial diffusivity; FA, fractional anisotropy; FDR, false discovery rate; IFOF, inferior fronto-occipital fasciculus.
3.4. Results of SVM
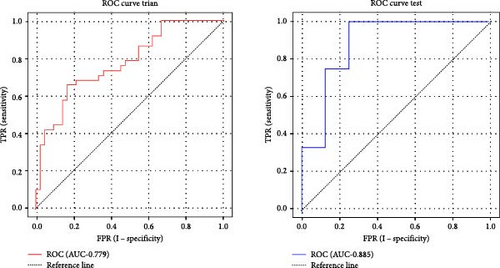
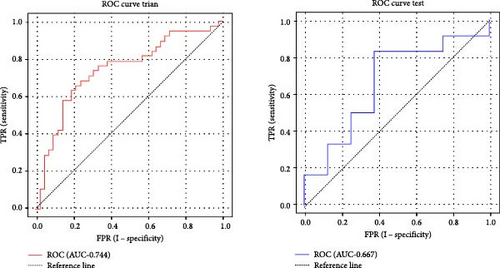
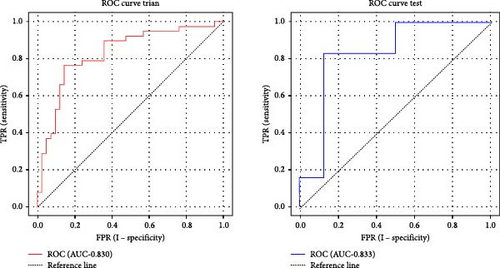
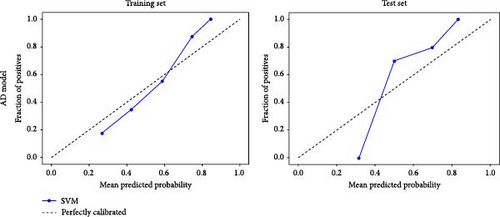
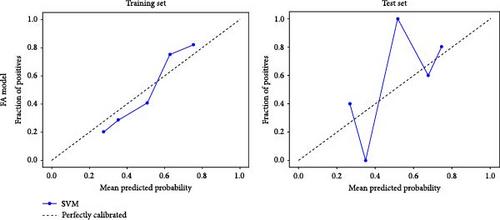
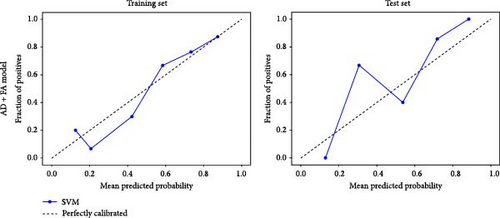
Based on prior AFQ findings, three different SVM models were constructed: one based on AD, another on FA, and a combined model using both AD and FA (AD + FA). The values of the segments showing differences in five fiber bundles (left cingulum cingulate, right cingulum cingulate, callosum forceps minor, right IFOF, and left arcuate fasciculus) in the AFQ results were selected as features. Five AD features, five FA features, and seven AD + FA features were extracted from all white matter fiber bundles. The analysis of the classification performance of the SVM for the two groups showed that the sensitivity, specificity, accuracy, and AUC of the SVM classification for MDD and HC based on AFQ analysis are shown in Table 3, with the combined FA + AD model having the highest classification performance. Figures 3 and 4 show the ROC curves and calibration curves of each model, respectively.
| Parameter | Categorization | AUC | Accuracy (%) | Sensitivity (%) | Specificity (%) |
|---|---|---|---|---|---|
| AD | Training set | 0.779 | 73.75 | 63.16 | 83.33 |
| Test set | 0.885 | 60.00 | 41.67 | 87.50 | |
| FA | Training set | 0.744 | 71.25 | 68.42 | 73.81 |
| Test set | 0.667 | 65.00 | 66.67 | 62.50 | |
| FA + AD | Training set | 0.830 | 76.25 | 76.32 | 76.19 |
| Test set | 0.833 | 85.00 | 83.33 | 87.50 | |
- Abbreviations: AD, axial diffusivity; AUC, area under the ROC curve; FA, fractional anisotropy; ROC, receiver operating characteristic; SVM, support vector machine.
4. Discussion
In this study, we investigated the integrity of white matter fiber tracts in MDD using TBSS and AFQ techniques. The results showed that MDD patients exhibited reduced FA values in specific locations in the left cingulum cingulate compared to the HC group. Additionally, the AD values were abnormally decreased in the bilateral cingulum cingulate, callosum forceps minor, the right IFOF, and the left arcuate fasciculus. These findings suggest that the integrity of white matter fiber structures in these regions is compromised. The fiber bundle nodes with intergroup differences showed good classification performance for MDD.
In MDD patients, white matter abnormalities may occur only in specific segments of certain fiber bundles. Therefore, no significant differences were observed in our TBSS results. On the other hand, the AFQ study results indicated that, compared to the control group, the MDD group exhibited abnormalities in five white matter tracts: the bilateral cingulum cingulate, callosum forceps minor, the right IFOF, and the left arcuate fasciculus. Specifically, the FA value was decreased in the left cingulum cingulate. FA reflects the degree of water molecule diffusion in one direction relative to other directions, closely related to the integrity and directionality of white matter fiber tracts. A reduction in FA typically indicates fiber tract damage or structural disintegration [30]. In addition, our study found decreased AD values in the bilateral cingulum cingulate, callosum forceps minor, right IFOF, and left arcuate fasciculus in MDD patients. AD reflects the rate of water molecule movement along the axis of nerve fibers, generally associated with the condition of axons [31]. A decrease in AD may be related to neuroprotective mechanisms or axonal remyelination. Besides, it may also represent an early stage of axonal damage, where the microstructure within the axon becomes denser. In some cases, such as the early stages of certain types of brain injury, a reduction in AD might be a sign of cellular edema [32, 33]. Our findings of altered FA and AD in specific white matter tracts in MDD patients highlight the potential for these microstructural changes to serve as biomarkers for the disorder, reflecting both the compromised integrity and altered axonal properties within key neural pathways implicated in depression.
The cingulum cingulate is located in the limbic region of the cerebral cortex and plays a crucial role in various cognitive and emotional processes. It has connections with the prefrontal cortex, temporal lobes, amygdala, and hippocampus and is involved in the regulation and processing of emotions, cognition, attention, and memory [34]. Abnormal changes in the white matter of the cingulum have been reported in numerous studies related to depression [12]. One recently published research on subthreshold depression also found structural abnormalities in the white matter of the cingulum [35], suggesting that structural connectivity abnormalities in this region might have predictive significance for the onset and progress of depression. Additionally, for treatment-resistant depression, deep brain stimulation (DBS) has been used to target specific brain regions. The left cingulum, in particular, is considered a critical node in the pathology of MDD. Stimulation of this area in treatment-resistant MDD patients has been shown to trigger transient positive perceptions and emotional changes, such as “feeling less tense,” “being able to step outside oneself to focus more clearly on the external environment,” and “a sense of relief” [36]. Further research has also indicated that individuals with subclinical anhedonia or a family history of depression exhibit alterations in the diffusion metrics of the cingulum [25]. These findings suggest that structural connectivity disruptions in the cingulum cingulate might be associated with the emotional and behavioral manifestations observed in MDD.
In the field of neuroimaging studies on MDD, the CC, as the largest fiber bundle connecting the two hemispheres of the brain, plays a vital role in integrating interhemispheric cognitive functions, including language comprehension, visuospatial skills, memory formation, and perception. Additionally, the CC is essential in emotional regulation, particularly in processing emotional information and coordinating emotional responses [37]. Recent neuroimaging studies have highlighted the potential importance of the CC in the pathogenesis of depression [13, 38]. These studies span different age groups, from adolescents [39] to the elderly [40], and have consistently identified abnormalities in the white matter of the CC. This growing body of evidence highlights the significance of the CC in understanding the neurobiological mechanisms underlying MDD. In a study by Vulser et al. [35], early changes in the white matter microstructure of 96 adolescents aged 14 revealed abnormalities in the anterior part of the CC. This finding suggested that early FA abnormalities in fibers projecting to the anterior cingulate cortex might be associated with an increased risk of transitioning to a depressive state during adolescence [35]. Similarly, Sherbaf et al. [24] identified abnormalities in the CC in groups with mild and subthreshold depressive symptoms, indicating the crucial role of the CC in the early stages of MDD development. Our study aligns with previous research, further corroborating the central role of the CC in the pathophysiology of MDD. Therefore, structural abnormalities in the CC may be a significant neuropathological basis for the onset of MDD. Observations of these abnormalities across different age groups suggest that CC abnormalities may be a pervasive feature throughout the entire course of MDD.
The IFOF is a crucial white matter tract in the brain, connecting the frontal and occipital lobes while traversing the temporal lobe [41]. It plays a key role in visual processing, emotion regulation and cognitive functions by facilitating information exchange between the frontal and occipital regions, thus, coordinating complex neural networks involved in emotion and cognition [42]. Recent studies have shown that the structure and function of the IFOF were altered in patients with depression [43], with these abnormalities closely related to core depressive symptoms such as persistent sadness, loss of interest or pleasure, and cognitive impairment [44]. Zhang et al. [23] observed increased MD and RD in the IFOF of depressed individuals with suicidal tendencies, suggesting that microstructural integrity abnormalities in the IFOF might be associated with negative emotions and cognitive deficits in these patients. The arcuate fasciculus connects key language processing areas of the brain, including Broca’s area in the frontal lobe and Wernicke’s area in the temporal lobe, making it essential for language comprehension and production [45]. Besides its role in language, the arcuate fasciculus is also involved in other cognitive functions such as attention, memory, and emotional processing. A meta-analysis on the white matter of untreated MDD patients found abnormalities in the integrity of this tract [46], but the research on the arcuate fasciculus and its relationship to the neuroimaging mechanisms of MDD remains relatively scarce. Further investigation is needed to explore the association between the arcuate fasciculus and MDD.
The classification results demonstrated that machine learning models using AD and FA as individual predictors had relatively low identification accuracy rates of 60.00% and 71.25%, respectively. In contrast, the model combining AD and FA indices significantly increased the classification accuracy to 85.00%. Additionally, the combined model surpassed the single-index models in sensitivity (83.33%) and specificity (87.50%).
Current research in the field of MDD has explored various machine learning methods based on neuroimaging data to distinguish between MDD patients and healthy individuals, demonstrating classification efficiencies ranging from 70% to 100%. For example, Schnyer et al. [47] used SVM combining white matter to identify 52 MDD patients aged 18–35 and reported an overall accuracy of 70% based on whole-brain FA, with the right hemisphere achieved a higher overall accuracy of 75%. Sacchet et al. [12] utilized DWI and machine learning techniques, specifically SVM, to classify patients with MDD. They reported a classification accuracy of 71.88% in distinguishing MDD patients from HCs based on whole-brain graph metrics. Additionally, He et al. [48] investigate the small-world network properties in MDD patients. They found that abnormalities in the betweenness centrality of the right orbitofrontal gyrus and left superior frontal gyrus could effectively differentiate MDD patients with depressive features, achieving an accuracy of 81% [48]. In addition to the aforementioned studies, other researchers have also made significant progress in combining neuroimaging and machine learning. For instance, Zeng et al. [49] used convolutional neural networks to analyze fMRI data of MDD patients, with their model achieving a classification accuracy of 85% on the test set. This approach improved classification accuracy and efficiency by automatically extracting high-dimensional features. Moreover, Brodersen et al. [50] proposed a Bayesian multitask learning model that can simultaneously analyze neural activity data from multiple brain regions. Their study found that this multitask learning model achieved an accuracy of 82% in distinguishing between MDD patients and healthy individuals and was able to identify specific brain activity patterns associated with MDD. Overall, these studies indicated that combining neuroimaging data with advanced machine learning techniques can significantly improve the classification accuracy between MDD patients and HC and help reveal the neurobiological mechanisms of MDD.
Although there has been an increasing amount of neuroimaging research on MDD, the application of AFQ–based machine learning methods in this field is still relatively limited. Existing studies have attempted to distinguish between MDD patients and bipolar disorder patients by analyzing FA metrics extracted from AFQ using SVM, but the accuracy was only 68.33%, and this study did not directly classify MDD patients from HC. Our research introduced the AD parameter and combined it with the FA parameter to construct a more refined model. This integrated model demonstrated higher accuracy (85.00%), sensitivity (83.33%), and specificity (87.50%) in the test set, significantly outperforming single-parameter models. This outcome highlighted the importance and effectiveness of using multiparameter fusion models in MDD diagnosis. The combined use of FA and AD parameters provides a more comprehensive view of the integrity of white matter microstructure, which helps to uncover the potential, more synergistic pathological changes in the brains of MDD patients. By integrating AFQ with the SVM algorithm, this study further validates the potential of machine learning techniques in neuroimaging research for mental disorders. Specifically, machine learning can better reveal patterns and connections that traditional analysis methods might overlook when dealing with high-dimensional and complex datasets.
The combined use of AFQ and machine learning techniques has shown potential in studying the integrity of brain white matter in various diseases and developing predictive models for disease classification. Despite this, our study has several limitations. First, the current sample size is relatively small, and future large-sample, multicenter collaborative studies could further advance this research direction. Second, AFQ primarily focuses on 20 major white matter fiber tracts, but there may be other regions not included that also contain important information. Understanding the neuropathological mechanisms of MDD requires exploration of more white matter regions. Third, exploring other advanced machine learning algorithms could further improve the diagnostic performance of the model. Last, this study employed a cross-sectional design and did not delve into the relationship between changes in imaging characteristics and the progression of the disease or symptom severity in patients. These limitations provide directions for future research to address.
5. Conclusions
This study utilized high-precision AFQ technology to identify changes in white matter fiber tracts, including the cingulum bundle, the splenium of the CC, the right IFOF, and the left arcuate fasciculus in MDD. Combining FA and AD improved the accuracy of distinguishing MDD from HC. Notably, abnormalities in the cingulum bundle and the splenium of the CC proved highly valuable for identifying MDD. These findings provide objective and visual evidence for the application of neuroimaging techniques in more precise individualized diagnosis of MDD in future clinical practice.
Conflicts of Interest
The authors declare no conflicts of interest.
Author Contributions
Sen Li: data curation, validation, writing–original draft. Yinghong Xu: data curation, formal analysis, investigation, validation. Jian Cui: conceptualization, data curation, formal analysis, funding acquisition, investigation, project administration, resources, supervision. Kun Li: investigation, methodology, project administration, resources, software, supervision. Shanling Ji: formal analysis, investigation, methodology, software, visualization. Hailong Shen: data curation, investigation, methodology, software. Yu Wan: data curation, investigation, methodology, software. Chunyu Dong: data curation, investigation, methodology, software. Hao Zheng: data curation, investigation, methodology, software. Wanru Qiu: data curation, investigation, methodology, software. Liangliang Ping: methodology, project administration, resources, software, supervision, validation. Hao Yu: conceptualization, funding acquisition, supervision, validation, visualization, writing–review and editing. Cong Zhou: conceptualization, funding acquisition, methodology, project administration, supervision, validation, writing–review and editing.
Funding
This study was supported by the Ministry of Education Industry-University Cooperative Education Project (220900242232529), the Medical and Health Science and Technology Development Plan of Shandong Province (202003061210, 202203090679, and 202304011343), the Key Research and Development Plan of Jining City (2021YXNS024), the Cultivation Plan of High-level Scientific Research Projects of Jining Medical University (JYGC2021KJ006), the National Natural Science Foundation of China (81901358), the Natural Science Foundation of Shandong Province (ZR2019BH001 and ZR2021YQ55), the Young Taishan Scholars of Shandong Province (tsqn201909146), and the Supporting Fund for Teachers’ Research of Jining Medical University (600903001).
Acknowledgments
The authors would like to acknowledge the participants in this study and the clinicians for their significant contribution.
Supporting Information
Additional supporting information can be found online in the Supporting Information section.
Open Research
Data Availability Statement
All quantitative subject data have been deposited in Figshare, which are publicly accessible (https://figshare.com/articles/dataset/quantitative_subject_data_xlsx/27940614).


