Therapeutic Efficacy of Reward Circuit-Targeted Transcranial Magnetic Stimulation (TMS) on Suicidal Ideation in Depressed Patients: A Sham-Controlled Trial of Two TMS Protocols
Abstract
Background: Suicide is one of the leading causes of premature death, and dysfunctional reward processing may serve as a potential mechanism. However, effective treatment targeting reward circuits is rarely reported.
Objective: The present study investigated the therapeutic efficacy of two individualized protocols, repetitive transcranial magnetic stimulation (rTMS) and intermittent theta burst stimulation (iTBS), targeting the left dorsolateral prefrontal cortex (lDLPFC)–nucleus accumbens (NAcc) circuit on suicidal ideation among patients with major depressive disorder (MDD).
Methods: Here, 40 healthy controls (HCs) and 70 MDD patients (MDDs) were recruited for this double-blinded, sham-controlled clinical trial. The reward learning process during the Iowa gambling task (IGT) was initially measured at the baseline. Further, 62 MDDs were assigned to receive 15 daily sessions of individualized rTMS (n = 25), iTBS (n = 15), or sham treatment (n = 22) to the site of strongest lDLPFC–NAcc connectivity.
Results: We found MDDs demonstrated abnormalities in both IGT performance and reward-associated event-related potential (ERP) components compared to HCs. MDDs in the rTMS and iTBS groups showed significant improvements in suicidal ideation and anhedonia symptoms compared to the sham group. The rTMS group also exhibited a more negative-going N170 and feedback-related negativity (FRN) after treatment, and the increase in N170 absolute amplitude posttreatment showed a trend of correlation with improved Temporal Experience Pleasure Scales (TEPSs) and TEPS-anticipatory (TEPS-ant) scores.
Conclusion: The current study indicates that reward circuit-based rTMS and iTBS showed comparable antisuicidal effects in depressive patients, suggesting that the lDLPFC–NAcc pathway may serve as a potential treatment target.
Trial Registration: ClinicalTrials.gov identifier: NCT03991572
1. Introduction
Suicidal ideation is a strong predictor of subsequent completed suicide [1], which accounts for almost 1 million deaths globally every year [2]. Reward learning deficits may serve as one potential mechanism of suicidal ideation. Suicidal individuals have demonstrated deficits in mental representations of the future and associated action evaluation [3], resulting in an exaggerated preference for immediate but smaller rewards over larger delayed rewards [4]. In other words, suicidal individuals failed to adjust their behavior based on the outcomes of rewards and punishments [5], often making impulsive and disadvantageous decisions [6]. Consistent with these findings, suicidal ideation shows a strong association with anhedonia [7–9], a clinical symptom observed in patients with major depressive disorder (MDD) [10, 11], which is also characterized by reward system dysfunction. Thus, targeting the reward learning process in MDD patients (MDDs) with anhedonia may produce a therapeutic effect on suicidal ideation.
Brain imaging studies suggest the reward learning deficits in depression are related to aberrant activity within a network comprising the dorsolateral prefrontal cortex (DLPFC), ventral striatum (including the nucleus accumbens [NAcc]), amygdala, and hippocampus [12–15]. The NAcc acts as a core center for the evaluation of reward by integrating inputs from cortical and other subcortical regions [16], while the prefrontal cortex (PFC) exerts top-down control over information processing within the NAcc [17]. Neuroimaging studies have further found that NAcc activation is related to reward stimulus salience and that activity is subsequently projected to the DLPFC, which participates in response selection and influences other subcortical regions involved in reward-based learning and decisions [18, 19].
Effective and targeted interventions for suicidal ideation are crucial for specific populations, such as Chinese older adults in primary care settings, where depression often goes unrecognized [20], but the prevalence of suicidal ideation is notably high [21]. Antidepressant medications are typically the first choice for treating depression and related suicidal behaviors in clinical practice. However, there is a high degree of uncertainty regarding the effects of new-generation antidepressants such as mirtazapine, duloxetine, and vilazodone on suicide-related outcomes compared to placebo [22], with some studies even reporting increased risk on medication [23, 24]. Therefore, alternative treatment strategies may be required to reduce suicide risk in MDDs. The DLPFC–NAcc circuit may serve as an effective treatment target for reducing suicide ideation due to its crucial functions in reward learning, suggesting transcranial magnetic stimulation (TMS) as a potential intervention. TMS can modulate neural circuit excitability and plasticity noninvasively, and we previously found individualized 10 Hz repeated-TMS (rTMS) targeting the left-DLPFC (lDLPFC) site with strongest functional connectivity to the NAcc effectively modulated reward-related processing [25]. In addition to traditional continuous TMS, a protocol using high-frequency bursts repeated at the theta frequency [26], termed intermittent theta burst stimulation (iTBS), has demonstrated effective treatment efficacy for MDDs [27] but with a significantly shorter stimulation time (3–4 min for 600 pulses). Previous studies showed it to be a more time-efficient protocol with comparable efficacy to conventional rTMS for improving depression levels [28, 29], but whether it also shows comparable treatment effectiveness on suicidal ideation as rTMS is relatively unknown.
Event-related potentials (ERPs) can effectively monitor dynamic reward-related psycho-cognitive processes with high temporal resolution. Previous ERP studies on suicide-related behaviors have primarily focused on feedback-related negativity (FRN) [30–32], also called reward positivity (RweP). The FRN is a negative deflection that peaks ~300 ms after receiving reward-related feedback (loss or win), and negative bias is more prevalent when participants encounter a loss than when gaining a reward. Reward insensitivity and increased depressive symptomatology in young adults are associated with blunted FRN [33, 34]. Similarly, the feedback-p3 (Fb-p3), an ERP waveform originating from central and posterior brain regions closely associated with reinforcement magnitude and reward evaluation [35, 36], was reduced in response to positive feedback among MDDs at high suicide risk compared to patients at low-risk [37]. In addition to these two classic reward-related ERP components, the earlier N170 may be a convenient electrophysiological biomarker for reward processing as it shows a priming effect in response to reward [38]. The N170 component is characterized by bilateral temporal negative deflections peaking around 170 ms following the presentation of human or cartoon faces [39] and has been linked not only to the basic construction of face structural representations [40] but also to the interactive processing of facial encoding and higher-level information processing at the early perceptual stage [41], with more efficient encoding observed for stimuli associated with reward [42].
The primary objective of the current study was to compare the antisuicidal effects of reward circuit-targeted 10 Hz rTMS and iTBS in MDDs with anhedonia. Additionally, we investigated differences in underlying neurophysiological mechanisms reflected by N170, FRN, and Fb-p3 amplitudes.
2. Methods
2.1. Participants
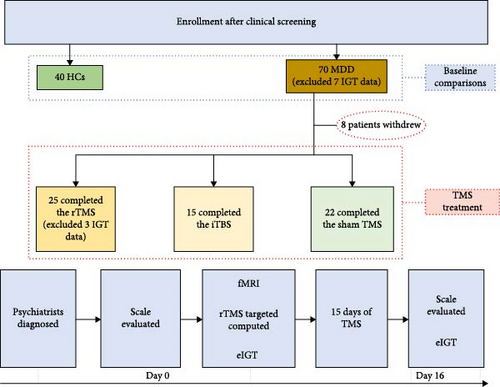
To ensure we recruited enough MDDs to compare the efficacy of the two TMS protocols, we used Power 3.1 [43] to calculate the required sample size for the treatment groups. With an alpha level of 0.05, a statistical power of 0.95, and a medium effect size of 0.25 (f = 0.25), the power analysis indicated a total sample size of 66 for detecting a group-by-time interaction effect. We further expanded it to 70, considering the potential data loss and drop-out. Initially, there were 70 MDDs (39 females, 21.70 ± 5.4 years of age) and 40 healthy controls (HCs) (16 female, 20.40 ± 1.5 years of age) were recruited in the current study (inclusion/exclusion criteria were described in Supporting Information I). All participants provided written informed consent after a full explanation of study goals and methods. Parent consent was obtained for participants under the age of 18 (n = 7). Three MDDs (n = 3) were unable to focused on the current Iowa gambling task (IGT) and terminated their participation prematurely, while four patients (n = 4) were excluded due to significant artifacts during EEG recording. Therefore, 63 MDDs and all 40 HCs were included for baseline comparisons. Further, one patient declined TMS treatment, remaining MDDs (n = 62) agreed to TMS treatment and were randomly assigned to three subgroups: rTMS (n = 25, 16 female, 21.08 ± 5.8 years of age), iTBS (n = 15, 10 female, 19.93 ± 3.2 years of age), and sham (n = 22, 10 female, 21.68 ± 5.1 years of age). Three patients (rTMS n = 3) were subsequently excluded from behavioral and EEG analysis due to significant artifacts during EEG recording, resulting in a final sample of 59 patients for EEG analysis (rTMS n = 22, iTBS n = 15, sham n = 22).
2.2. Research Materials and Procedure
The study protocol was reviewed and approved by the Institutional Ethics Committee of Anhui Medical University, Anhui, China (ethics code: 83220004). All study procedures conformed to the ethical principles outlined in the Declaration of Helsinki. A flow diagram of enrollment and experimental procedure is presented in Figure 1.
2.2.1. Clinical Assessments
The Chinese version of the Beck Scale for Suicide Ideation (BSI-CV) [44] was administered to assess the severity of suicide ideation. The BSI-CV consists of 19 items scored from 0 to 2, and participants are instructed to respond to each item occur to occurrence within the past week, yielding the BSI-W score, and during their most severe moment in the past, yielding the BSI-M score. In both cases, a greater score indicates a heightened intensity of suicidal ideation. Depression and anxiety were measured by the Beck Depression Inventory (BDI) [45], Hamilton Depression Rating Scale-17 items (HAMD-17) [46], and Hamilton Anxiety Rating Scale (HAMA-14) [47]. The Temporal Experience Pleasure Scale (TEPS) and Apathy Evaluation Scale (AES) were administered to assess the severity of participants’ anhedonia symptoms. The TEPS yields three scores: TEPS-all, TEPS-consummatory (TEPS-con), and TEPS-anticipatory (TEPS-ant).
2.2.2. IGT
The revised electrophysiological IGT [48] was used to monitor the reward learning process and underlying reward-related ERP responses of each subject. A total of 300 trails were divided equally into six blocks. Two visual stimuli (“50” and “100”) with different win probabilities were presented in each trail, and participants were instructed to win as much money as possible with an initial amount of 1000 yuan. The procedural details were described in Supporting Information II.
2.3. Connectivity-Based TMS
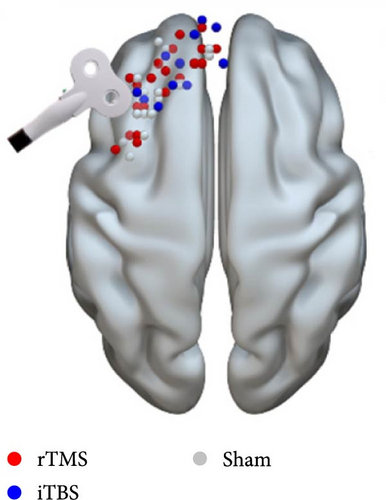
To achieve the optimal stimulation site over the lDLPFC with the strongest functional connectivity with the NAcc, resting-state functional MRI (fMRI) scans were obtained from all patients. First, we defined regions of interest (ROIs) in standard space using the Montreal Neurological Institute (MNI) template or the spherically defined coordinates of the NAcc ([10, 8, –8], 3 mm radius) and lDLPFC from the Brodmann Atlas (BA46 and BA9) [49]. Second, resting-state fMRI data and the structural (T1-weighted) MRI scan in MNI space were used to calculate the individual DLPFC coordinate in native space (1 × 1 × 1 mm3 voxel size) where the NAcc exhibited the strongest positive functional connection to the lDLPFC ROI. The inverse transformation was then applied to NAcc and lDLPFC. Finally, a small sphere of radius 3 mm centered at this most positive site was defined as the target using TMStarget [50] and SPM12 software (www.fil.ion.ucl.ac.uk/spm). This target was then introduced into the stereotactic neuronavigational software (Brainsight; Rogue Research).
2.3.1. Implements of TMS
TMS was performed using a Magstim Rapid2 transcranial magnetic stimulator (Magstim Company, Whitland, UK) with a 70-mm air-cooled figure-of-eight coil. The coil was maintained horizontally, with its center positioned over the target area. Prior to TMS or sham treatment, the resting motor threshold (RMT) was determined to set the appropriate TMS intensity. Briefly, RMT was defined as the minimum stimulus intensity delivered by the TMS coil to the motor cortex area of the thumb short adductor muscle in the resting state at which the motor-evoked potential at the contralateral thumb was >50 μV in more than five out of 10 trials. Patients assigned to the rTMS group received 10 Hz TMS at 100% of RMT, consistent with other rTMS studies [51, 52]. Each patient received a total of 3000 pulses over 25 min, delivered in 30 trains of 1 s on, 4 s off, repeated 10 times. The iTBS protocol was identical to that used by Blumberger et al. [27], except we utilized 80% RMT instead of 120% RMT. This choice was made to maintain consistency with our previous work [53] and is also supported by its use in other research, such as the study by Bulteau et al. [28] on treatment-resistant unipolar depression. Stimuli were delivered as 50 Hz trains repeated at 5 Hz for 2 s, repeated in 8 s intervals (600 pulses over 3 min and 9 s). For sham stimulation, a placebo coil (Magstim Company, Whitland, UK) was used that produced a similar ringing sound and sensation on the scalp as the active coil.
2.4. EEG Recording and Analysis
The EEG was recorded during IGT trials using a 64-channel Neuroscan recording system (Neuro Scan, Sterling, VA, USA) with electrodes configured according to the extended international 10–20 system. The online recording details and preprocessing analysis were described in Supporting Information III. ERPs were time-locked to feedback stimulus presentation, and temporal ROIs were defined based on previous studies. The N170 component was calculated in the 140–200 ms time window at the POZ electrode site as it originates from the occipitotemporal region [54]. FRN with the largest amplitude was observed at frontocentral midline electrodes Fz, FC1, FC2, and Cz [55]. We identified the most negative peak within the time window 170–260 ms and the most positive peak within the time window 140–210 ms after the onset of feedback according to Thoma et al. [56] and calculated the FRN amplitude as the peak difference (negative minus positive). The Fb-p3 responses were computed from the POZ electrode site within the time window of 300–450 ms after feedback onset [57]. The average amplitude of each ERP response was employed because it is beneficial for removing noise fluctuation [58].
2.5. Statistical Analysis
All data were analyzed using IBM SPSS Statistics (Version 22.0, IBM, Armonk, NY, USA). Demographic information, baseline psychometric variables, and IGT performance at baseline were compared between MDD and HC groups by analysis of variance (ANOVA), independent samples t-test, or χ2-test as indicated. Electrophysiological parameters recorded during the first IGT were compared by three-way repeated-measures ANOVA.
To evaluate the therapeutic effects of TMS, we first compared baseline demographic information, clinical symptoms, and e-IGT performance across rTMS, iTBS, and sham groups using the χ2-test and ANOVAs. Clinical and behavior outcomes were analyzed by two-way ANOVAs. The associated EEG data records were analyzed by four-way repeated measures ANOVA with time, trial risk, and feedback as within-subject factors and treatment group as a between-subject factor. The associations between therapeutic changes (posttreatment minus pretreatment) in ERP indices and psychometric scores were evaluated using Pearson’s correlations. Multicomparisons and simple effects were corrected, if necessary, using the Bonferroni method. Greenhouse–Geisser correction was used to correct p values of repeated measures ANOVA. Effect sizes of t-tests and ANOVA models were quantified using Cohen’s d and partial eta squared (η2) values, respectively.
3. Results
3.1. MDDs Showed Worse IGT Performance and Abnormal ERP Responses Compared to HCs at the Baseline
There were no significant differences in demographic variables between MDD and HC participants (all p < 0.05, see Table S1). MDDs showed worse IGT performance and abnormal N170, FRN, and Fb-p3 response compared to HCs (see Figures S1–S4).
3.2. Effects of TMS Protocols
There were no significant differences in baseline demographic variables, clinical symptoms, IGT performance metrics, and ERP indices among rTMS, iTBS, and sham groups of MDDs except for the Fb-p3 component (see Table S2).
3.2.1. Both rTMS and iTBS Mitigated Suicidal Ideation and Anhedonia Symptoms in MDDs
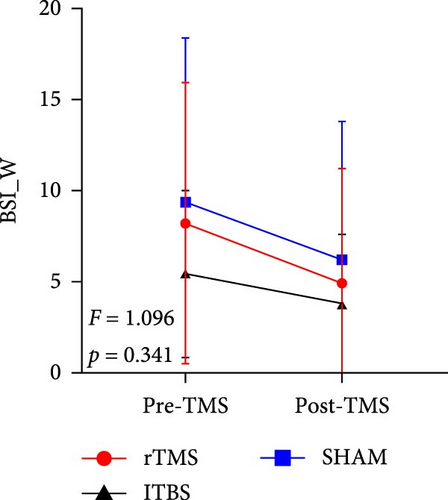
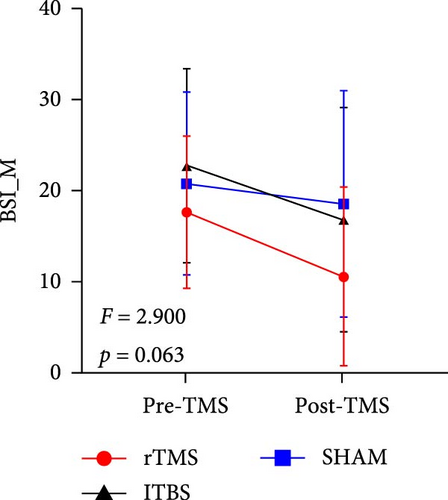
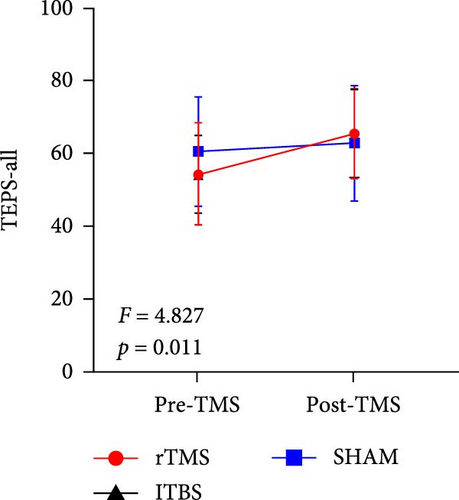
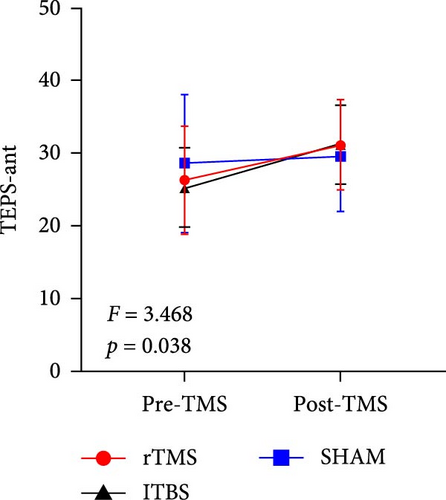
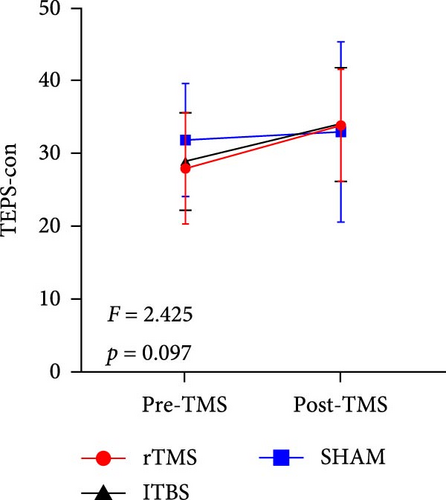
All descriptive statistics and test results comparing clinical symptoms across the three treatment groups are summarized in Table 1. A significant main effect of time (baseline vs. posttreatment) was found for all psychometric scale scores (all p < 0.001). No significant time × treatment group interaction effect was found for BSI_W score (F2,59 = 1.096, p = 0.3411, η2 = 0.036), while marginally significant time × treatment group interaction effects were found for BSI_M score (F2,59 = 3.485, p = 0.063, η2 = 0.090) and TEPS-con score (F2,59 = 2.425, p = 0.091, η2 = 0.076). Repeated measures ANOVA also revealed significant time × treatment group interaction effects on TEPS-all score (F2,59 = 4.827, p = 0.011, η2 = 0.141) and TEPS-ant score (F2,59 = 3.468, p = 0.038, η2 = 0.105). Bonferroni-corrected simple effects analysis revealed lower (improved) BSI_M scores after 15-days of rTMS (p < 0.001) and iTBS (p = 0.002) but no significant difference after sham treatment (p > 0.05). There were also no post–pre differences between the rTMS and iTBS groups (p > 0.05). Further, TEPS-all, TEPS-ant, and TEPS-con scores were significantly higher (improved) after both rTMS (all p < 0.001) and after iTBS (p < 0.001, p < 0.001, and p = 0.014, respectively), while again there were no significant changes in the sham group (all p > 0.05) (Figure 2). Additionally, no significant post–pre differences were found between the rTMS and iTBS groups (all p > 0.05).
| Measures | rTMS | iTBS | Sham | Factor time | Group × time interaction | ||||||
|---|---|---|---|---|---|---|---|---|---|---|---|
| Day 0 Mean (SD) | Day 15 | Day 0 | Day 15 | Day 0 | Day 15 | F | p | F | p | Effect size/η2 | |
| Clinical variables | |||||||||||
| BSI_W | 9.36 (7.94) | 5.16 (6.53) | 5.47 (4.60) | 3.80 (3.84) | 9.41 (8.97) | 6.23 (7.60) | 19.595 | <0.001 ∗∗∗ | 1.096 | 0.341 | 0.036 |
| BSI_M | 17.64 (8.33) | 10.64 (9.82) | 22.73 (10.37) | 16.87 (12.33) | 20.77 (10.05) | 18.59 (12.40) | 30.193 | <0.001 ∗∗∗ | 2.900 | 0.063 | 0.090 |
| BDI | 29.32 (11.81) | 20.88 (11.88) | 36.00 (8.39) | 22.67 (10.30) | 30.91 (9.79) | 21.64 (13.51) | 87.265 | <0.001 ∗∗∗ | 1.644 | 0.202 | 0.053 |
| HAMA | 14.04 (7.05) | 9.33 (4.78) | 14.33 (5.45) | 11.87 (7.38) | 13.00 (7.24) | 9.41 (8.05) | 30.483 | <0.001 ∗∗∗ | 0.957 | 0.390 | 0.032 |
| HAMD | 16.20 (6.28) | 9.52 (4.99) | 16.20 (5.81) | 11.93 (8.43) | 14.77 (7.16) | 10.50 (6.72) | 45.586 | <0.001 ∗∗∗ | 1.297 | 0.281 | 0.042 |
| TEPS-all | 54.24 (13.95) | 65.44 (12.36) | 54.20 (10.66) | 65.33 (12.15) | 60.50 (14.96) | 62.64 (15.85) | 32.772 | <0.001 ∗∗∗ | 4.827 | 0.011 ∗ | 0.141 |
| TEPS-ant | 26.32 (7.42) | 31.20 (6.16) | 25.33 (5.45) | 31.33 (5.38) | 28.64 (9.49) | 29.68 (7.61) | 24.133 | <0.001 ∗∗∗ | 3.468 | 0.038 ∗ | 0.105 |
| TEPS-con | 27.88 (7.65) | 33.84 (7.66) | 28.87 (6.69) | 34.00 (7.79) | 31.86 (7.72) | 32.96 (12.36) | 15.704 | <0.001 ∗∗∗ | 2.425 | 0.097 | 0.076 |
| AES | 52.84 (7.92) | 48.00 (9.50) | 51.93 (5.43) | 47.73 (7.12) | 50.95 (5.40) | 49.36 (6.84) | 20.940 | <0.001 ∗∗∗ | 1.865 | 0.164 | 0.059 |
| IGT performance | |||||||||||
| Total net score | 10.50 (3.68) | 21.83 (3.46) | 12.56 (4.46) | 11.07 (4.18) | 7.78 (3.68) | 21.33 (3.46) | 9.718 | 0.003 ∗∗ | 3.112 | 0.052 | 0.100 |
| Remaining money | 431.82 (1870.93) | 1429.55 (1559.58) | 563.33 (894.32) | 593.33 (1414.83) | 177.27 (1735.26) | 1422.73 (1313.55) | 10.276 | 0.002 ∗∗ | 2.194 | 0.121 | 0.073 |
| ERPs (μV) | |||||||||||
| N170 | |||||||||||
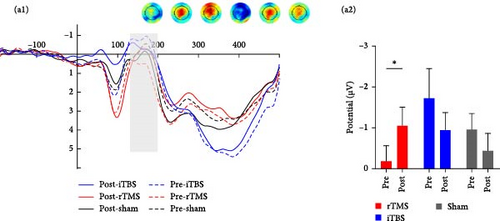
| Loss and high-risk | −0.36 (1.78) | −1.32 (3.37) | −2.03 (2.88) | −1.21 (1.83) | −1.30 (2.13) | −0.73 (2.16) | 0.284 | 0.596 | 3.932 | 0.025 ∗ | 0.123 |
| Win and high-risk | −0.33 (1.69) | −1.16 (2.97) | −2.06 (3.18) | −1.32 (2.01) | −1.01 (2.02) | −0.41 (2.06) | |||||
| Loss and low-risk | −0.01 (2.06) | −0.91 (2.67) | −1.64 (2.70) | −0.66 (1.60) | −0.88 (1.83) | −0.40 (2.22) | |||||
| Win and low-risk | −0.07 (1.83) | −0.72 (2.37) | −1.18 (2.52) | −0.62 (1.67) | −0.65 (1.93) | −0.25 (1.89) | |||||
| FRN | |||||||||||
| Loss and high-risk | −3.50 (2.37) | −5.78 (4.93) | −3.47 (2.18) | −3.42 (2.04) | −2.86 (3.10) | −3.54 (3.01) | 3.127 | 0.082 | 2.606 | 0.083 | 0.085 |
| Win and high-risk | −3.14 (2.89) | −3.98 (3.89) | −3.72 (1.91) | −3.10 (2.10) | −2.62 (2.72) | −3.24 (3.17) | |||||
| Loss and low-risk | −3.04 (2.05) | −4.59 (2.75) | −3.84 (2.11) | −3.95 (2.04) | −3.14 (2.10) | −2.69 (2.31) | |||||
| Win and low-risk | −2.57 (1.93) | −3.16 (2.86) | −2.56 (1.64) | −2.37 (2.29) | −2.31 (2.03) | −2.36 (2.31) | |||||
| P3 | |||||||||||
| Loss and high-risk | 2.03 (1.99) | 2.96 (2.23) | 3.57 (1.95) | 3.81 (2.70) | 2.34 (1.84) | 2.34 (1.84) | 0.206 | 0.651 | 0.109 | 0.897 | 0.004 |
| Win and high-risk | 2.61 (2.10) | 2.92 (2.08) | 4.61 (1.98) | 4.76 (3.18) | 2.86 (1.75) | 2.86 (1.75) | |||||
| Loss and low-risk | 1.78 (1.92) | 1.75 (1.45) | 3.49 (1.65) | 3.57 (2.25) | 2.31 (1.92) | 2.31 (1.92) | |||||
| Win and low-risk | 2.30 (1.55) | 2.06 (1.50) | 3.82 (1.89) | 3.66 (2.06) | 2.26 (1.58) | 2.26 (1.58) | |||||
- Abbreviations: AES, Apathy Evaluation Scale; BDI, Beck Depression Inventory; BSI_M, Beck Scale for Suicide Ideation_Most; BSI_W, Beck Scale for Suicide Ideation_Week; HAMA, Hamilton Anxiety Scale; HAMD, Hamilton Depression Scale; iTBS, intermittent theta burst stimulation; rTMS, repetitive transcranial magnetic stimulation; SD, standard deviation; TEPS-all, temporal experience of pleasure scale; TEPS-ant, temporal experience of anticipation pleasure scale; TEPS-con, temporal experience of consummatory pleasure scale.
- ∗p < 0.05; ∗∗p < 0.01; ∗∗∗p < 0.001.
3.2.2. iTBS Suppressed IGT Performance in MDDs
All IGT performance metrics at baseline and following the indicated treatments are summarized in Table 1. There were significant main effects of treatment on the total net score (F1,56 = 9.718, p = 0.003, η2 = 0.148) and remaining money (F1,56 = 10.276, p = 0.002, η2 = 0.155). There was also a marginally significant time × treatment group interaction effect on total net score (F1,56 = 3.112, p = 0.052, η2 = 0.100), and further simple analysis revealed a significantly greater total net score following rTMS (p = 0.007) and sham treatment (p = 0.007), but not following iTBS (p = 0.761).
3.2.3. rTMS Altered ERP Amplitudes in MDDs
3.2.3.1. N170
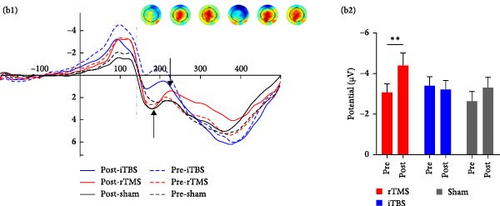
Repeated measures ANOVA revealed significant main effects of trial risk (F1,56 = 6.569, p = 0.013, η2 = 0.105) and feedback (F1,56 = 4.454, p = 0.039, η2 = 0.074) on N170 amplitude. There was also a significant time × group interaction effect on N170 amplitude (F2,56 = 3.932, p = 0.025, η2 = 0.123), and further Bonferroni-corrected simple analysis demonstrated a significantly more negative-going N170 following rTMS (p = 0.046), but not following iTBS or sham treatment (both p > 0.05) (Figure 3).
3.2.3.2. FRN
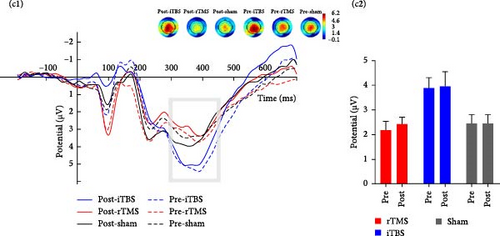
Repeated measures ANOVA revealed significant main effects of risk (F1,56 = 4.984, p = 0.030, η2 = 0.082) and feedback (F1,56 = 25.059, p < 0.001, η2 = 0.309) on FRN amplitude as well as a significant risk × feedback interaction effect (F1,56 = 4.084, p = 0.048, η2 = 0.068) and a significant risk × feedback × group interaction effect (F2,56 = 3.778, p = 0.029, η2 = 0.119). There was also a marginally significant group × time (F2,56 = 2.606, p = 0.083, η2 = 0.085) interaction effect, and post hoc analysis demonstrated a more negative-going FRN following rTMS posttreatment (p = 0.004) but not after iTBS and sham treatment (both p > 0.05) (Figure 3).
3.2.3.3. Fb-p3
Repeated measures ANOVA revealed significant main effects of risk (F1,56 = 12.891, p = 0.001, η2 = 0.187) and feedback (F1,56 = 7.201, p = 0.010, η2 = 0.114) on Fb-p3 amplitude as well as a significant risk × feedback interaction effect (F1,24 = 8.174, p = 0.006, η2 = 0.127) and risk × feedback × group interaction effect (F1,24 = 3.968, p = 0.024, η2 = 0.124), but no significant or marginally significant time × group interaction effect (p > 0.1) (Figure 3).
3.2.4. Correlations Between ERP Component and Anhedonia Symptom Changes After rTMS
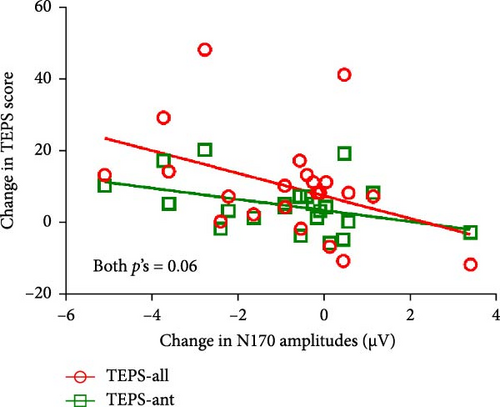
For patients receiving rTMS, there were marginally significant correlations between N170 amplitude alterations and changes in both TEPS-all score (r = −0.407, p = 0.060) and TEPS-ant score (r = −0.407, p = 0.060) (Figure 4). No other significant correlations were found (all p > 0.05) (see Figure S5).
4. Discussion
The present study suggested the current reward circuit-targeted rTMS and iTBS protocols showed comparable efficacy in improving both suicidal ideation (as evidenced by lower BSI_M score) and anhedonia symptoms (as indicated by higher TEPS-all, TEPS-ant, and TEPS-con scores) among MDDs. In addition, reward-related N170 and FRN responses were also modulated by rTMS following 15 consecutive days of treatment. The increase in N170 amplitudes was moderately correlated with improvements in TEPS-all and TEPS-ant scores.
To our knowledge, this is the first sham-controlled clinical trial showing the compatible antisuicidal effects of rTMS and iTBS in MDDs based on a connectivity-directed approach. Mehta et al. [59] also reported a similar antisuicidal effect between rTMS and iTBS. However, their findings were limited by the absence of a sham control arm. Another sham-controlled rTMS study delivered 18,000 pulses per day, a much larger daily stimulus dose than the current study, and still induced only a transient reduction in suicidal ideation [60]. Activity in the DLPFC is strongly associated with motivated reward-seeking behavior, and inhibitory γ-aminobutyric acid (GABA)ergic transmission by local interneurons has been linked to reduced suicidal ideation [61, 62]. The NAcc is generally hypoactive in patients with reward-related dysfunction [63], while enhanced activation was observed to alleviate clinical symptoms [64]. Thus, the improved suicidal ideation observed following rTMS and iTBS may be explained by the activation of (GABA)ergic interneuron transmission within the lDLPFC and optimal activation of the NAcc. Notably, an influential review published recently suggested an overcompensation effect of the DLPFC on hypoactive striatal responses to reward [65], indicating our lDLPFC-NAcc connectivity-directed TMS may help rebalance this process.
Reward-associated ERPs were also modulated by rTMS concomitant with clinical improvements, consistent with the notion that these abnormal ERPs reflect deficits in reward processing implicated in MDD etiology. The patient group exhibited abnormal N170 responses during the baseline IGT session, and unlike HCs, these responses did not differ significantly between win and loss trials. Previous ERP studies have reported similar findings [66–68]. As discussed in the Introduction, the N170 may reflect a stage in perceptual representation that integrates information from various sources, such as both fundamental facial characteristics (e.g., structure) and higher-order characteristics such as emotional expression and (in this specific instance) the association with reward information. Chen et al. [69] reported that N170 responses to faces with positive, neutral, and negative emotions were blunted in first-episode depression patients compared to HCs, suggesting that an abnormal N170 is indicative of impaired facial processing for all emotional valences in MDD. Notably, we found a significant increase in N170 amplitude in all trial types (regardless of risk and reward) after rTMS treatment, and these increases were moderately correlated with improvements in anhedonia symptoms. Similarly, Wei and coworkers [70] reported that rTMS normalized N170 amplitudes and hemispheric lateralization in Parkinson’s disease patients. Thus, the observed increase in N170 amplitude suggests that rTMS may have improved the processing of reward-related facial information among MDDs.
A pronounced frontocentral FRN appears following unanticipated feedback [71] or an incorrect outcome [72] with a magnitude that is independent of the size of the loss [73]. We observed a blunted FRN in MDDs at baseline, consistent with previous findings in depressed patients [56] and further supporting a contribution of reduced reward sensitivity to depression [74]. Beck et al. [75] also reported an association between blood-oxygen-level dependent (BOLD) responses in the ventral striatum and positive FRN signals, suggesting that FRN is partially generated by the striatum [76], while another study suggested that the FRN reflects a dopamine (DA)-driven teaching signal in frontostriatal reward learning circuitry [77]. A more negative-going FRN is associated with superior executive function [78] and stronger signaling of reward prediction error [79], which facilitates optimal choices in risky decision-making tasks. Albein-Urios and coworkers [80] previously reported that a brief 20-min transcranial direct current stimulation (tDCS) protocol enhanced FRN in a reversal-learning task. In the current study, MDDs exhibited elevated FRN responses during IGT after 15 consecutive days of rTMS of about the same duration. The more negative-going FRN may reflect improved DA signal transmission induced by the connectivity-based rTMS. This could be attributed to the strengthened reward sensitivity and reinforced expectancy of reward stimuli in ambiguous contexts.
In contrast to suicidal ideation and anhedonia symptoms, we found no significant effects on depressive or anxiety symptoms as measured by the HAMD and HAMA, respectively, compared to sham-treated patients. It is possible that this sham treatment induced a particularly strong placebo effect or that stable antidepressant drug responses during the experiment obscured the effects of TMS treatment [81]. We also found no effects of TMS on IGT performance or the Fb-p3 waveform. However, the e-IGT used consists of 300 trials and shows strong improvement with experience in the laboratory environment [82], which may again obscure a therapeutic effect. The Fb-p3 is thought to indicate the allocation of attentional resources for reward evaluation [83], but more importantly is highly reflective of self-relevant information processing [84]. The unchanged Fb-p3 may thus be explained by the targeted stimulation pathway (lDLPFC–NAcc), which is less involved in self-relevant information processing.
Although a significant reduction in suicidal ideation was observed, iTBS did not modulate reward-related ERP components. This may suggest a distinct therapeutic action, potentially affecting a broader network. Intermittent TBS applied to the left PFC generates neuronal excitation [29] and even facilitates cortical excitability to a greater extent than traditional rTMS. Klooster et al. [85] investigated the effect of accelerated iTBS on brain network topology by graph analysis and found that the nodes showing significantly different responses to active and sham stimulation were not restricted around the stimulated site but rather but spread throughout the whole brain. Another study adopting graph theory for network mapping also found an increased clustering coefficient in the beta band after continuous TBS [86]. A similar global stimulation effect has also been suggested for electroconvulsive therapy [87].
This study has several limitations. First, we did not conduct follow-up psychometric or behavioral tests due to participant time constraints, leaving the duration of the observed effects undetermined. Furthermore, we did not control for medication due to ethical requirements, but we minimized its impact on experimental results by ensuring that each patient’s antidepressant medication regimen remained unchanged from 2 weeks before the study until completion. Finally, we still know little about the functional changes in the DLPFC–NAcc circuit induced by TMS. Therefore, functional neuroimaging studies on DLPFC–NAcc circuit activity during TMS are warranted.
5. Conclusions
This sham-controlled clinical trial demonstrates that both individualized rTMS and iTBS targeting the DLPFC–NAcc pathway can significantly reduce suicidal ideation and anhedonia in MDDs. In addition, rTMS appeared to effectively modulate reward processing, as evidenced by changes in reward-associated ERPs. Alternatively, the effects of iTBS may involve distinct neural mechanisms compared to 10-Hz rTMS. These findings reveal the comparable antisuicidal effects of the current rTMS and iTBS protocols, suggesting that the lDLPFC–NAcc pathway may serve as a potential treatment target for suicidal ideation. However, further research is needed to confirm the causal relationship and the mechanism underlying iTBS.
Conflicts of Interest
The authors declare no conflicts of interest.
Author Contributions
Fengqiong Yu, Yanghua Tian, and Kai Wang: conceptualization. Xinyu Huang, Ya Fang, Chunhua Xi, Xin Wang, Shu Zhang, Ziying Li, Yuqiu Cui, Yang Guo, and Jingyi Zhang: data acquisition. Xinyu Huang, Rong Ye, Gong-jun JI, Yuejia Luo, and Xiaofen Chen: methodology. Xinyu Huang and Ya Fang: writing–original draft. Rong Ye, Fengqiong Yu, Chunyan Zhu, Kai Wang, and Yanghua Tian: writing–review and editing. Xinyu Huang and Fengqiong Yu: formal analysis. Fengqiong Yu, Yanghua Tian, and Kai Wang: funding acquisition. Xinyu Huang, Chunhua Xi, and Ya Fang contributed equally to this work and are cofirst authors.
Funding
The study was supported by the National Natural Science Foundation of China (32371134), Natural Science Foundation of Anhui Province (2022AH050678), Key Project of the Translational Medicine Project of Anhui Province (2021zhyx-C29), Anhui Medical University Basic and Clinical Cooperative Research Promotion Program (2022sfy001), Provincial Quality Engineering Project of Anhui Province Colleges and Universities (2022jyx), and Anhui Province Clinical Medical Research Transformation Special Project (202204295107020006 and 202204295107020028).
Supporting Information
Additional supporting information can be found online in the Supporting Information section.
Open Research
Data Availability Statement
The data are available on request from the corresponding authors, but not publicly available due to the protection of participant privacy.


