Analysis of Violence Patterns in Mexico: A Complex Temporal Networks Approach
Abstract
Violence in Mexico presents a significant challenge to public safety and social stability and requires a comprehensive understanding of its temporal dynamics. This study uses a complex temporal networks approach to analyze patterns of violence across municipalities, focusing on crimes such as homicide, sexual assault, discrimination, and armed robbery. Using data spanning 6 years (2015–2021), this study builds temporal networks to find fundamental patterns and trends in violence. Then, using advanced network analysis techniques, including robustness assessment and influence quantification, key influential municipalities were identified within the violence network. The findings of this research can offer valuable information to carry out specific interventions and resource allocation strategies to improve public safety in Mexico.
1. Introduction
Violence in Mexico remains a popular challenge that critically impacts public safety and societal cohesion. The wide range of violent activities, including homicides, assaults, kidnappings, drug trafficking, and organized crime, reflects a complex issue deeply rooted in the country’s socioeconomic activity. Studying this challenge requires innovative analytical methods capable of discover the multifaceted dynamics of violence.
Recent research highlights the need to develop advanced methodologies different to traditional statistical approaches and conduct a more detailed exploration of the factors that promote violence.
Against this background, this study adopts a novel temporal social network analysis framework, where each node represents a municipality, and each one is characterized by a vector detailing the occurrence of specific types of crimes within its jurisdiction.
Thus, this vector representation enables a quantitative comparison of criminal activity between municipalities, capturing the magnitude of various crimes—such as homicides, robberies, and discrimination—across different locations. The interconnection of municipalities within the network is determined not only by their geographical proximity but also by the similarity of their crime profiles, measured using the Mahalanobis distance. Unlike the Euclidean distance, Mahalanobis accounts for correlations between variables and scales the data appropriately, making it particularly suitable for comparing multidimensional crime data distributions. For more details on this modeling process, please refer to [1–4].
This approach allows for a detailed view of the spatial and relational dynamics of violence, offering insights into how different types of criminal activities are distributed and interconnected in Mexico. Thus, by analyzing the structure of the network, this study aims to identify patterns of violence proliferation, identify critical nodes in the network, and evaluate the influence of specific municipalities about the general panorama of violence.
This interdisciplinary effort combines insights from criminology, sociology, and network science to address the complexities of violence. It aims to provide policymakers, law enforcement agencies, and other stakeholders with a comprehensive analysis that can inform targeted interventions and strategic resource allocation to mitigate violence and improve public safety (Figure 1).
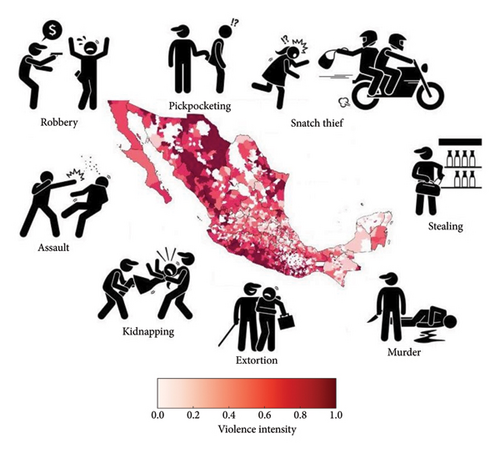
This paper is structured as follows: Section 2 presents a review of related work. Section 3 details the methodology, including the construction of violence networks, as well as the optimization models used to evaluate the robustness and influence of the network. Section 4 analyzes the findings, focusing on the identification of critical municipalities and the evaluation of their impact on patterns of violence. Finally, Section 5 presents the conclusions obtained during the development of this study, summarizing its contributions to the field and highlighting possible implications for future research and policy development.
2. Related Work
The study and analysis of violence patterns is a crucial area of research across various socioeconomic and political contexts worldwide. In the case of Mexico, understanding the dynamics of violence has become an increasingly relevant topic due to its significant impact on public safety, social stability, and economic development.
Most research in this field [1, 2, 6–12] employs a wide range of methodological approaches and academic disciplines, reflecting the complexity of violence and the diverse factors influencing its manifestation. From epidemiological studies aimed at identifying spatial and temporal patterns of different types of crimes to sociological analyses exploring the root causes of violence in specific communities, the state of the art provides a multifaceted perspective on this critical issue.
Moreover, the advent of new technologies and analytical techniques, such as complex networks and machine learning models, has revolutionized the study of violence [9–11, 13]. These tools enable researchers to examine the dynamic interactions between individuals, groups, and entities in both temporal and spatial contexts, offering deeper insights into the evolving nature of violence. This enhanced understanding can inform policy development and support the design of preventive intervention strategies aimed at mitigating violence and improving public safety.
2.1. Traditional Approaches to Studying Criminal Networks
Previous studies have applied network analysis to criminal organizations, demonstrating how key individuals influence crime dynamics [14, 15].
In the area of criminology and law enforcement, traditional methodologies for analyzing criminal networks, particularly those involved in activities such as drug trafficking and terrorism, have predominantly focused on Social Network Analysis (SNA). Technologies and analytical techniques, such as complex networks and machine learning models, have revolutionized the way we approach the study of violence. These studies typically involve parsing through extensive volumes of data extracted from sources such as prison or tribunal transcripts to construct organizational charts or social network diagrams of individuals suspected of involvement in illicit networks. Such analyses aim to evaluate the centrality of key individuals within these networks, providing information about their roles, importance, and relationships [6–8, 11, 13].
2.2. Challenges With Traditional Approaches
Despite their widespread use, traditional SNA approaches encounter several critical challenges, particularly regarding the use of data derived from criminal justice records. One of the primary challenges lies in the inherent limitations and inaccuracies associated with such data. These issues may include intentional distortions, such as aliases or falsified information provided by individuals, as well as unintentional errors, including transcription mistakes. Such inaccuracies can compromise the reliability and integrity of the analysis.
Furthermore, defining the boundaries of these networks exclusively from the perspective of law enforcement or prosecution agencies may not always align with how network members themselves perceive their relationships. This discrepancy introduces complexities in understanding network dynamics and interactions [7].
2.3. Emerging Approaches: Complex Systems Perspective
In response to the limitations of traditional methodologies, there has been a growing advocacy for adopting a complex systems perspective in the study of criminal networks. This approach recognizes the intricate, dynamic, and highly interconnected nature of these networks, emphasizing key concepts such as heterogeneous and evolving agents, interaction patterns, unpredictability, emergence, and context dependency.
By embracing this perspective, researchers aim to overcome the shortcomings of traditional methods and gain deeper insights into the structure, resilience, and adaptability of criminal networks. In addition, this approach enhances the evaluation of intervention strategies, providing a more comprehensive understanding of their potential effectiveness in disrupting criminal organizations [13].
2.4. Incorporating Complexity Into Evaluation Practices
Moreover, there is a growing recognition of the need to incorporate complexity into evaluation practices when assessing interventions targeting criminal activities. Traditional assessment methods, which are often linear and reductionist, may overlook the multifaceted dynamics inherent in criminal networks and the full impact of interventions.
Recent efforts advocate for the integration of complex systems approaches into evaluation frameworks, treating interventions as potential disruptors within complex social systems. This perspective provides a more comprehensive understanding of intervention effectiveness by emphasizing the interconnectedness of various factors and the emergent properties that arise within dynamic social contexts [2, 12].
2.5. Implications and Recommendations
The shift toward complex systems perspectives in studying criminal networks and evaluating interventions has significant implications for both research methodology and practice. Researchers are encouraged to adopt more flexible and adaptive approaches, integrating diverse data sources and leveraging advanced analytical techniques to better navigate the intricacies of criminal networks.
Moreover, there is a critical need to improve data collection and preparation processes, ensuring the reliability, accuracy, and integrity of data extracted from criminal justice records. Strengthening these aspects is essential for conducting robust analyses and evaluations, ultimately enhancing the effectiveness of intervention strategies [7, 13].
3. Materials and Methods
This section details the methodology employed to analyze violence characteristics across municipalities, focusing on homicides, sexual assaults, discrimination, and armed robberies. The approach involves calculating Mahalanobis distances to measure dissimilarity between pairs of municipalities over the study period (2015–2021). These distances serve as the basis for constructing a network representing similarities in crime patterns among municipalities over time (for more information about the modeling, please visit [1]). In addition, robustness assessment and identification of influential nodes within the network are conducted using mathematical models adapted for temporal networks. This comprehensive methodology aims to provide insights into crime dynamics, optimize resource allocation, and inform evidence-based policy planning.
3.1. Materials
This analysis focuses on understanding the characteristics of violence across municipalities, with particular emphasis on homicides, sexual assaults, discrimination, and armed robberies.
To measure the similarity between municipalities, we calculate the Mahalanobis distance for each pair of municipalities during each year of the study period (2015–2021). This process generates a distance matrix, where each entry represents the similarity between the violence characteristics of two municipalities for a given year.
Once these distances are obtained, we compute the median value and use it as a threshold to construct a violence similarity network. Municipalities with a distance lower than the median are connected by an edge, creating a network that reflects how municipalities with similar violence patterns are interconnected over time.
The representation of this network can take different forms. It can be structured as a three-dimensional tensor, as described in [1, 12, 13], where two dimensions correspond to municipalities and the third dimension represents time. Alternatively, it can be represented as a list of timestamped edges, as explained in [13], where each edge denotes a connection between two municipalities at a specific point in time.
In addition to constructing the network, we incorporated crime incidence data from government sources and INEGI [9, 10] to ensure a comprehensive representation of crime patterns across municipalities.
Specifically, Mahalanobis distances () between municipality i and municipality j were calculated to evaluate the similarity in violence characteristics among municipalities.
Figure 2 shows the graphical representation of the adjacency tensor.
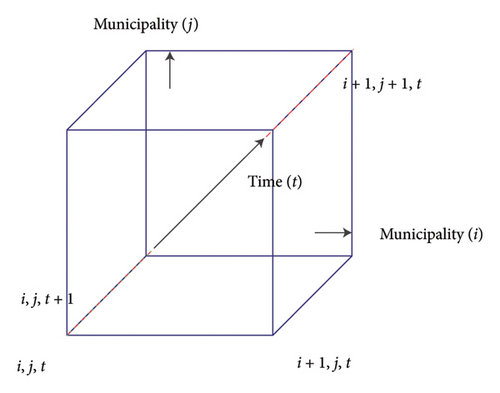
In Figure 2, nodes represent municipalities at different times, with connections indicating similarities in violence characteristics. The labels i, j, and t denote spatial and temporal dimensions. The dashed red lines show connections within the same year, and dotted green lines indicate connections across years.
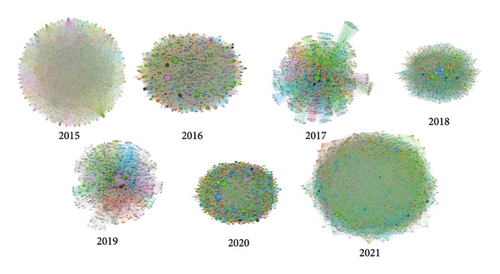
Furthermore, we observe how the temporal network connects municipalities based on similarities in violence patterns over the years. This structure provides a comprehensive view of the evolution and interdependence of these regions. To gain further insights, we can decompose the temporal network into yearly networks, where each layer represents the state of connections for a specific year.
Then, the networks (monolayer) can be seen as follows (Figure 3).
- •
2015: in 2015, the network exhibits characteristics of a small-world network, with clusters of closely connected nodes and some longer-range connections facilitating global integration.
- •
2016: similar to 2015, the network in 2016 maintains small-world characteristics, with dense local clustering and efficient global communication pathways.
- •
2017: the 2017 network shows features of a scale-free network, characterized by a few highly connected nodes acting as hubs, influencing the network’s overall structure and dynamics.
- •
2018: in 2018, the network continues to resemble a small-world network, with clusters of interconnected nodes and short paths between them, fostering efficient information transmission.
- •
2019: similar to 2017, the 2019 network displays scale-free properties, with a small number of highly connected nodes exerting significant influence over network dynamics.
- •
2020: the 2020 network, like its predecessors, reflects small-world characteristics, with densely connected clusters and short average path lengths enabling rapid information dissemination.
- •
2021: lastly, the network in 2021 maintains small-world attributes, with tightly knit local communities interconnected by a few longer-range connections, promoting efficient communication across the network.
Each of these monolayer networks contributes to the overall structure and dynamics of the temporal network, representing snapshots of municipality interconnections and crime pattern similarities for their respective years.
3.1.1. Public Availability of Data
- •
Government of Mexico. August 2023. Datos Abiertos de Incidencia Delictiva. Retrieved from https://www.gob.mx/sesnsp/acciones-y-programas/datos-abiertos-de-incidencia-delictiva [9].
- •
Instituto Nacional de Estadística y Geografía (INEGI). August 2023. Gobierno, Seguridad y Justicia: Incidencia Delictiva. Retrieved from https://www.inegi.org.mx/temas/incidencia/ [10].
These sources provide open-access data that are freely available for research and public use. The datasets were instrumental in capturing crime patterns across municipalities in Mexico for the study period.
3.2. Methods
Robustness in complex networks aims to understand how a network responds to and recovers from adverse events, such as node losses or disruptions in temporal edges or links.
In the context of a violence network, it is imperative to assess robustness and identify influential nodes due to their crucial role in prevention and mitigation efforts. The findings of this research hold the potential to optimize resource allocation, facilitate evidence-based public policy planning, and enable the early detection of concerning trends.
Furthermore, it assists in refining emergency response strategies and provides valuable insights into the fundamental dynamics of violence, which are essential for addressing its root causes and enhancing public safety in affected communities.
3.2.1. Robustness
To analyze the robustness of the violence network, we employ a mathematical model derived from the original methodology introduced in [3], which has been adapted to operate effectively on temporal networks. This model aims to identify a minimal set of separator nodes, denoted as S, while adhering to specific constraints and maximizing the size of nonseparator sets (VS) for each timestamp.
Equation (2) ensures that every vertex v in the set Vt at timestamp t must belong to either the separator set St or the nonseparator set Vt∖St. Equation (3) guarantees that the combination of the separator set St and the nonseparator set Vt∖St include all nodes into the set Vt at timestamp t. Lastly, equation (4) enforces that if an edge (u, v) exists at timestamp t, where vertex u belongs to the separator set and vertex v belongs to the nonseparator set, there should be no direct connection between vertices u and v.
3.2.2. Influential Nodes
In addition to robustness assessment, quantifying influence within the network is crucial for understanding its dynamics and identifying key nodes that shape its behavior over time. To achieve this, we employ an adaptation of a mathematical model introduced in our earlier work [4]. This model provides insights into identifying influential nodes within the violence network, which play pivotal roles in shaping its dynamics and connectivity over time.
Based on the mathematical model presented in [3], we introduce an objective function (5) aimed at minimizing the system’s total kinetic energy. This objective function incorporates terms related to both the center of mass and individual particles, capturing the dynamic interactions within the network.
The mathematical model is composed of an objective function (5) designed to minimize the system’s total kinetic energy, incorporating terms related to both the center of mass and individual particles. Then, Constraints (6) and (14) are in place to maintain the conservation of linear momentum in the forward and inward directions, respectively.
On the other hand, equations (8) and (9) govern the velocities of the particles concerning the center of mass and relative velocities. Constraint (10) ensures that each particle’s net force is equal to its mass multiplied by its acceleration. The equation (11) characterizes the gravitational force between pairs of particles. Constraint (12) imposes the requirement that relative velocities must remain non-negative. Finally, Constraint (13) guarantees force equilibrium, while equation (14) establishes the relationship between the magnitude of the net force and the product of each particle’s mass and acceleration.
Collectively, these equations depict a physical system with gravitational interactions and velocity constraints, all aimed at minimizing the overall kinetic energy of the system.
It is important to mention that to solve the mathematical model for robustness, we use a genetic algorithm, which efficiently find the minimum set of separator nodes. This approach provides an approximate solution to the problem, allowing for the identification of critical nodes in the violence network that have a significant impact on its structure and dynamics.
Similarly, to solve the node influence model based on Newton’s laws, a differential evolution algorithm was implemented. The application of this approach enables the identification of influential nodes that exert a significant influence on the evolution of the violence network over time. Both algorithms were implemented in the C programming language.
4. Results
The following section presents the results of the analysis conducted on the influence and robustness of various cities across different years. The data presented in the Subsection 4.3 encapsulate the cities that have demonstrated significant influence and robustness within their respective regions over the years under consideration. By examining these data, we gain insights into the dynamic landscape of urban development and resilience in these regions over time.
4.1. Network Robustness Analysis in Mexico
In this section, we delve into the detailed findings stemming from the network robustness analysis conducted utilizing the adapted mathematical model, as outlined in equations (1)–(4).
To further characterize the structure of the violence network in Mexico, we computed key network properties, including the degree distribution, clustering coefficient, and average path length. These measures provide a deeper understanding of the connectivity patterns among municipalities and allow us to evaluate whether the network exhibits small-world and scale-free properties (Table 1 and Figure 3).
| Metric | Value |
|---|---|
| Clustering coefficient | 0.873043 |
| Average path length | 1.645917 |
| Average degree | 36.116505 |
| Network density | 0.354083 |
| Assortativity coefficient | −0.075069 |
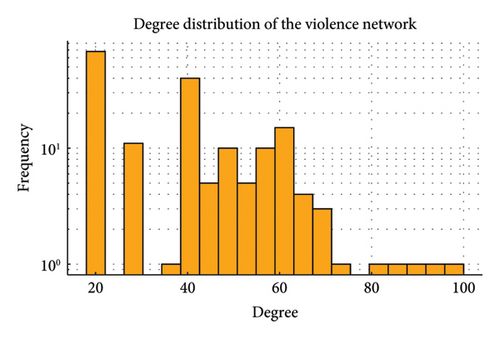
Figure 3 illustrates the degree distribution of the violence network, showing how many municipalities have a given number of connections with others. The distribution suggests that a small number of municipalities serve as highly connected hubs, while the majority has fewer connections. This is a typical signature of scale-free networks, where a few nodes play a central role in the overall connectivity of the system.
Based on the information presented on Figure 4 and Table 1, the clustering coefficient (0.873) indicates a high level of interconnectedness among municipalities, suggesting that crime-related activity tends to cluster in specific regions. In addition, the average path length (1.646) confirms that municipalities in the network are, on average, fewer than two steps away from each other, reinforcing the small-world properties of the network. These properties suggest that interventions targeting central municipalities could have a widespread effect in disrupting crime propagation.
To quantify the local connectivity of the network, we computed the clustering coefficient, which measures how well the neighbors of a node are interconnected. The average clustering coefficient was found to be 0.873, indicating a high level of interconnectedness among municipalities with similar crime patterns. This reinforces the notion that violence-related activity tends to cluster in specific regions, forming tightly connected subnetworks.
In addition, we calculated the average path length, which reflects the typical number of steps needed to travel between two randomly chosen municipalities in the network. The resulting value of 1.646 suggests that any given municipality is, on average, fewer than two connections away from another. This small path length supports the claim that the network exhibits small-world properties, meaning that information (or in this case, crime dynamics) can propagate efficiently between different regions.
The observed properties of the violence network—particularly its high clustering and short path lengths—suggest that criminal activity and violence diffusion may follow predictable structural patterns. The presence of highly connected hubs highlights the role of certain municipalities as critical influencers in crime dynamics, while the clustering of nodes suggests that localized interventions may be effective in disrupting crime networks. These insights could inform targeted intervention strategies, where authorities prioritize efforts in specific municipalities that act as bridges or hubs in the network.
The negative assortativity coefficient (−0.075) indicates that high-degree municipalities tend to connect with low-degree municipalities, reinforcing the presence of hierarchical structures in the violence network. Moreover, the network density (0.354) suggests a moderately connected system, where specific hubs play a central role in maintaining network connectivity. These properties further validate the hypothesis that violence in Mexico follows a structured, nonrandom pattern that can be influenced by strategic interventions.
Our examination revealed a dynamic landscape of separator nodes, exhibiting variations in their significance across various timestamps. This variability highlights the dynamic nature of network robustness within the context of violence. Interestingly, certain municipalities consistently emerged as critical separators throughout the observation period, underscoring their enduring importance in shaping network resilience. In contrast, other municipalities exhibited temporal changes in their functions, oscillating between prominence and relative insignificance over time.
The understanding gained from these findings holds significant implications for policymaking and resource allocation strategies in Mexico. By discerning the temporal evolution of critical separator nodes, authorities can tailor interventions and allocate resources more effectively, attuning their efforts to the evolving dynamics of violence patterns across municipalities. This adaptive approach fosters a more targeted and responsive framework for addressing security challenges, ultimately bolstering resilience and enhancing public safety outcomes.
4.2. Influence Quantification in the Violence Network in Mexico
In this section, we discuss the results of influence quantification based on the adapted mathematical model described in equations (1)–(8).
Our analysis revealed that certain municipalities exhibited significant influence on the overall violence patterns in the network. These influential nodes were characterized by their ability to affect the behavior and interactions of neighboring municipalities. Understanding the dynamics of influence in the violence network in Mexico can assist in developing strategies to mitigate and prevent violent incidents.
In summary, the results of both robustness analysis and influence quantification provide valuable insights into the temporal evolution of violence networks in Mexico. These insights can inform policy decisions, resource allocation, and specific actions to improve public safety and address the complex challenges posed by violence in the country.
4.3. Numerical Results
Table 2 provides a comprehensive overview of the cities categorized by their influence and robustness for each year from 2015 to 2021. The cities listed under “Influence” denote those that have exhibited notable economic, social, and political impact within their regions, while those under “Robustness” represent cities that have shown resilience and sustainability in the face of various challenges. Analyzing the trends in these categories sheds light on the evolving patterns of urban development and resilience across different regions and time periods.
| Year | Influence | Robustness |
|---|---|---|
| 2015 | Acapulco de Juárez, Chilpancingo de los Bravo, Cuernavaca, Heroica Ciudad de Juchitán de Zaragoza, Iguala de la Independencia, Yautepec, Playas de Rosarito, Cuautla, Ecatepec de Morelos, Culiacán, Cuauhtémoc, Tijuana, Centro, Chilapa de Álvarez, La Paz, Zacatecas, Tlalnepantla de Baz, Cunduacán | Chiapa de Corzo, Aguascalientes, Matamoros, San Felipe, Tehuacán, Valle de Santiago, Hermosillo, Tulancingo de Bravo, Xochimilco, Guadalupe, Ahome, Orizaba, Tláhuac, Mérida, Corregidora, Gral. Escobedo, Xalapa, Coyoacán, Hidalgo, Saltillo, Boca del Río, San Luis Potosí, Tlalpan, Tuxpan |
| 2016 | Juárez, Tecoman, Acapulco de Juárez, Ecatepec, Monterrey, Ciudad Victoria, Chilpancingo, Iztapalapa, Manzanillo, Colima, Nezahualcóyotl, Chimalhuacán, Iguala, Chilapa | Jesus María, Saltillo, Temoaya, Villaflores, Atlacomulco, Mineral de la Reforma, Bahía de Banderas, San Felipe de Progreso, Santiago Ixcuintla |
| 2017 | Acapulco de Juárez, Tijuana, Juarez, Culiacan, Ecatepec De Morelos, Chihuahua, Chilpancingo De Los Bravo, Iztapalapa, Victoria, Monterrey, Guadalajara, Leon | Iguala De La Independencia, Nezahualcoyotl, Cuauhtemoc, Chimalhuacan, Apatzingan, Uruapan, Zamora, Coyuca De Benitez, Alvaro Obregon, Celaya, Hermosillo, Monterrey, Torreon |
| 2018 | Mexicali, Tijuana, San Quintin, Zihuatanejo, Iguala, Acapulco de Juárez, Azcapotzalco, Manzanillo, Ecatepec, Chalco, Piedras Negras, Tulancingo de Bravo, Chihuahua | Jacona, Monterrey, Tlajomulco de Zúñiga, Ensenada, Apaseo el Grande, Cuauhtémoc, Reynosa, Cuauhtémoc, Iguala |
| 2019 | Tijuana, Fresnillo, Culiacan, Acapulco de Juárez, Ecatepec, Playas de Rosarito, Manzanillo, Tecomán, Salamanca | Tlalnepantla de Baz, Tultitlán, Nezahualcóyotl, Solidaridad, Chimalhuacán, Irapuato, Chilpancingo de los Bravo, Guaymas, Ensenada, Apaseo el Grande |
| 2020 | Tijuana, Juárez, León, Cajeme, Acapulco de Juárez, Fresnillo, Guadalajara, Chihuahua, Ensenada, Celaya, Zamora, Culiacán | Caborca, Reynosa, Tlalnepantla de Baz, Nezahualcóyotl, Puebla, Cuautitlán Izcalli, San Luis Río Colorado, Venustiano Carranza |
| 2021 | Tijuana, Juárez, Leon, Celaya, Culiacán, Cajeme, Guadalajara, Zamora, Acapulco de Juárez, Morelia, Ensenada, Chihuahua, Benito Juárez | Venustiano Carranza, Chiapa de Alvarez, Torreón, Tecomán, Tecamac, Mazatlán |
- •
Red: municipalities that are structurally significant for network robustness, meaning they act as key connectors in the persistence of violence patterns.
- •
Yellow: municipalities that are noteworthy for their influence, meaning they facilitate the spread of violence but are not necessarily persistent over time.
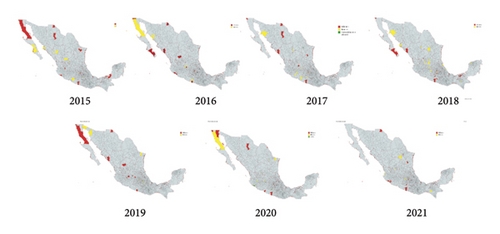
This analysis covers the years 2015–2021 and provides a spatiotemporal perspective on how key municipalities contribute to violence dynamics across Mexico.
To further analyze the geographic distribution of municipalities that play a crucial role in the violence network, we aggregated the municipalities by state and computed the number of times each state had at least one municipality identified as either influential or robust between 2015 and 2021.
Figure 6 presents the distribution of these municipalities across states. The data highlight that Guanajuato, Baja California, and Estado de México have the highest number of municipalities involved in the violence network, suggesting that crime dynamics in these states are more interconnected with broader patterns of violence across the country. This insight aligns with previous findings that identify these regions as key hubs in crime propagation.
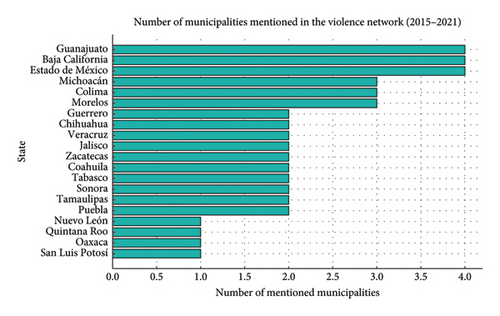
Interestingly, other states such as Michoacán, Colima, and Chihuahua also exhibit significant participation in the network, further supporting the idea that certain regions serve as central conduits for violence diffusion. Understanding these spatial patterns can provide valuable guidance for policymakers in designing state-level intervention strategies to disrupt crime networks.
- 1.
Cities of influence: the cities listed under “Influence” for each year represent municipalities with significant economic, social, and political importance within their respective regions. These cities likely wield considerable influence over the surrounding areas, including their impact on violence dynamics. Factors such as population size, economic activity, political power, and infrastructure may contribute to their influence. Understanding the dynamics within these influential cities is crucial for comprehending the broader patterns of violence in Mexico.
- 2.
Cities of robustness: conversely, the cities listed under “Robustness” demonstrate resilience and the ability to withstand the challenges posed by violence. This resilience may stem from various factors, including strong community cohesion, effective law enforcement, proactive governance, investment in social programs, or geographical isolation. These cities serve as examples of successful strategies for mitigating violence despite existing in regions with high levels of violence. Analyzing the characteristics and policies of these resilient cities can provide valuable insights into effective violence prevention and mitigation measures.
- 3.
Temporal trends and insights: by examining the trends in both influence and robustness across different years, we can identify patterns and shifts in the landscape of violence in Mexico. For instance, changes in the cities listed under “Influence” may indicate shifts in economic or political power dynamics, which can have implications for violence patterns. Similarly, fluctuations in the cities listed under “Robustness” may suggest changes in the effectiveness of violence prevention strategies or the emergence of new challenges. Continuously monitoring these trends can inform policymakers and stakeholders in crafting targeted interventions and adapting existing strategies to address evolving violence dynamics effectively.
Then, understanding the interplay between influential cities and resilient cities is essential for comprehensively addressing violence in Mexico. Targeted interventions in influential cities can help address underlying issues contributing to violence, while learning from resilient cities can inform the development of effective violence prevention strategies nationwide.
Finally, the high clustering coefficient (0.873) and short average path length (1.646) confirm that the violence network exhibits small-world properties. This suggests that criminal activity spreads efficiently across regions, with certain municipalities acting as critical transmission hubs. In addition, the degree distribution analysis indicates a scale-free structure, meaning that a small number of municipalities play a disproportionately large role in the violence network. These findings are significant because they imply that targeted interventions in a few key municipalities could disrupt broader crime networks, potentially leading to more effective violence prevention strategies.
5. Discussion
The findings of this study provide strong evidence that violence in Mexico follows structured, nonrandom patterns that can be effectively analyzed through network science. The high clustering coefficient (0.873) and short average path length (1.646) confirm that the violence network exhibits small-world properties, meaning that crime-related incidents spread efficiently between municipalities. In addition, the degree distribution suggests a scale-free structure, where a few key municipalities act as major hubs, reinforcing the hierarchical nature of crime dynamics.
The negative assortativity coefficient (−0.075) further supports this interpretation, indicating that high-degree nodes (municipalities with frequent violent incidents) tend to connect with low-degree nodes (municipalities with fewer incidents). This structure is characteristic of organized crime networks, where a few strategic locations facilitate the expansion of violence into new territories. The network density (0.354) suggests that while the system is relatively well connected, violence does not diffuse randomly; rather, it follows specific channels determined by regional crime dynamics.
Implications for security strategies: since violence spreads more efficiently through certain municipalities that serve as bridges in the network, targeting these strategic locations with security interventions could be highly effective in disrupting crime propagation. This aligns with previous research on network-based crime prevention [14, 15], which suggests that focusing resources on key nodes can maximize the impact of intervention efforts.
In addition, the similarity between the crime network’s structure and epidemiological models [17, 18] suggests that crime could be mitigated using network-based intervention techniques similar to those used in disease control. Strategies such as disrupting high-degree hubs, strengthening intermunicipal coordination, and developing predictive monitoring systems could enhance public safety outcomes.
6. Conclusions
In this study, we have examined in detail the dynamics of violence in Mexico, focusing on the influence and robustness of different cities over time. Our analysis reveals that certain municipalities have significant economic, social, and political importance, while others demonstrate notable resilience against violence. These findings underscore the need to understand the dynamics within these cities to comprehensively address the issue of violence in the country.
Furthermore, by analyzing temporal trends, we have observed fluctuations in the influence and robustness of cities over the years, reflecting changes in economic, political, and social dynamics that have implications for violence patterns. This continuous monitoring of trends is essential to inform policy decisions and future interventions.
On the other hand, our analysis of the dynamics of the networks allows us to understand how networks of violence evolve in Mexico. Identifying critical nodes and influential municipalities over time could allow interventions to be tailored and resources allocated more effectively to improve public safety. The combination of these disciplinary perspectives and advanced analytical techniques has allowed us to obtain a comprehensive vision of violence in Mexico and propose more solid and effective intervention strategies.
To the Policy and Practical Implications, based on the results of this study, there are several areas for future research and action. A promising line of research involves conducting longer analyzes spanning several decades to better understand long-term trends and dynamics of violence in Mexico. Furthermore, further analysis at the community level could reveal microsocial factors that contribute to violence and resilience, allowing the development of specific interventions tailored to local needs.
Evaluating the effectiveness of existing violence prevention and mitigation policies and programs is also crucial to inform evidence-based policymaking and identify areas for improvement or innovation. Likewise, comparing violence dynamics and intervention strategies between different countries or regions could provide valuable lessons and best practices for addressing violence in Mexico.
- •
Targeted crime prevention programs: municipalities with high network influence should receive priority for enhanced law enforcement, community engagement programs, and social support initiatives.
- •
Strategic resource allocation: security resources should be concentrated in critical municipalities to prevent crime spillover into adjacent regions.
- •
Early warning system: given the dynamic nature of the network, a real-time monitoring system should be developed to track changes in municipal violence patterns and adjust intervention strategies accordingly.
- •
Intermunicipal coordination: since violence spreads through connected municipalities, collaborative security efforts across municipal borders could enhance intervention success.
Conflicts of Interest
The authors declare no conflicts of interest.
Author Contributions
All authors contributed equally to this work.
Funding
No funding was received for this study.
Open Research
Data Availability Statement
The data used in this study are publicly available from the following official sources:
• Government of Mexico. Datos Abiertos de Incidencia Delictiva. https://www.gob.mx/sesnsp/acciones-y-programas/datos-abiertos-de-incidencia-delictiva [9].
• Instituto Nacional de Estadística y Geografía (INEGI). Gobierno, Seguridad y Justicia: Incidencia Delictiva. https://www.inegi.org.mx/temas/incidencia/ [10].
On the other hand, the maps included in Figures 1 and 4 were generated using ArcGIS software based on the analysis results derived in this study [16].
Please contact the authors if further clarification or assistance is needed to access these resources.


