Harmonic–Arithmetic Index for the Generalized Mycielskian Graphs and Graphenes With Curvilinear Regression Models of Benzenoid Hydrocarbons
Abstract
The generalized Mycielskian graphs are known for their advantageous properties employed in interconnection networks in parallel computing to provide efficient and optimized network solutions. This paper focuses on investigating the bounds and computation of the harmonic–arithmetic index of the generalized Mycielskian graph of path graph, cycle graph, complete graph, and circulant graph. Furthermore, exploring the harmonic–arithmetic index of graphene provides insights into its structural properties, aiding in material design, predictive modeling, and understanding its behavior in various applications. Additionally, the study delves into analyzing the harmonic–arithmetic index of the curvilinear regression model concerning elucidating specific properties of benzenoid hydrocarbons, offering insights into their structural characteristics.
1. Introduction
Chemical graph theory is a branch of mathematics that focuses on understanding the properties and behaviors of chemical compounds using graphs. Molecules are represented as graphs, with atoms being the vertices and chemical bonds being the edges. These graphs can be used to represent the structure and connectivity of molecules, allowing one to analyze and predict their properties. Topological indices are numerical descriptors derived from the molecular graph structure that provide insights into various chemical properties, determined solely by their topology or connectivity arrangement, without regard to bond lengths or angles. They are key mathematical descriptors in chemical graph theory and hold considerable importance due to their utility in quantitative structure–property relationship (QSPR) and quantitative structure–activity relationship (QSAR). These indices offer an efficient means to translate chemical composition into numerical values, facilitating correlation with physical properties. Over the years, numerous topological indices have been explored, with those based on distance or molecular degree proving most beneficial. QSPR models use topological indices to predict various physicochemical, biological, and pharmacological properties of molecules. These properties include boiling points (BPs), solubility, toxicity, and biological activity. In drug design, topological indices help identify potential drug candidates by predicting their interaction with biological targets. This can streamline the drug discovery process by reducing the number of compounds that need to be synthesized and tested [1]. The authors in [2–5] have studied the QSPR analysis using several distance- and degree-based topological indices for antidrugs and chemical compounds.
More extensive research on the HA index is detailed in [11].
The Mycielskian graph, coined after Jan Mycielski [12], is a technique in graph theory where a new graph is formed from an existing one by systematically introducing extra vertices and edges while maintaining its triangle-free nature and clique number. Stiebitz introduced the generalized Mycielskian graph in [13], which represents natural extensions of the Mycielskian graph. These graphs have useful applications in graph coloring and network design. De in [14] has calculated various topological indices of the generalized Mycielskian graphs, and Chanda and Iyer in [15] have determined the Sombor index for the Mycielskian graphs.
Computational analysis of indices for different chemical and nanostructures has also been an active area of research. Recent interest in graphene-based nanotubes and nanomaterials has stimulated further interest in the study of polycyclic benzenoids. Porous two-dimensional (2D) nanographene structures hold great potential across various research fields, offering diverse applications including nanochemistry, metal ion sequestration, and enhanced electrical properties, with topological descriptors aiding in structural characterization and property prediction. Their porous nature facilitates the fabrication of highly efficient electrodes, promising significant advancements in battery and energy storage technologies [16]. In the realm of chemistry, graphene finds diverse applications due to its large surface area, chemical stability, and unique electronic structure. The authors in [17, 18] have derived various topological indices of graphene.
Benzenoid hydrocarbons are a specific type of polycyclic aromatic hydrocarbons (PAHs) composed of six-membered rings containing only carbon and hydrogen atoms. Also known as condensed polycyclic unsaturated conjugated hydrocarbons, these compounds are typically planar because of the geometry of their six-membered rings. Their planar structure contributes to their relative stability compared to other PAHs. To establish the relationship between the variables under investigation, a statistical technique known as curvilinear regression is employed [19]. This method can be utilized to explore the association between the chemical structures of molecules and topological indices, aiding in the analysis of chemical and biological activity. In [20], Arockiaraj et al. introduce an innovative method that employs generalized reverse-degree parameters and conducts a QSPR investigation employing both the linear and cubic regression models to evaluate the efficacy of recent drugs against multiple coronavirus variants.
Motivated by the preceding literatures, this paper investigates the bounds and computational methods for determining the HA index of the generalized Mycielskian graph applied for Pn, Cn, Kn, and . It also calculates the HA index for graphene and analyzes and predicts the chemical application of the HA index in framing the curvilinear regression models for the six physiochemical properties using SPSS software.
2. Generalized Mycielskian Graph
The generalized Mycielskian graph is an interesting construction in graph theory that increases the number of vertices and edges while preserving its triangle-free property.
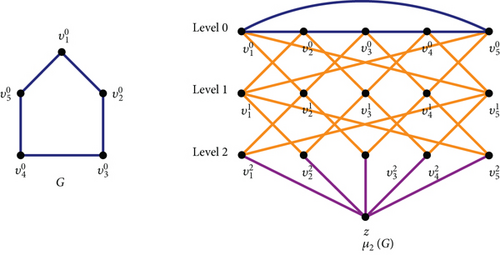
Definition 1 ([15]). Let G be any graph with vertex set, V(G) = {v1, v2, ⋯, vn}, and edge set E(G). Let m be any positive integer. For each integer k(0 ≤ k ≤ m), let Vk be the kth copy of vertices in V, that is, . The generalized Mycielskian graph of G denoted by μm(G) is the graph with the vertex set V(μm(G)) = V0 ∪ V1 ∪ V2 ⋯ ∪Vm ∪ {z} and the edge set The vertex is at level k, and so the vertices of Vk are called as vertices of level k.The identification of for 1 ≤ i ≤ n and thus refers to the vertices at level 0 as original vertices, the vertices at level k ≥ 1 as shadow vertices at level m, and the vertex z as the universal vertex (root). The root is only adjacent to the shadow vertices at level m. It is observed from the structure that
- •
For m = 0, μ0(G) is the graph obtained from G by adding a universal vertex.
- •
For m = 1, μ1(G) = μ(G).
An illustration of the generalized Mycielskian graph constructed from C5 is provided in Figure 1.
Proposition 1 ([15]). Let μm(G) be the m -Mycielskian graph of a G with n vertices. Then, for each v ∈ V(μm(G))
2.1. Bounds for HA Index of the Generalized Mycielskian Graph
The following subsection provides bounds for the HA index of the generalized Mycielskian graphs.
Theorem 1. Given that a graph G with a vertex set V = {u1, u2, u3, ⋯, un} of size n and edges of size m, then
2.2. HA Index of the Generalized Mycielskian Graph
In this section, HA index of the generalized Mycielskian graphs of m levels for Pn, Cn, Kn, and are computed using edge contribution method.
Theorem 2. For a graph G with n vertices and m levels in μm(G)
- 1.
HA(μm(Pn)) = n(2m − 1) − 6m(32m/9) + 123/25 + (96(n − 3)/49) + (16n/(2 + n)2) + (12n(n − 2)/(3 + n)2),
- 2.
HA(μm(Cn)) = n(2m − 1) + (145n/49) + (12n2/(3 + n)2),
- 3.
HA(μm(Kn)) = nm(n − 1) − n(n − 2) + (n(n − 1)/2) + (8n2(n − 1)2/(3n − 2)2),
- 4.
Proof 2. For a graph G with n vertices, the graph μm(G) is constructed with vertices across m levels. The analysis focuses on the degrees of the endpoints of the edges within the graph. The edge distribution is partitioned into four levels, as indicated in Table 1, that displays the number of edges where the endpoints have the same degree.
| Level in μm(Pn) | (du, dv) | |(du, dv)| |
|---|---|---|
| Level 0 | (2, 4) | 2 |
| (4, 4) | (n − 3) | |
|
(2, 4) | (m − 1)4 |
| (4, 4) | (m − 1)2(n − 3) | |
| Between levels m − 1 and m | (2, 3) | 2 |
| (2, 4) | 2 | |
| (3, 4) | 2(n − 3) | |
| Between levels m and z | (2, n) | 2 |
| (3, n) | n − 2 | |
Table 2 gives the edge distribution of the graph μm(Cn).
| Level in μm(Cn) | (du, dv) | |(du, dv)| |
|---|---|---|
| Level 0 | (4, 4) | n |
|
(4, 4) | 2n(m − 1) |
| Between levels m − 1 and m | (4, 3) | 2n |
| Between levels m and z | (3, n) | n |
Table 3 gives the edge distribution of the graph μm(Kn).
| Level in μm(Kn) | (du, dv) | |(du, dv)| |
|---|---|---|
| Level 0 | (2(n − 1), 2(n − 1)) | |
|
(2(n − 1), 2(n − 1)) | n(n − 1)(m − 1) |
| Between levels m − 1 and m | (2(n − 1), n) | n(n − 1) |
| Between levels m and z | (n, n) | n |
Figure 2 illustrates the generalized Mycielskian graph of a path graph with m levels.
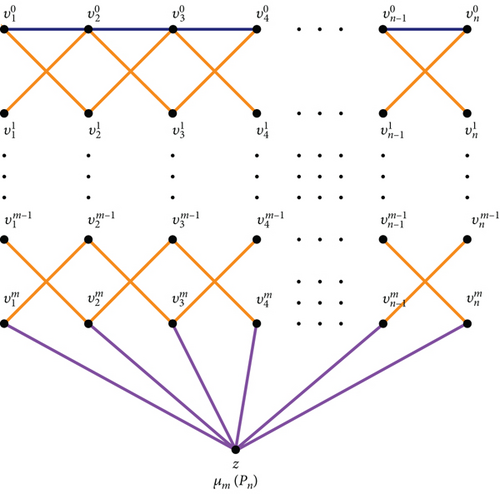
Table 4 gives the edge distribution of the graph .
| Level in | (du, dv) | |(du, dv)| |
|---|---|---|
| Level 0 | (8, 8) | 2n |
|
(8, 8) | 4n(m − 1) |
| Between levels m − 1 and m | (8, 5) | 4n |
| Between levels m and z | (5, n) | n |
3. HA Index of Graphene
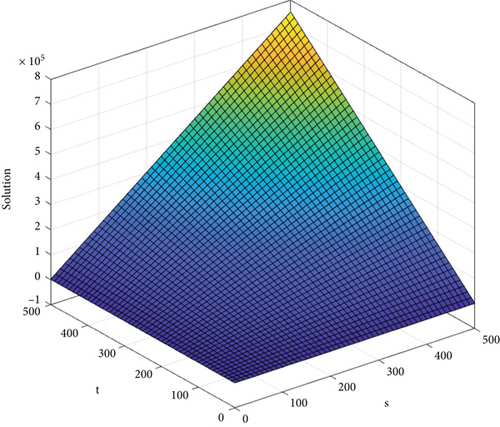
Graphene was first isolated from graphite in 2004 by Andre Geim and Konstantin Novoselov. It can exist in several different forms, each with its own unique properties and structures. The paper focuses on monolayer graphene, the most renowned form characterized by a single layer of carbon atoms arranged in a hexagonal lattice. Understanding the topological properties of benzenoid systems is crucial in the context of graphene because these properties play a significant role in determining the chemical and biological properties of polycyclic benzenoids [21]. The following result is on deriving the HA index of graphene, and a 3D model of the same is represented.
Theorem 3. Given the “t” and “s” benzene rings in each row, the HA index of graphene is given by
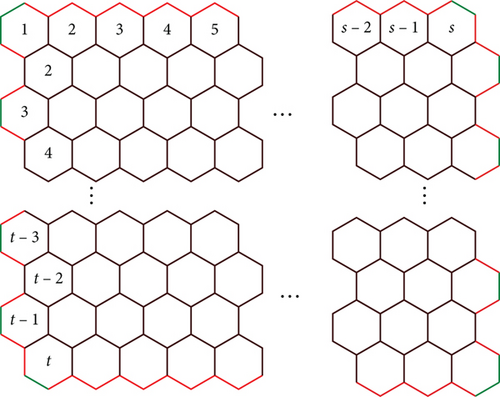
Proof 3. The graphene structure composed of “t” and “s” benzene rings in each row, let the edge, e = (du, dv), represent the number of edges connecting vertices with degrees du and dv. Within this 2D arrangement of graphene as depicted in the figure, only the edges (2,2), (2,3), and (3,3) are present. In Figures 3 and 4, the edges (2,2), (2,3), and (3,3) are distinguished by green, red, and black coloring, respectively.

Case (i) For t = 1
Table 5 gives the edge contribution for Figure 3.
| (du, dv) | e = |(du, dv)| |
|---|---|
| (2, 2) | 6 |
| (2, 3) | 4s − 4 |
| (3, 3) | s − 1 |
Case (ii) For t > 1 and s ≥ 1
The cardinality of the edges with the end degree vertices is mentioned in Table 6.
| (du, dv) | e = |du, dv| |
|---|---|
| (2, 2) | t + 4 |
| (2, 3) | 4s + 2t − 4 |
| (3, 3) | 3ts − 2s − t − 1 |
In Figure 5, the HA index of graphene when t > 1 and s ≥ 1 is graphically represented in 3D.
4. Curvilinear Regression Model
In this regression equation, Y stands for the dependent variable, A represents the regression constant, and Bi where i = 1, 2, 3 are the regression coefficients associated with independent variables Xi where i = 1, 2, 3. The parameter n indicates the sample size used for constructing the regression equation, while r denotes the correlation coefficient, SE represents the standard error of the estimates, MSE indicates mean square error, RMSE is the root-mean-square error, and F signifies Fisher’s statistic. It is obvious that the optimal prediction model will minimize the error. The structures of 22 benzenoid hydrocarbons considered for this study are illustrated in Figure 6.
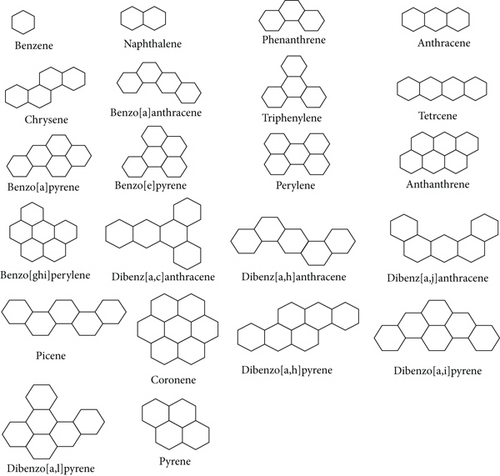
Table 7 displays the experimental values of the physicochemical properties of 22 benzenoid hydrocarbons alongside their corresponding HA index values.
| Derivatives of benzene | HA | BP | π -elec | MW | PO | MV | MR |
|---|---|---|---|---|---|---|---|
| Benzene | 6 | 78.8 | 8 | 78.11 | 10.4 | 89.4 | 26.3 |
| Naphthalene | 10.84 | 221.5 | 13.683 | 128.17 | 17.5 | 123.5 | 44.1 |
| Phenanthrene | 15.76 | 337.4 | 19.448 | 178.23 | 24.6 | 157.7 | 61.9 |
| Anthracene | 15.68 | 337.4 | 19.314 | 178.23 | 24.6 | 157.7 | 61.9 |
| Chrysene | 20.68 | 448 | 25.192 | 228.3 | 31.6 | 191.8 | 79.8 |
| Benzo[a]anthracene | 20.6 | 436.7 | 25.101 | 228.3 | 31.6 | 191.8 | 79.8 |
| Triphenylene | 20.76 | 425 | 25.275 | 228.3 | 31.6 | 191.8 | 79.8 |
| Tetracene | 20.52 | 436.7 | 25.188 | 228.3 | 31.6 | 191.8 | 79.8 |
| Benzo[a]pyrene | 22.6 | 495 | 28.222 | 252.3 | 35.8 | 196.1 | 90.3 |
| Benzo[e]pyrene | 24.36 | 467.5 | 28.336 | 252.3 | 35.8 | 196.1 | 90.3 |
| Perylene | 23.68 | 467.5 | 28.245 | 252.3 | 35.8 | 196.1 | 90.3 |
| Anthanthrene | 26.52 | 497.1 | 31.253 | 276.3 | 40 | 200.4 | 100.8 |
| Benzo[ghi]perylene | 23.68 | 501 | 31.425 | 276.3 | 40 | 200.4 | 100.8 |
| Dibenz[a.c]anthracene | 25.6 | 518 | 30.942 | 278.3 | 38.7 | 225.9 | 97.6 |
| Dibenz[a.h]anthracene | 25.52 | 524.7 | 30.881 | 278.3 | 38.7 | 225.9 | 97.6 |
| Dibenz[a.j]anthracene | 25.52 | 524.7 | 30.88 | 278.3 | 38.7 | 225.9 | 97.6 |
| Picene | 25.6 | 519 | 30.43 | 278.3 | 38.7 | 225.9 | 97.6 |
| Coronene | 29.52 | 525.6 | 34.572 | 300.4 | 44.1 | 204.7 | 111.4 |
| Dibenzo[a.h]pyrene | 28.52 | 552.3 | 33.928 | 302.4 | 42.9 | 230.2 | 108.1 |
| Dibenzo[a.i]pyrene | 28.52 | 552.3 | 33.954 | 302.4 | 42.9 | 230.2 | 108.1 |
| Dibenzo[a.l]pyrene | 27.6 | 552.3 | 34.031 | 302.4 | 42.9 | 230.2 | 108.1 |
| Pyrene | 18.86 | 404 | 22.506 | 202.25 | 28.7 | 162 | 72.5 |
The curvilinear regression model yields correlation coefficients (denoted as r) between the HA index and physicochemical properties of benzenoid hydrocarbons.
From Figure 7, it is clear that π-electron, MV, PO, and MR have the best correlation coefficient in the linear, quadratic, and cubic models.
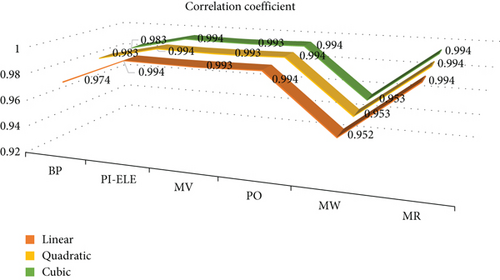
Table 8 provides the metrics utilized in linear regression analysis.
| Properties | r2 | F | SE | MSE | RMSE |
|---|---|---|---|---|---|
| BP | 0.948 | 364.917 | 27.129 | 735.998 | 27.129 |
| π -elec | 0.988 | 160.782 | 0.783 | 0.613 | 0.783 |
| MW | 0.986 | 1420.804 | 7.097 | 80.356 | 7.096 |
| PO | 0.987 | 1525.917 | 1.007 | 1.013 | 1.006 |
| MV | 0.905 | 191.483 | 11.461 | 131.351 | 11.460 |
| MR | 0.987 | 1856.649 | 2.513 | 6.315 | 2.513 |
Table 9 provides the metric used in a quadratic regression analysis.
| Properties | r2 | F | SE | MSE | RMSE |
|---|---|---|---|---|---|
| BP | 0.984 | 569.017 | 15.648 | 244.849 | 15.648 |
| π -elec | 0.988 | 791.701 | 0.788 | 0.620 | 0.787 |
| MW | 0.987 | 745.003 | 6.935 | 48.090 | 6.935 |
| PO | 0.987 | 733.076 | 1.027 | 1.055 | 1.027 |
| MV | 0.920 | 109.874 | 10.787 | 116.351 | 10.787 |
| MR | 0.987 | 748.379 | 2.563 | 6.569 | 2.563 |
Table 10 presents the metrics employed in cubic regression analysis.
| Properties | r2 | F | SE | MSE | s |
|---|---|---|---|---|---|
| BP | 0.984 | 368.777 | 15.874 | 251.971 | 15.874 |
| π -elec | 0.989 | 530.830 | 0.786 | 0.617 | 0.786 |
| MW | 0.988 | 512.821 | 6.828 | 46.623 | 6.828 |
| PO | 0.988 | 474.546 | 1.042 | 1.087 | 1.043 |
| MV | 0.927 | 76.438 | 10.598 | 112.321 | 10.598 |
| MR | 0.988 | 486.166 | 2.597 | 6.744 | 2.597 |
The aforementioned curvilinear regressions were calculated with a significance level of 0.0001. As evident from the calculated values, the π-electron exhibits the minimum error, followed by PO and MR. Figures 8, 9, 10, 11, 12, and 13 show the linear, quadratic, and cubic regression graph models and compares them with the HA index and physical and chemical properties.
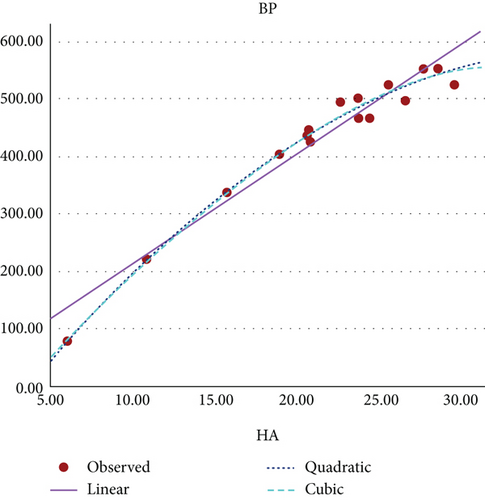
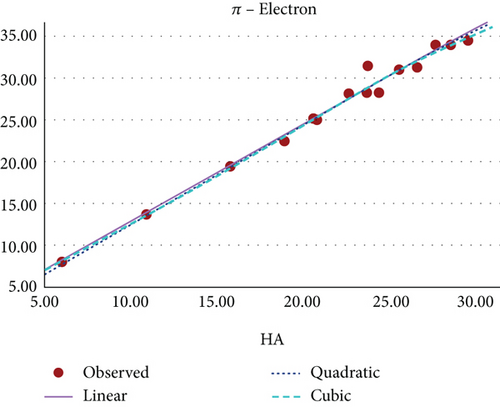
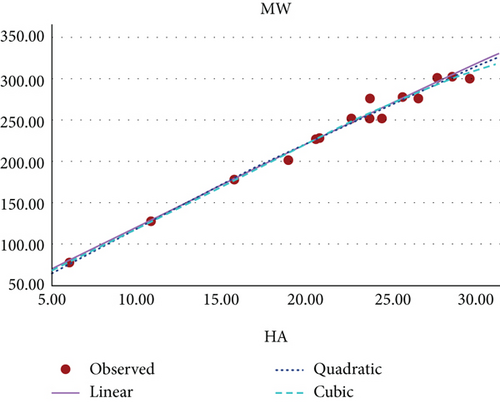
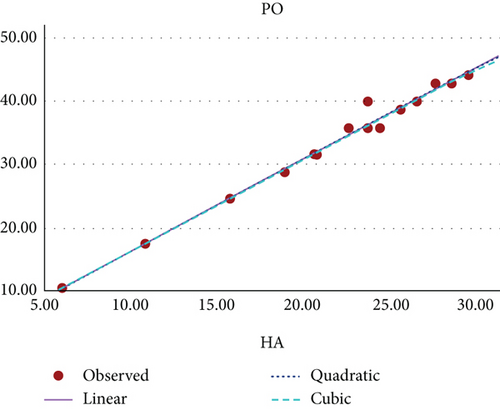
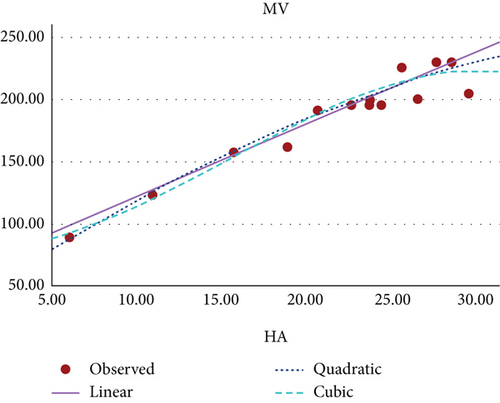
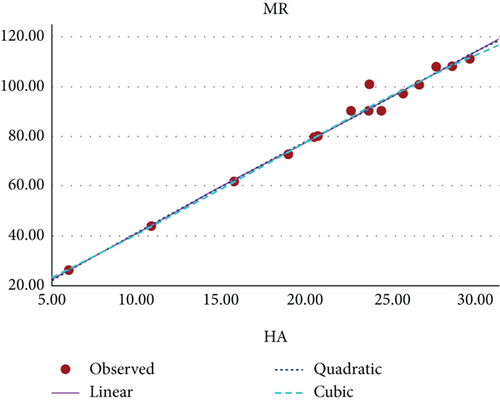
Figure 8 shows the scatter plot for the curvilinear regression model of BP and HA index of benzenoid hydrocarbons.
Figure 9 shows the scatter plot for the curvilinear regression model of π-electron and HA index of benzenoid hydrocarbons.
Figure 10 shows the scatter plot for the curvilinear regression model of MW and HA index of benzenoid hydrocarbons.
Figure 11 shows the scatter plot for the curvilinear regression model of PO and HA index of benzenoid hydrocarbons.
Figure 12 shows the scatter plot for the curvilinear regression model of MV and HA index of benzenoid hydrocarbons.
Figure 13 shows the scatter plot for the curvilinear regression model of MR and HA index of benzenoid hydrocarbons.
The curvilinear models suggests that the HA index demonstrates the highest potential as a predictive index for π-electron energy, with benzenoid hydrocarbon’s MR and PO following closely behind. Figures 8, 9, 10, 11, 12, and 13 present a visual representation in the form of scatter diagrams, illustrating the variations in each model with respect to the HA index.
In [22], the authors have evaluated the effectiveness of multiplicative and scalar multiplicative descriptors in predicting four physicochemical properties BP, log P, retention index, and enthalpy of 22 benzenoid hydrocarbons using the QSAR/QSPR models. The study proposes that scalar multiplicative descriptors offer a superior alternative to multiplicative descriptors, analyzing their predictive capabilities using entropy measures. In this paper, we also explore the chemical applicability of the HA index for some benzenoid hydrocarbons in predicting six properties that are BP, π-elec, MW, PO, MV, and MR using a curvilinear regression model. Among these, three properties such as π-electron energy, MR, and PO show high predictability.
5. Conclusion
The exploration of the HA index for the Mycielskian graphs unveils significant insights into their structural properties, offering a new perspective on their behavior in various contexts. This qualitative analysis highlights the importance of the HA index in understanding the intricate molecular structure of graphene. Through the study of benzenoid hydrocarbons, curvilinear regression models encompassing linear, quadratic, and cubic equations demonstrate promising trends and patterns. These models suggest that the HA index is a highly effective predictor of π-electron energy, MR, and PO. The findings underscore the critical role of topological indices in the field of chemistry, especially in the realm of drug design and development. This study provides researchers with valuable insights into the practical applications of the HA index across a variety of chemical compounds.
Conflicts of Interest
The authors declare no conflicts of interest.
Funding
No funding was received for this manuscript.
Open Research
Data Availability Statement
The data used have been included in the manuscript.


