KAST Improves Airway Inflammation in Allergic Asthma via GATA3/ILC2
Abstract
This study aimed to investigate the effects of KAST in asthma and its underlying mechanisms by combining network pharmacology and bioinformatic methods. Based on the TCMSP and HERB databases, we found the active compounds and targets of KAST. We integrated results from three databases, GeneCards, OMIM, and TTD, to search for asthma targets. We constructed a PPI network to better understand the interaction between proteins and selected core proteins. GO enrichment analysis was used to find functional changes in the target from three aspects: molecular function, cellular component, and biological process involved. The KEGG was used to uncover the signaling pathways of these targets. We screened differential genes through the GEO database and used a weighted gene coexpression network analysis to find gene modules closely related to asthma and further construct a core PPI network. Active compounds and core proteins were assessed using molecular docking. In total, 107 active compounds and 564 potential targets were identified. GO and KEGG pathway enrichment analyses showed that the role of KAST was closely related to inflammation, cell cycle, endocrine resistance, and PI3K/AKT signaling pathways. The core PPI network revealed five core targets. Molecular docking revealed a good binding ability between the active compound and the core protein. Experiments have confirmed that KAST can regulate the expression of IL33 in lung tissue and the expression of GATA3 in ILC2 and improve airway inflammation in asthma. KAST has various components and targets and can improve asthma systematically through various pathways. This study will lay the foundation for further study of its mechanism of action.
1. Introduction
Asthma is a recurring respiratory disease that manifests as airway inflammation, remodeling and hyperresponsiveness in chronic respiratory disease [1]. More than 300 million people have asthma worldwide, and 5%–10% of these are not well-controlled [2]. Asthma symptoms include difficulty breathing, chest tightness, and coughing. In severe cases, it can lead to respiratory failure and even death [3, 4]. It seriously harms health, increases economic burden, and causes loss of social productivity [5, 6]. Clinical studies have shown that asthma results from the interaction of genes and the environment, with complex attack mechanisms, diverse clinical manifestations, and pathological changes [7, 8]. Anti-inflammatory drugs, bronchodilators, inhaled corticosteroids, and other drugs are commonly used clinically to reduce the symptoms of asthma [9]. However, these therapies have varying degrees of side effects, and personalizing treatment is difficult for different asthma symptoms [10, 11]. Therefore, new therapies are needed to help reduce symptoms of asthma.
TCM is a widely recognized alternative therapy in Asia, used in the treatment of asthma owing to its high safety and efficacy [12, 13]. AST is a TCM often used in the treatment of respiratory diseases [14, 15]. AST with Bufei Yishen granules combined can improve the pathological changes in the lung and airway and reduce the expression of inflammatory factors [16]. The AST used in this study is an improved formula derived from the white mustard paste in “Zhang’s Yitong,” written by Zhang Lu, a famous physician in the Qing Dynasty. KAST is further improved on the basis of the original AST. It consists of Sinapis semen (Jiezi), Corydalis rhizoma (Yanhusuo), Kansui radix (Gansui), Asari radix et rhizoma (Xixin), Ephedra herba (Mahuang), Lepidii semen descurainiae semen (Tinglizi), Caryophylli flos (Dingxiang), Cinnamomi cortex (Rougui), and Gleditsiae fructus abnormalis (Zhuyazao). The team’s previous study found that KAST can effectively reduce the recurrence of asthma and improve patients’ quality of life [17]. However, the therapeutic mechanism of KAST in asthma remains unclear.
The material basis and therapeutic mechanism of TCM are unclear because of its multiple components and targets, thereby affecting its further application. By integrating multiple disciplines, such as bioinformatics, traditional pharmacology, and network biology, network pharmacology can comprehensively reveal the active compounds and underlying mechanisms in TCM formulations [18]. This research method has been widely used to explore the pharmacological effects of traditional Chinese medicine compound prescriptions and potential therapeutic targets for diseases. At the same time, we further mined the database of clinical research to find targets that are more clinically meaningful. We also integrated the targets in network pharmacology research with those in clinical research, which made the screened targets more clinically meaningful. In this way, we screened out the KAST action targets.
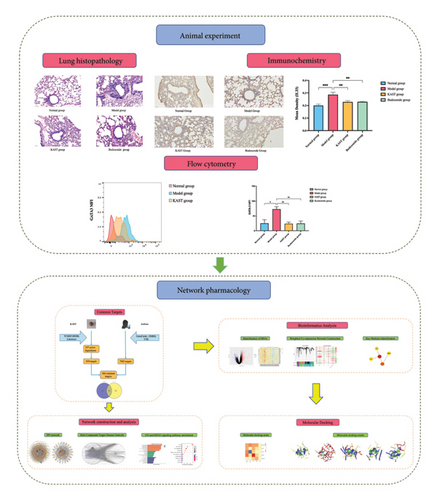
The operational procedures of the entire experiment are described next. First, we screened the active components of KAST and potential targets in asthma from the database. Second, we constructed crossover networks and performed protein–protein interaction analysis and GO and KEGG analyses to explore the mechanism of action. Third, we further analyzed the potential targets of asthma through GEO data. Then, we validated the selected components and targets by molecular docking. For the active small molecule compounds selected in molecular docking, we selected the five active compounds with the highest degree scores in the PPI network. For the proteins in molecular docking, we selected the common target proteins among the target proteins of KAST, the target proteins of asthma, and the proteins in the ME7 module in WGCNA analysis. Finally, we experimentally explored the regulatory mechanism of KAST on IL33 and GATA3 in asthmatic mice. This study will provide a basis for further research on the pharmacological mechanism of KAST. The working flowchart is shown in Figure 1.
2. Materials and Methods
2.1. Network Pharmacology
2.1.1. Screening for Active KAST Targets
The active ingredients in KAST obtained on November 20, 2022, are from the TCMSP (https://tcmspw.com/tcmsp.php) and HERB database (https://herb.ac.cn/) . In order to screen out qualified active ingredients and their potential protein targets, it is mainly based on drug-like properties (DL) ≥ 0.18, Mw ≤ 500, miLogP ≤ 5, nOH ≤ 10, and nOHNH ≤ 5. Small molecule compounds reported in the literature that can pass through the skin and play a role in improving inflammation are also included as small molecule compounds.
2.1.2. Screening for Asthma Targets and Intersection Targets.
We screened asthma-related goals and entered “Asthma” as the search term by using the GeneCards (https://www.genecards.org/), OMIM (https://www.omim.org/), and TTD (https://db.idrblab.net/ttd/) databases on November 25, 2022, and “asthma” was retrieved as a keyword. The “Asthma” targets collected from the three databases and the targets of KAST were then mapped in Venny 2.1.0 (https://bioinfogp.cnb.csic.es/tools/venny/index.html) to obtain the overlapping targets.
2.1.3. PPI Network and Target Analysis
The intersection targets of KAST and asthma were imported into the STRING database (https://string-db.org) to construct a PPI network model on November 25, 2022. The protein type was set to Homo sapiens, and the screening conditions were set to high confidence (0.700). We imported the screened results into Cytoscape 3.7.2 for topological analysis of these proteins. Finally, the final analysis results were used to construct the “Herb-Compound–Target-Disease” network map.
2.1.4. GO and KEGG Enrichment Analyses
The core targets were imported into the DAVID database (https://david.ncifcrf.gov/summary.jsp) and “Homo sapiens” was set as a filter. Bioinformatics (https://www.bioinformatics.com.cn/) was used to visualize the filtered results from BP, MF, and CC visualizations, which were selected by GO analysis on November 28, 2022. The top 10 enrichment pathways of the KEGG enrichment pathway analysis were screened [19].
2.1.5. Screening for DEGs of Asthma and Analysis
Expression profile data from GSE134544 were obtained from the GEO database (https://www.ncbi.nlm.nih.gov/geo/) on November 28, 2022. Samples were peripheral blood data from 40 asthmatics and 21 healthy individuals before omalizumab treatment. First, the data were cleaned and organized. The “limma” function was then used for data preprocessing and gene expression profiling data between patients with asthma and controls. DEGs were visualized by volcano plots and heatmaps drawn by “ggplot2” and “pheatmap.”
2.1.6. Construction of WGCNA and Detection of Modules
WGCNA is widely used to systematically analyze gene expression in multiple samples. WGCNA constructs genes with similar expression patterns into many modules and links these modules with clinical information. Finally, key genes closely related to clinical information were identified [20]. First, we cluster the gene expression profiles of the samples. Then, we chose a soft threshold and calculated intergenic correlations by TOM. Finally, the MM was calculated by using the WGCNA function signedKME, where deep split = 2 and minModuleSize = 30, and we construct the suitability of the clustering tree based on the TOM value [21].
2.1.7. Identifying Clinically Related Modules and Genes
ME summarized all modules. The expression profiles of all genes in the module were represented by a synthetic gene through which the most important principal components of each module were calculated. Correlations between ME and clinical features were calculated. Gene-trait significance values representing the relative levels between genes and traits were then calculated using the Pearson correlation formula to identify the genes most associated with asthma.
2.1.8. Molecular Docking
The five active ingredients with the highest degree were molecularly docked with proteins in the PPI network. We collected the structures of these active ingredients and proteins through the PubChem database (https://pubchem.ncbi.nlm.nih.gov) or the PDB database (https://www.rcsb.org) on November 30, 2022 [22]. SYBYL-X (Version 2.1.1, Tripos Inc.) software was used to process protein structures and complete molecular docking [23]. The total score is used to evaluate the binding ability of the active compound to the target protein, and the higher the score, the stronger the binding activity. A total score of > 5.0 indicates a good binding activity.
2.2. Animal Experiment
2.2.1. Mice
A total of 48 female 8-week-old BALB/c mice were purchased from Jiangsu Academy of Traditional Chinese Medicine and randomly divided into the normal group, model group, KAST group, and budesonide group (n = 12). These mice will be used to detect lung tissue pathology, IL33 expression, ILC2s, number and GATA3 expression. Three mice will be used to detect the lung tissue pathology and IL33. Four mice will be used to detect the number of ILC2s. Four mice will be used to detect GATA3 expression. Mice were housed on a 12 h light and dark cycle with ad libitum access to food and clean water. All procedures were performed in accordance with the Declaration of Helsinki of the World Medical Association. All animal protocols were approved by the Ethics Committee of the Affiliated Hospital of Nanjing University of Traditional Chinese Medicine (2021NL-KS096).
2.2.2. Preparation of KAST
Sinapis semen (batch number: 21101213), Corydalis Rhizoma (batch number: 21112703), Kansui radix (batch number: 210901), Asari radix et rhizoma (batch number: 211101), Ephedra herba (batch number: 21120209), Lepidii semen descurainiae semen (batch number: 21071511), Caryophylli flos (batch number: 211201), Cinnamomi cortex (batch number: 21102224), and Gleditsiae fructus abnormalis (batch number: 220101) were all purchased by Jiangsu Provincial Hospital of Traditional Chinese Medicine. These medicines were then made into 5g pills according to the ratio of 2:2:1:1:1:1:1:1:1:1:1.
2.2.3. Establishment of the Asthma Mouse Model and Treatment
Mice were modeled by intranasally dripping HDM, and the specific model-making method is shown in Figure 2. The normal group did not intervene, the model group was modeled with HDM, KAST was treated with KAST for half an hour, and the budesonide group was treated with nebulized budesonide inhalation.

2.2.4. Lung Histopathology Assessment
The mice were sacrificed within 12 h after the final treatment by an overdose of anesthesia (3% pentobarbital at 200 mg/kg via intraperitoneal injection, 160 μL/each as average) and lung lobes were extracted and fixed in 4% paraformaldehyde for 24 h and embedded in paraffin. Tissues were sectioned into 5 μm thick sections, deparaffinized, hydrolyzed, and stained with hematoxylin and eosin.
2.2.5. Immunohistochemistry
Lung tissue was fixed in 4% paraformaldehyde and embedded in paraffin. Tissue sections were blocked with 5% goat serum for 30 min at 37°C and incubated overnight at 4°C with mouse IL33 (R&D, AF1004). Tissue sections were then incubated with the secondary antibody for 1 h at room temperature. 3,3-Diaminobenzidine was used as a chromogen, and hematoxylin was used as a counterstain.
2.2.6. Flow Cytometry
LSR II flow cytometry was used to measure the expression of GATA3 in ILC2 in lung tissue. ILC2s were defined as Lin-, CD45+, CD90.2+, and KLRG1+. Lung tissue was ground to prepare a single-cell suspension and erythrocyte lysate was added. Single-cell suspensions were stimulated and blocked for 4 h. Extracellular antibodies were added to CD3 (Biolegend, 100304), CD4 (Biolegend, 100404), CD8a (Biolegend, 100704), CD11b (Biolegend, 101204), CD11c (Biolegend, 117304), CD19 (Biolegend, 115504), CD49b (Biolegend, 108904), TER-119 (Biolegend, 116204), Ly-6G (Biolegend, 108404) CD45 (Biolegend, 103121), CD90.2 (Biolegend, 742081), and KLRG1 (Biolegend, 17-5893-81). Then, the secondary antibody conjugate was added. Transcription Factor Fix and True-Nuclear 1X Perm Buffer were used to fix ruptured membranes. The single-cell suspension was washed and tested on the machine.
2.3. Statistical Analysis
In GO functional enrichment and KEGG pathway enrichment, a p value < 0.05 was considered statistically significant. Statistically significant DEGs were defined as adjusted p values of < 0.05 and |log2FC| of > 0.5 as cutoff criteria. Statistical analysis was performed using GraphPad Prism software. Data are presented as mean ± standard error. A p value less than 0.05 was considered to be statistically significant. Two-tailed unpaired Student’s t-test or analysis of variance with Tukey post hoc test for data with more than two groups was performed to determine statistical significance. Data are expressed as mean ± SEM.
3. Results
3.1. Network Pharmacology
3.1.1. Screening of Active Components and Targets of KAST
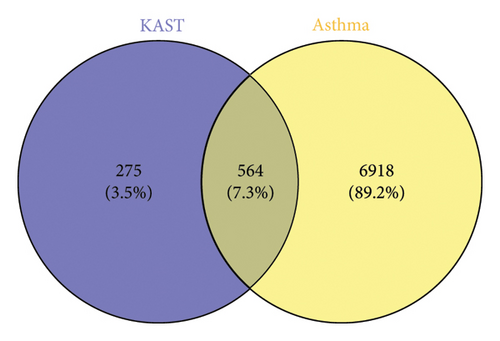
A total of 107 active ingredients were deleted and selected through TCMSP, HERB database, and literature search. β-Sitosterol as a topical formulation has been shown to reduce immune cell infiltration and inflammatory cytokine levels in a topical setting [24]. Sinapis semen, Corydalis rhizoma, Kansui radix, Asari radix et rhizoma, Ephedra herba, Lepidii semen descurainiae semen, Caryophylli flos, Cinnamomi cortex, and Gleditsiae fructus abnormalis had 2, 61, 6, 10, 19, 6, 8, 2, and 1 active ingredients, respectively, as shown in Table 1. A total of 839 gene targets were obtained by integrating 107 active compound targets as shown in Figure 3.
| No. | Mol ID | Molecule name | MW | AlogP | Hdon | Hacc | DL | Herbal name |
|---|---|---|---|---|---|---|---|---|
| 1 | MOL001697 | Sinoacutine | 325.39 | 1 | 1 | 5 | 0.53 | Sinapis semen |
| 2 | MOL001760 | Myronate | 358.41 | −1.87 | 4 | 10 | 0.19 | Sinapis semen |
| 3 | MOL000098 | Quercetin | 302.25 | 1.5 | 5 | 7 | 0.28 | Corydalis rhizoma |
| 4 | MOL000472 | Emodin | 270.25 | 2.49 | 3 | 5 | 0.24 | Corydalis rhizoma |
| 5 | MOL004224 | Pontevedrine | 381.41 | 2.63 | 0 | 7 | 0.71 | Corydalis rhizoma |
| 6 | MOL004198 | 18797-79-0 | 367.43 | 2.73 | 1 | 6 | 0.85 | Corydalis rhizoma |
| 7 | MOL000476 | Physcion | 284.28 | 2.74 | 2 | 5 | 0.27 | Corydalis rhizoma |
| 8 | MOL004210 | (1S,8′R)-6,7-Dimethoxy-2-methylspiro [3,4-dihydroisoquinoline-1,7′-6,8-dihydrocyclopenta [g][1,3] benzodioxole]-8′-ol | 369.45 | 2.75 | 1 | 6 | 0.72 | Corydalis rhizoma |
| 9 | MOL004218 | 31098-60-9 | 399.48 | 2.78 | 1 | 7 | 0.89 | Corydalis rhizoma |
| 10 | MOL000791 | Bicuculline | 367.38 | 2.83 | 0 | 7 | 0.88 | Corydalis rhizoma |
| 11 | MOL004217 | Micheline B | 275.27 | 2.88 | 0 | 4 | 0.53 | Corydalis rhizoma |
| 12 | MOL004226 | 24240-05-9 | 353.4 | 2.95 | 0 | 6 | 0.83 | Corydalis rhizoma |
| 13 | MOL000787 | Fumarine | 353.4 | 2.95 | 0 | 6 | 0.83 | Corydalis rhizoma |
| 14 | MOL004221 | Norglaucing | 341.44 | 3 | 1 | 5 | 0.56 | Corydalis rhizoma |
| 15 | MOL004201 | 4H-Dibenzo (de,g) quinoline-1,11-diol, 5,6,6a,7-tetrahydro-2,10-dimethoxy-6-methyl-, (S)- | 327.41 | 3.03 | 2 | 5 | 0.51 | Corydalis rhizoma |
| 16 | MOL004763 | Izoteolin | 327.41 | 3.03 | 2 | 5 | 0.51 | Corydalis rhizoma |
| 17 | MOL004222 | Oxoglaucine | 351.38 | 3.04 | 0 | 6 | 0.62 | Corydalis rhizoma |
| 18 | MOL000793 | C09367 | 325.39 | 3.08 | 1 | 5 | 0.69 | Corydalis rhizoma |
| 19 | MOL000217 | (S)-Scoulerine | 327.41 | 3.1 | 2 | 5 | 0.54 | Corydalis rhizoma |
| 20 | MOL004193 | Clarkeanidine | 327.41 | 3.1 | 2 | 5 | 0.54 | Corydalis rhizoma |
| 21 | MOL004208 | Demethylcorydalmatine | 327.41 | 3.1 | 2 | 5 | 0.54 | Corydalis rhizoma |
| 22 | MOL004223 | 18797-80-3 | 409.47 | 3.11 | 0 | 7 | 0.8 | Corydalis rhizoma |
| 23 | MOL004234 | 2,3,9,10-Tetramethoxy-13-methyl-5,6-dihydroisoquinolino [2,1-b] isoquinolin-8-one | 381.46 | 3.14 | 0 | 6 | 0.73 | Corydalis rhizoma |
| 24 | MOL001460 | Cryptopin | 369.45 | 3.15 | 0 | 6 | 0.72 | Corydalis rhizoma |
| 25 | MOL000792 | Fagarine I | 369.45 | 3.15 | 0 | 6 | 0.72 | Corydalis rhizoma |
| 26 | MOL004199 | Corynoloxine | 365.41 | 3.16 | 0 | 6 | 0.6 | Corydalis rhizoma |
| 27 | MOL004230 | Stylopine | 323.37 | 3.2 | 0 | 5 | 0.85 | Corydalis rhizoma |
| 28 | MOL001458 | Coptisine | 320.34 | 3.25 | 0 | 4 | 0.86 | Corydalis rhizoma |
| 29 | MOL004225 | Pseudocoptisine | 320.34 | 3.25 | 0 | 4 | 0.86 | Corydalis rhizoma |
| 30 | MOL004228 | Saulatine | 396.47 | 3.25 | 0 | 6 | 0.79 | Corydalis rhizoma |
| 31 | MOL004197 | Corydine | 341.44 | 3.28 | 1 | 5 | 0.55 | Corydalis rhizoma |
| 32 | MOL004220 | N-Methyllaurotetanine | 341.44 | 3.28 | 1 | 5 | 0.56 | Corydalis rhizoma |
| 33 | MOL004233 | ST057701 | 341.44 | 3.28 | 1 | 5 | 0.56 | Corydalis rhizoma |
| 34 | MOL004191 | Capaurine | 371.47 | 3.33 | 1 | 6 | 0.69 | Corydalis rhizoma |
| 35 | MOL004202 | Dehydrocavidine | 351.43 | 3.33 | 0 | 5 | 0.81 | Corydalis rhizoma |
| 36 | MOL003939 | Nantenine | 339.42 | 3.34 | 0 | 5 | 0.74 | Corydalis rhizoma |
| 37 | MOL004232 | Tetrahydroprotopapaverine | 329.43 | 3.34 | 2 | 5 | 0.33 | Corydalis rhizoma |
| 38 | MOL000790 | Isocorypalmine | 341.44 | 3.35 | 1 | 5 | 0.59 | Corydalis rhizoma |
| 39 | MOL001457 | Columbamine | 338.41 | 3.4 | 1 | 4 | 0.59 | Corydalis rhizoma |
| 40 | MOL004205 | Dehydrocorydalmine | 338.41 | 3.4 | 1 | 4 | 0.59 | Corydalis rhizoma |
| 41 | MOL002903 | (R)-Canadine | 339.42 | 3.4 | 0 | 5 | 0.77 | Corydalis rhizoma |
| 42 | MOL004200 | Methyl-[2-(3,4,6,7-tetramethoxy-1-phenanthryl) ethyl] amine | 355.47 | 3.44 | 1 | 5 | 0.44 | Corydalis rhizoma |
| 43 | MOL001454 | Berberine | 336.39 | 3.45 | 0 | 4 | 0.78 | Corydalis rhizoma |
| 44 | MOL001474 | Sanguinarine | 332.35 | 3.47 | 0 | 4 | 0.86 | Corydalis rhizoma |
| 45 | MOL004190 | (−)-alpha-N-Methylcanadine | 354.46 | 3.49 | 0 | 4 | 0.8 | Corydalis rhizoma |
| 46 | MOL004231 | Tetrahydrocorysamine | 337.4 | 3.52 | 0 | 5 | 0.86 | Corydalis rhizoma |
| 47 | MOL004211 | Glauvent | 355.47 | 3.54 | 0 | 5 | 0.61 | Corydalis rhizoma |
| 48 | MOL004071 | Hyndarin | 355.47 | 3.6 | 0 | 5 | 0.64 | Corydalis rhizoma |
| 49 | MOL004207 | Dehydronantenine | 337.4 | 3.62 | 0 | 5 | 0.75 | Corydalis rhizoma |
| 50 | MOL000785 | Palmatine | 352.44 | 3.65 | 0 | 4 | 0.65 | Corydalis rhizoma |
| 51 | MOL004235 | 104387-15-7 | 355.47 | 3.67 | 1 | 5 | 0.63 | Corydalis rhizoma |
| 52 | MOL001463 | Dihydrosanguinarine | 333.36 | 3.71 | 0 | 5 | 0.86 | Corydalis rhizoma |
| 53 | MOL002670 | Cavidine | 353.45 | 3.72 | 0 | 5 | 0.81 | Corydalis rhizoma |
| 54 | MOL004206 | Dehydroglaucine | 353.45 | 3.82 | 0 | 5 | 0.61 | Corydalis rhizoma |
| 55 | MOL004203 | Dehydrocorybulbine | 352.44 | 3.88 | 1 | 4 | 0.63 | Corydalis rhizoma |
| 56 | MOL004209 | 13-Methyldehydrocorydalmine | 352.44 | 3.88 | 1 | 4 | 0.63 | Corydalis rhizoma |
| 57 | MOL004216 | 13-Methylpalmatrubine | 352.44 | 3.88 | 1 | 4 | 0.63 | Corydalis rhizoma |
| 58 | MOL001461 | Dihydrochelerythrine | 349.41 | 3.91 | 0 | 5 | 0.81 | Corydalis rhizoma |
| 59 | MOL004215 | Leonticine | 327.46 | 3.91 | 1 | 4 | 0.26 | Corydalis rhizoma |
| 60 | MOL004195 | Corydaline | 369.5 | 3.92 | 0 | 5 | 0.68 | Corydalis rhizoma |
| 61 | MOL004204 | Dehydrocorydaline | 366.47 | 4.13 | 0 | 4 | 0.68 | Corydalis rhizoma |
| 62 | MOL004194 | Corybulbine | 353.5 | 4.42 | 0 | 4 | 0.62 | Corydalis rhizoma |
| 63 | MOL004196 | Corydalmine | 340.45 | 4.68 | 1 | 4 | 0.59 | Corydalis rhizoma |
| 64 | MOL002587 | Euphorbetin | 354.28 | 2.42 | 4 | 8 | 0.54 | Kansui radix |
| 65 | MOL002589 | Euponin | 360.44 | 1.74 | 1 | 6 | 0.49 | Kansui radix |
| 66 | MOL002590 | Karacolidine | 393.58 | −0.9 | 4 | 6 | 0.71 | Kansui radix |
| 67 | MOL002583 | 3-O-Benzoyl-20-deoxyingenol | 436.59 | 3.54 | 2 | 5 | 0.8 | Kansui radix |
| 68 | MOL002585 | 5-O-Benzoyl-20-deoxyingenol | 436.59 | 3.54 | 2 | 5 | 0.79 | Kansui radix |
| 69 | MOL002598 | 20-OD-Ingenol Z | 498.72 | 4.18 | 3 | 6 | 0.85 | Kansui radix |
| 70 | MOL012140 | 4,9-Dimethoxy-1-vinyl-$b-carboline | 254.31 | 3.38 | 0 | 3 | 0.19 | Asari radix et rhizoma |
| 71 | MOL001460 | Cryptopin | 369.45 | 3.15 | 0 | 6 | 0.72 | Asari radix et rhizoma |
| 72 | MOL001558 | Sesamin | 354.38 | 2.24 | 0 | 6 | 0.83 | Asari radix et rhizoma |
| 73 | MOL002501 | [(1S)-3-[(E)-but-2-enyl]-2-Methyl-4-oxo-1-cyclopent-2-enyl] (1R,3R)-3-[(E)-3-methoxy-2-methyl-3-oxoprop-1-enyl]-2,2-dimethylcyclopropane-1-carboxylate | 360.49 | 3.68 | 0 | 5 | 0.31 | Asari radix et rhizoma |
| 74 | MOL009849 | ZINC05223929 | 354.38 | 2.24 | 0 | 6 | 0.83 | Asari radix et rhizoma |
| 75 | MOL000986 | 1-Asarinine | 354.38 | 2.24 | 0 | 6 | 0.83 | Asari radix et rhizoma |
| 76 | MOL002962 | (3S)-7-Hydroxy-3-(2,3,4-trimethoxyphenyl) chroman-4-one | 330.36 | 2.67 | 1 | 6 | 0.33 | Asari radix et rhizoma |
| 77 | MOL012141 | Caribine | 326.43 | 1.22 | 2 | 5 | 0.83 | Asari radix et rhizoma |
| 78 | MOL012142 | Estriol | 288.42 | 2.85 | 3 | 3 | 0.36 | Asari radix et rhizoma |
| 79 | MOL000422 | Kaempferol | 286.25 | 1.77 | 4 | 6 | 0.24 | Asari radix et rhizoma |
| 80 | MOL010546 | ST069309 | 285.32 | 2.69 | 1 | 5 | 0.38 | Ephedra herba |
| 81 | MOL005573 | Genkwanin | 284.28 | 2.59 | 2 | 5 | 0.24 | Ephedra herba |
| 82 | MOL005734 | Eupatilin | 344.34 | 2.55 | 2 | 7 | 0.38 | Ephedra herba |
| 83 | MOL005842 | Pectolinarigenin | 314.31 | 2.57 | 2 | 6 | 0.3 | Ephedra herba |
| 84 | MOL002083 | Tricin | 330.31 | 2.3 | 3 | 7 | 0.34 | Ephedra herba |
| 85 | MOL000008 | Apigenin | 270.25 | 2.33 | 3 | 5 | 0.21 | Ephedra herba |
| 86 | MOL002881 | Diosmetin | 300.28 | 2.32 | 3 | 6 | 0.27 | Ephedra herba |
| 87 | MOL004328 | Naringenin | 272.27 | 2.3 | 3 | 5 | 0.21 | Ephedra herba |
| 88 | MOL002817 | Picein | 298.32 | −0.6 | 4 | 7 | 0.19 | Ephedra herba |
| 89 | MOL000422 | Kaempferol | 286.25 | 1.77 | 4 | 6 | 0.24 | Ephedra herba |
| 90 | MOL000006 | Luteolin | 286.25 | 2.07 | 4 | 6 | 0.25 | Ephedra herba |
| 91 | MOL005190 | Eriodictyol | 288.27 | 2.03 | 4 | 6 | 0.24 | Ephedra herba |
| 92 | MOL009807 | CHD | 408.64 | 2.89 | 4 | 5 | 0.72 | Ephedra herba |
| 93 | MOL010788 | Leucopelargonidin | 290.29 | 1.36 | 5 | 6 | 0.24 | Ephedra herba |
| 94 | MOL002823 | Herbacetin | 302.25 | 1.5 | 5 | 7 | 0.27 | Ephedra herba |
| 95 | MOL000098 | Quercetin | 302.25 | 1.5 | 5 | 7 | 0.28 | Ephedra herba |
| 96 | MOL000492 | (+)-catechin | 290.29 | 1.92 | 5 | 6 | 0.24 | Ephedra herba |
| 97 | MOL004576 | Taxifolin | 304.27 | 1.49 | 5 | 7 | 0.27 | Ephedra herba |
| 98 | MOL011865 | Rosmarinic acid | 360.34 | 2.69 | 5 | 8 | 0.35 | Ephedra herba |
| 99 | MOL003906 | k-Strophanthoside_qt | 404.55 | 1.34 | 3 | 6 | 0.78 | Lepidii semen descurainiae semen |
| 100 | MOL003908 | Cynotoxin | 404.55 | 1.34 | 3 | 6 | 0.78 | Lepidii semen descurainiae semen |
| 101 | MOL000098 | Quercetin | 302.25 | 1.5 | 5 | 7 | 0.28 | Lepidii semen descurainiae semen |
| 102 | MOL000354 | Isorhamnetin | 316.28 | 1.76 | 4 | 7 | 0.31 | Lepidii semen descurainiae semen |
| 103 | MOL000422 | Kaempferol | 286.25 | 1.77 | 4 | 6 | 0.24 | Lepidii semen descurainiae semen |
| 104 | MOL003912 | DTX | 374.57 | 3.38 | 2 | 4 | 0.71 | Lepidii semen descurainiae semen |
| 105 | MOL013214 | Isoeruboside_B_qt | 432.71 | 3.72 | 2 | 4 | 0.79 | Caryophylli flos |
| 106 | MOL013218 | Strictosamide | 498.58 | 0.24 | 5 | 9 | 0.63 | Caryophylli flos |
| 107 | MOL013219 | Strictosamide_qt | 336.42 | 1.98 | 2 | 4 | 0.76 | Caryophylli flos |
| 108 | MOL001654 | Oleanolic acid-28-O-beta-D-glucopyranoside | 618.94 | 4.52 | 5 | 8 | 0.41 | Caryophylli flos |
| 109 | MOL000251 | Rhamnocitrin | 300.28 | 2.02 | 3 | 6 | 0.27 | Caryophylli flos |
| 110 | MOL000422 | Kaempferol | 286.25 | 1.77 | 4 | 6 | 0.24 | Caryophylli flos |
| 111 | MOL005889 | Rhamnetin | 316.28 | 1.76 | 4 | 7 | 0.3 | Caryophylli flos |
| 112 | MOL000098 | Quercetin | 302.25 | 1.5 | 5 | 7 | 0.28 | Caryophylli flos |
| 113 | MOL000098 | Quercetin | 302.25 | 1.5 | 5 | 7 | 0.28 | Cinnamomi cortex |
| 114 | MOL006505 | Epicatechin | 290.29 | 1.92 | 5 | 6 | 0.24 | Cinnamomi cortex |
3.1.2. Collection of Target Proteins Associated With Asthma and Common Targets
A total of 7482 gene targets were collected from asthma disease target genes from GeneCards, OMIM, and TTD databases. Venny 2.1.0 was used to screen the intersection of KAST drug targets and asthma disease targets as potential therapeutic targets for KAST in the treatment of asthma. A total of 564 common targets are shown in the Venn diagram in Figure 3.
3.1.3. Construction of the PPI Network and Herb-Compound–Target-Disease Network Analysis
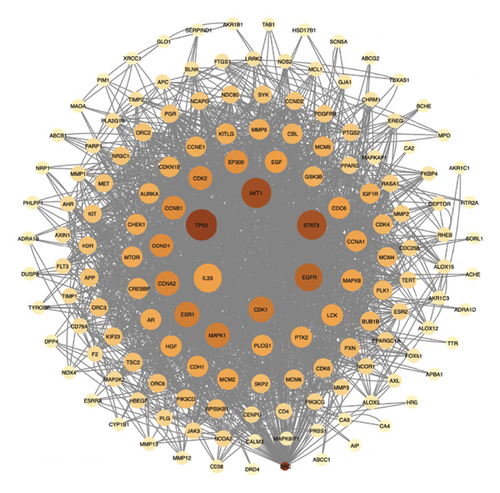
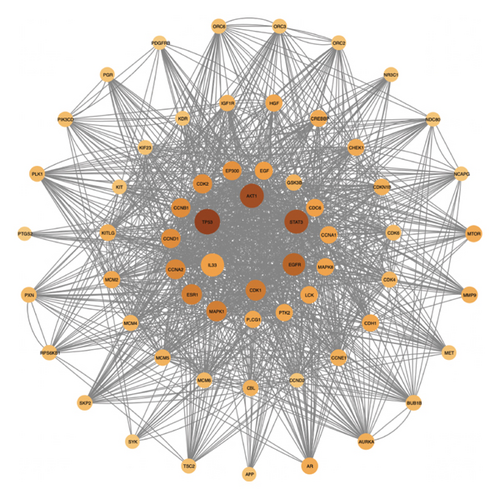
There was a total of 153 nodes and 2010 edges, as shown in Figure 4(a). The average node degree of the target network is 26.27. Targets with a degree greater than 2 times the average are core targets, and there are 15 in total in Figure 4(b).
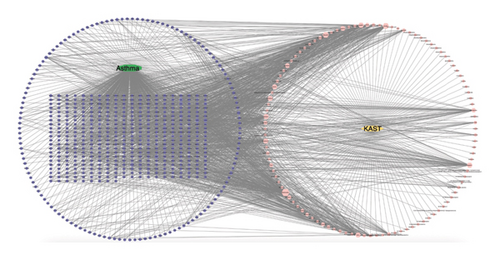
Herb-compound–target-disease network Analysis identified 673 nodes (1 herbal formula, 107 active compounds, 564 shared target genes, and 1 disease) and 2095 edges in Figure 5. The top five active compounds were rhamnocitrin, emodin, glauvent, eupatilin, and Micheline B.
3.1.4. Enrichment Analysis by GO and KEGG Analyses
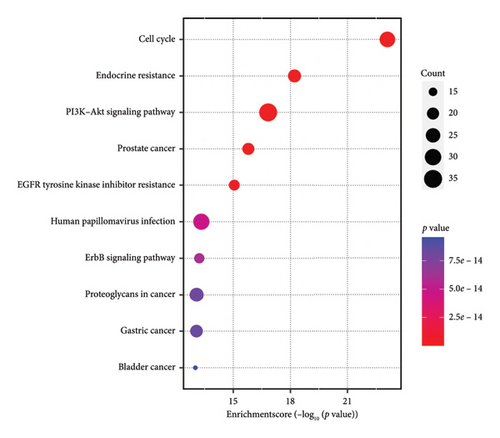
The common targets were poured into the DAVID database for enrichment analysis, and a total of 1369 targets were obtained, including 1238 BP, 52 CC, and 79 MF targets, as shown in Figure 6(a). KEGG results showed that the key signaling pathways include the cell cycle, endocrine resistance, and PI3K/AKT, as shown in Figure 6(b).

3.1.5. Identification of DEGs
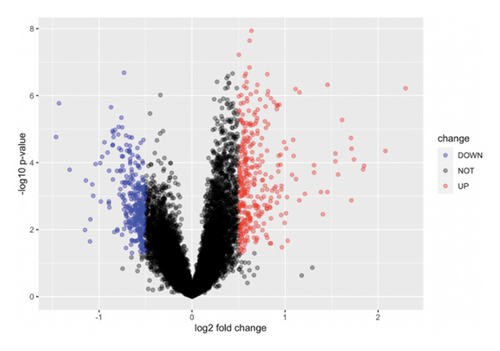
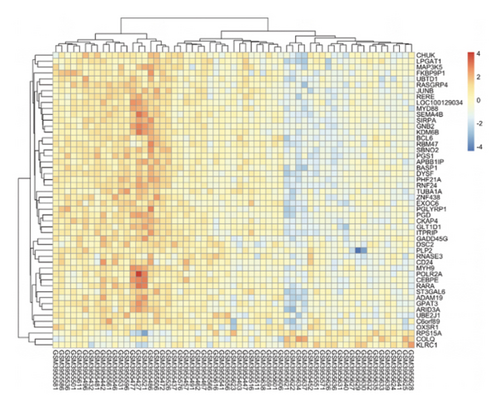
We obtained DEGs for asthma from GEO by analyzing GSE134544. GSE134544 was collected from the whole blood. The DEG volcano plot of patients with asthma is shown in Figure 7(a). A total of 649 DEGs were screened, of which 338 genes were upregulated and 311 were downregulated. The top 50 DEGs in GSE134544 are shown in Figure 7(b).
3.1.6. Weighted Coexpression Network Construction and Key Modules Identification
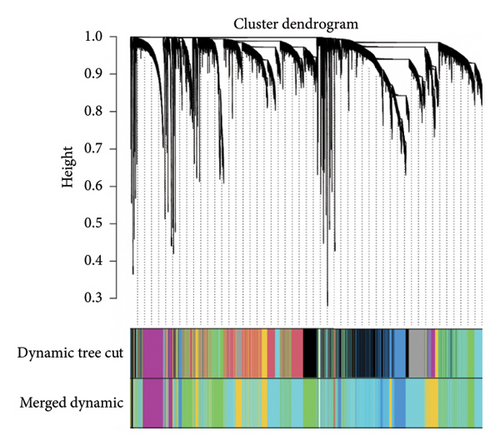
The GSE134544 samples were clustered using hierarchical agglomerative clustering with average linkage. It was used to construct coexpression networks in this study. A soft threshold of 14 was chosen as the correlation coefficient threshold to ensure a scale-free network. A total of 20 modules were identified through WGCNA, as shown in Figure 8(a).
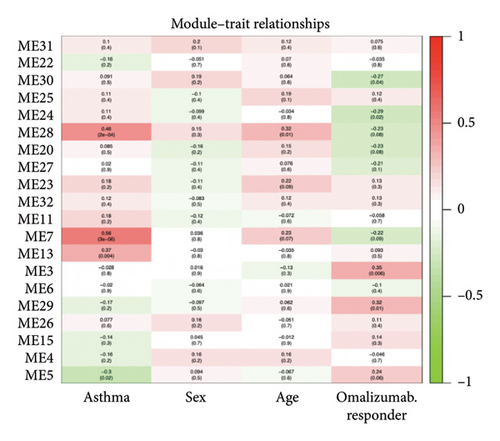
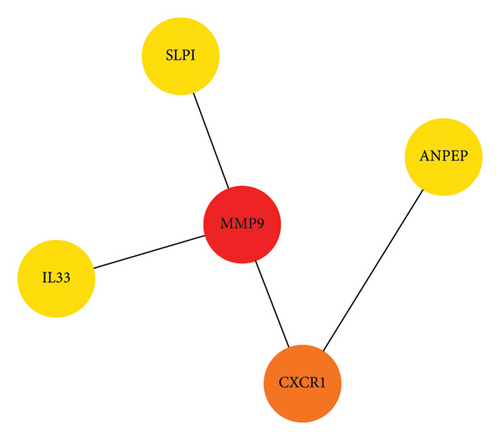
A heatmap was then constructed to show the association between each WGCNA module and clinical features in Figure 8(b). Green modules represent negative correlations with clinical features, and red modules represent positive correlations with clinical features. ME7 and ME28 had the highest correlation coefficient with asthma and showed a positive correlation (all p values < 0.05). We comprehensively analyzed KAST and asthma target genes, DEGs, and WGCNA module gene expression and constructed a core PPI network, as shown in Figure 8(c).
3.1.7. Molecular Docking
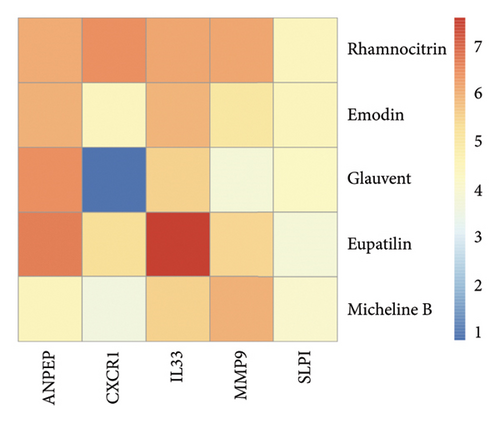
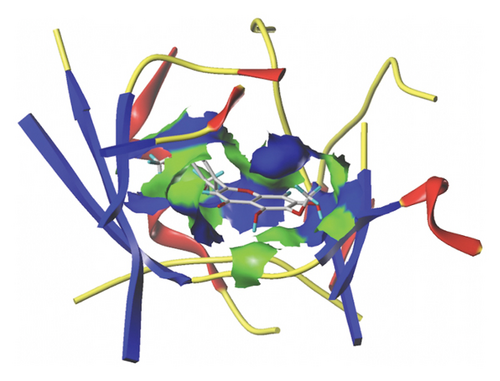
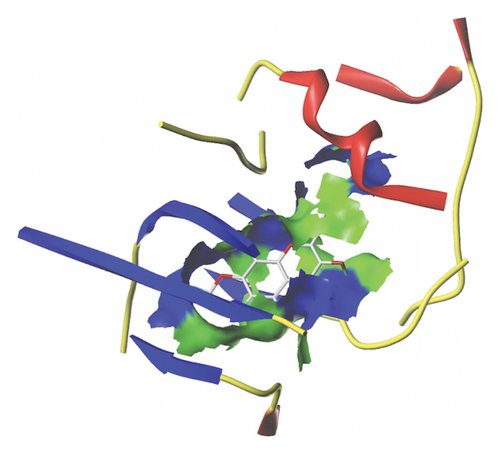
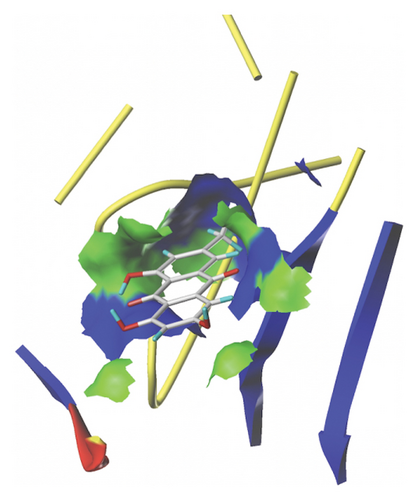
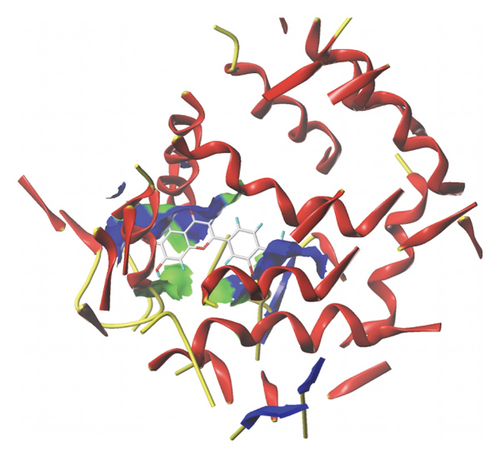
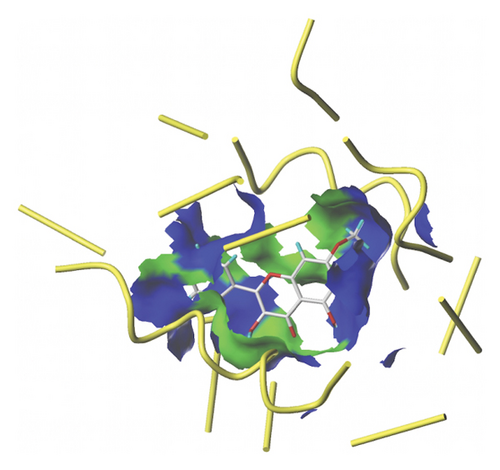
We docked five active ingredients to proteins in the PPI network. The highest docking score is that of eupatilin with IL33 which is 7.4747, as shown in Figure 9(a). The docking results of eupatilin and IL33 are shown in Figure 9(b). The compound with the highest docking score with MMP9 was rhamnocitrin with a docking score of 6.046, as shown in Figure 9(c). The highest docking score with SLPI is emodin, with a score of 4.3555 and the results are shown in Figure 9(d). The highest docking score with ANPEP is eupatilin, with a score of 6.583 and the docking results are shown in Figure 9(e). The highest docking score with CXCR1 is rhamnocitrin, with a score of 6.3772 and the docking results are shown in Figure 9(f).
3.2. Animal Experiment
3.2.1. Lung Histopathology
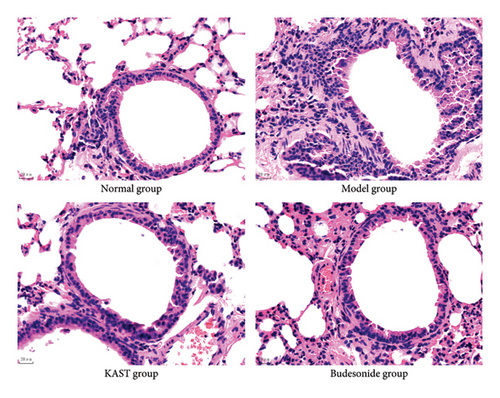
After 7 days of treatment, lung tissue from the mice was used to assess airway inflammation in asthmatic mice. Compared with the mice in the normal group, the lung tissue of the mice in the model group obviously had a large number of inflammatory cell infiltration around the trachea, thickened alveolar walls, and fluid extravasation. A large number of inflammatory cells infiltrated around the trachea of the mouse lung tissue, the alveolar wall was thickened, and the fluid extravasation was significantly improved after KAST treatment, as shown in Figure 10.
3.2.2. Expression of IL33 in Lung Tissue and Expression of GATA3 in ILC2
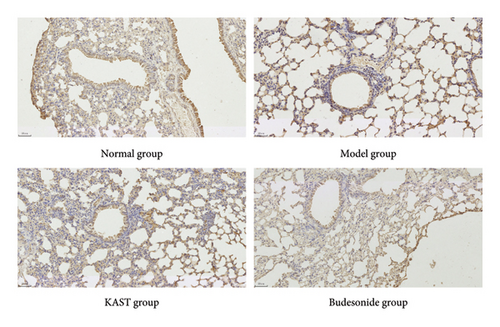
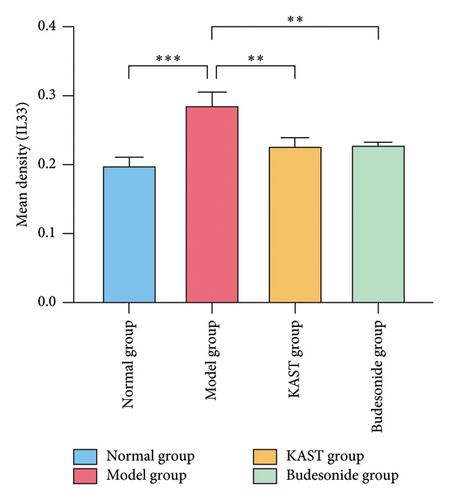
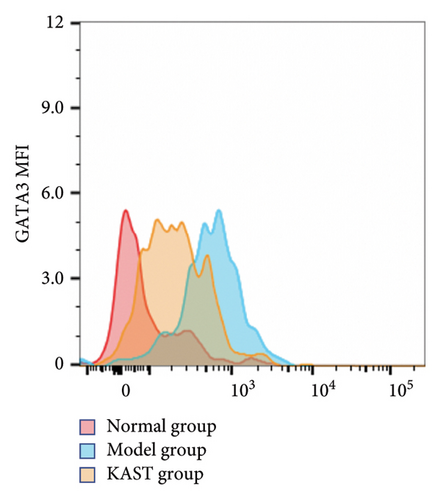
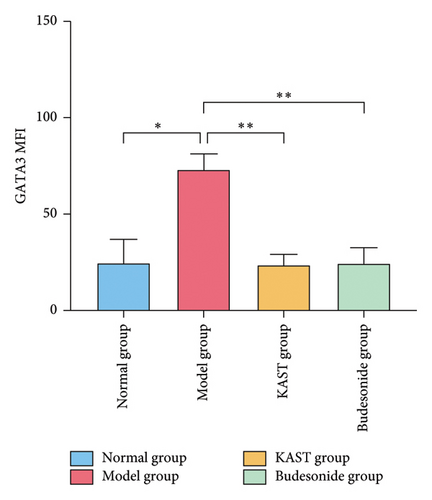
Compared to the normal group, the expression of IL33 in the lung group of the model group was significantly increased (p < 0.001). Compared to the model group, the expression of IL33 in the lung tissue of the KAST group was significantly reduced (p < 0.01), as shown in Figures 11(a) and 11(b). Compared to the normal group, the expression of GATA3 in the ILC2 of the model group was significantly increased (p < 0.05). Compared to the model group, the expression of GATA3 in the ILC2 of the KAST group was significantly reduced (p < 0.01), as shown in Figures 11(c) and 11(d).
4. Discussion
Asthma is a heterogeneous disease, and the interference between different genetic and environmental factors causes asthma to exhibit different phenotypes [25]. Approximately 70% of asthmatic phenotypes have been reported to be Type 2 inflammation, a chronic inflammation driven by Type 2 innate lymphocytes and helper cells and characterized by Type 2 inflammatory cytokines IL4, IL5, and IL13. These inflammatory factors promote eosinophil infiltration, mucus hyperplasia, airway smooth muscle contraction, and lung fibrosis [26]. Therefore, reducing Type 2 inflammation is an important way to improve asthma.
AST is a traditional therapy that can effectively improve asthma, reduce adverse reactions, and reduce the economic burden on patients [27]. Hu et al. found that AST can improve asthma airway inflammation by regulating PI3K/AKT signaling and inhibiting ILC2 [28]. AST can improve guinea pig asthma by affecting the metabolism of phospholipids, sphingolipids, purines, amino acids, and epinephrine [29]. KAST, as a therapy derived from AST, has also been shown to be effective in helping to improve asthma. Studies have confirmed that KAST can increase the ratio of Th1/Th2 cells in the peripheral blood of patients with asthma; reduce the content of Th2, IgE, and IL4; improve systemic immune response; and reduce the number of asthma attacks [16]. Therefore, KAST can reduce Type 2 inflammation and improve asthma in different ways.
In this study, the key compounds uncovered were rhamnocitrin, emodin, glauvent, eupatilin, and Micheline B through network pharmacology analysis. Studies have confirmed that rhamnocitrin plays an important role in antioxidant, antibacterial, anti-inflammatory, and other aspects [30]. Emodin has good antioxidant and anti-inflammatory effects and is mainly used in traditional medicine to treat swelling, sores, and blood stasis [31]. Micheline B and glauvent are derived from Corydalis Rhizoma and play a role in chronic inflammatory diseases. Eupatilin has been shown to help improve airway inflammation by modulating NF-κB and MAPK [32].
The key proteins selected by KAST in improving asthma were MMP9, CXCR1, SLPI, ANPEP, and IL33 by network pharmacology analysis. MMP9 is mainly produced by macrophages and neutrophils and is a marker of inflammation and tissue remodeling [33]. The absence of MMP9 induces airway inflammatory cellular infiltration and exacerbates airway hyperresponsiveness [34, 35]. The chemokine receptor CXCR1 and its ligand CXCL8 are essential for the activation and transport of inflammatory mediators [36]. CXCR1 is expressed in airway smooth muscle cells and regulates cell migration, leading to airway hyperresponsiveness and airway remodeling in asthma [37, 38]. SLPI is widely expressed in epithelial cells, including the airway, kidney, intestine, and other tissues [39]. The expression of SLPI in the shortened form was higher in the sputum of patients with asthma than in those of healthy people [40]. A previous study reported that knockout of SLPI resulted in decreased lung ventilation, airway eosinophilia, goblet cell hyperplasia, and elevated plasma IgE levels in ovalbumin (OVA)-induced asthmatic mice [41]. These studies suggest that the absence or loss of function of SLPI leads to an increased airway inflammation and persistent airway hyperresponsiveness. Studies have found that ANPEP is downregulated in Th2-high asthma patients [42]. IL33 and its receptor ST2 can promote airway hyperresponsiveness and eosinophilic airway inflammation in OVA-induced mice [43]. Therefore, IL33 can be used as a potential target for improving asthma.
GO functional analysis showed that asthma involves many biological processes, including signal transduction, inflammation, and apoptosis. KEGG enrichment analysis revealed cell cycle and PI3K/AKT signaling pathways. Previous studies have shown that Pinelliae Rhizoma Praeparatum reduces allergic airway inflammation by modulating the PKC/EGFR/MAPK/PI3K/AKT signaling pathway [44]. Studies have shown that microRNA-221 affects airway remodeling by regulating the extracellular matrix of airway smooth muscles in mice through the PI3K/AKT pathway [45]. The cell cycle is associated with cell growth and division and is a signal that regulates cell number. Type 2 immunity is an important factor leading to the exacerbation of asthma, and GATA3 is a key protein that regulates the differentiation and proliferation of ILC2. Cell cycle and PI3K/AKT pathways were the main pathways in the enrichment analysis and may be related to autophagy, inflammation, and immune responses.
Molecular docking results showed that kaempferol and IL33 had the highest docking scores and may be the main targets of KAST. At the same time, our experiments also confirmed that KAST can regulate the expression of GATA3 in IL33 and ILC2 in the lung tissue of asthmatic mice. IL33 is an important protein that regulates inflammatory response. Various environmental factors, including allergens, air pollutants, and viral and bacterial pathogens, activate IL33, which upregulates the expression of various inflammatory cytokines, leading to asthma exacerbations [46, 47]. IL33 induces the phosphorylation of GATA3, allowing it to enter the nucleus and produce Type 2 cytokines [48]. In ILC2, GATA3 needs to be phosphorylated by IL33 to produce inflammatory factors [49]. IL33 can promote the p38 MAPK pathway to affect the production of IL5, IL6, IL9, IL13, etc., by ILC2 [50]. These data suggest a potential mechanism by which KAST regulates asthma and provide support for KAST to improve asthma.
The above studies have shown that KAST can regulate asthma airway inflammation through multiple pathways, and affecting GATA3 to regulate ILC2s is its main pathway of action. From the perspective of the pathogenesis of asthma, GATA3 can promote the production of inflammatory factors and is one of the main factors affecting the occurrence of asthma. This may suggest the broad application prospects of KAST in helping to improve the clinical control rate of asthma patients. This study conducted a preliminary study on the effective components of KAST based on multiple data, but there are certain limitations. Therefore, it is necessary to further integrate the targets of different databases and combine mass spectrometry technology to conduct a more detailed exploration of the pharmacological components of KAST. Although this study conducted a preliminary study on the regulatory mechanism of KAST based on animal models, and there are also related clinical studies to explore the safety and effectiveness of KAST, there is a lack of large-sample human clinical trials and in vivo tests to verify the efficacy, safety, and applicable population of KAST in the treatment of asthma. Therefore, the next step of the experiment needs to further use animal models and clinical experimental studies to further explore the mechanism of action, potential chronic toxicity, and applicable population of KAST.
5. Conclusions
In general, the main active compounds of KAST are rhamnocitrin, emodin, glauvent, eupatilin, and Micheline B. Integrating network pharmacology and bioinformatics methods, IL33 is a potential target for KAST to improve asthma. Combined with experiments, we found that KAST can regulate IL33 and reduce the expression of GATA3 in ILC2 in asthmatic mice, which is helpful for improving airway inflammation.
Nomenclature
-
- KAST
-
- Kechuanting acupoint sticking therapy
-
- PPI
-
- Protein–protein interaction
-
- GO
-
- Gene ontology
-
- KEGG
-
- Kyoto Encyclopedia of Genes and Genomes
-
- PI3K
-
- Phosphoinositide 3-kinase
-
- TCM
-
- Traditional Chinese medicine
-
- AST
-
- Acupoint sticking therapy
-
- Mw
-
- Molecular weight
-
- BP
-
- Biological process
-
- MF
-
- Molecular function
-
- CC
-
- Cellular component
-
- DEGs
-
- Differentially expressed genes
-
- WGCNA
-
- Weighted gene coexpression network analysis
-
- TOM
-
- Topological overlap measure
-
- MM
-
- Module membership
-
- ME
-
- Module eigengenes
-
- H&E
-
- Hematoxylin and eosin
Conflicts of Interest
The authors declare no conflicts of interest.
Author Contributions
Lanying Liu provided ideas, guided the experiment, and completed the review. Kuan Di was responsible for the implementation of the experiment and the writing of the manuscript. All authors have read and approved the final version of the manuscript.
Funding
This study was supported by the National Natural Science Foundation of China (Grant no. 82274632).
Open Research
Data Availability Statement
The data used to support the findings of this study are included within the article.


