Exploring the Causality of Accident Severity on Mountainous Freeways With a Two-Stage Approach
Abstract
Studies on accident severity on mountainous freeways have predominantly centered on the personal injury level, rather than the aggregation level. However, for quantifying the accident causality, clustering the accident severity from multidimensional perspectives based on data-driven approach is seldom investigated in existing studies. To address this research gap, we propose a two-stage methodology that integrates accident clustering with Bayesian inference. Initially, a Gaussian mixture clustering algorithm is developed to categorize accident severity. Subsequently, a Bayesian network is constructed to explore the risk factors associated with accident severity. The proposed model is calibrated and validated using accident data collected from mountainous freeways in Yunnan Province, China, spanning the period from 2016 to 2021. The findings suggest that our proposed accident clustering method exhibits superior robustness compared to alternative clustering techniques. Bayesian inference analysis further elucidates that accident severity is significantly influenced by factors such as driving behavior, weather conditions, and road surface conditions.
1. Introduction
Mountainous freeways globally have been plagued by fatal traffic accidents. Notably, between 2012 and 2021, more than 50% of severe traffic accidents in China occurred on mountainous freeways [1]. As assisted driving and semiautonomous driving technologies, such as adaptive cruise control, automatic lane changing, and emergency braking systems, continue to advance, the safety of mountainous expressways is poised to garner significant attention [2, 3]. Consequently, investigating the causal relationship between the severity of accidents on mountainous expressways and their contributing factors holds substantial significance.
In contrast to urban highways, mountainous freeways are characterized by challenging terrain, featuring numerous sharp curves and steep downgrade segments [4]. The intricate topography of mountainous freeways necessitates drivers to continuously adjust their speed and steering, thereby elevating the risk of driving errors. For instance, on a hairpin bend of a mountain highway, a driver’s miscalculation of the turning radius can readily precipitate a rollover accident. Research has demonstrated that the complex roadway conditions can divert drivers’ attention from normal driving behaviors [5]. Furthermore, unlike the meteorological conditions prevalent in urban road networks, mountainous regions are more susceptible to diverse and rapidly changing weather phenomena, including fog, rain, snow, and strong winds. These adverse weather conditions can substantially impair visibility and render road surfaces slippery, thereby increasing braking distances and compromising vehicle stability. In urban settings, the impact of weather on driving is comparatively mitigated due to the relatively flat terrain and the moderating effects of urban heat islands. Consequently, it is necessary to investigate the causality of risk factors resulting in mountainous freeway traffic accidents in order to take appropriate and effective countermeasures to prevent them.
The accident severity was usually defined at the individual level in terms of the injuries sustained by the driver, the injuries sustained by traffic occupants in the accident or the highest injury to individual occupants [6]. However, these individual-level measures may be not a good indicator to reveal the true nature of the accidents. Since an accident may include casualties, property damage, and traffic jam, it is not reasonable to classify the accident severity level merely based on the individual injury. Some studies identified the accident severity level based on predefined rules that integrate individual level to crash level [7, 8]. However, such subjective integration methods are not easy to generalize without expert knowledge.
Given the discrete nature of accident data, discrete outcome models, such as logit and probit models, are usually employed to analyze the relationship between potential risk factors and accident severity [9–11]. Because traditional logit and probit models assumed that all parameters are fixed [12], they are unable to capture unobserved heterogeneity. Furthermore, the explanatory variables such as road surface condition (wet or not wet) and weather in the crash databases usually have intuitive association, which may not fulfill the noncollinearity requirement for independent variables in parametric modeling.
- 1.
A data-driven clustering approach is proposed to classify the traffic accident severity from multidimensional perspectives instead of the most serious personal injury, since an accident may include casualties, injuries, property damage, and traffic jam. Specifically, a Gaussian mixture clustering method is proposed to classify accident severity levels, which will provide an objective tool for specifying the severity level for arbitrary dataset without using predefined rules.
- 2.
A Bayesian network (BN) model is proposed to quantify the uncertain traffic safety factors and capture complex dependencies between accident severity and multiple risk factors. Specifically, the BN model provides probabilistic reasoning, which can quantify the likelihood of different accident severities under various conditions such as fatigue driving, weather, alignment, and surface conditions. Furthermore, one- and two-dimensional inference analyses are proposed to examine the magnitude of the effects of various risk factors contributing to the severity of collision injuries.
The rest of this paper is structured as follows. Section 2, following the introduction, offers a brief literature review related to the definition of accident severity, risk factors, and methodological approaches for accident analysis. Section 3 describes the data used for this study, followed by Section 4 on the analytical approach. Section 5 presents the results and the insight of accident severity analysis. Finally, research conclusions and future work are outlined in Section 6.
2. Literature Review
2.1. Definition of Accident Severity in Accidents
The accident severity is usually recorded at the individual level in terms of driver injury, the highest injury to passengers or vehicle occupants involved in accidents. For instance, Newnam et al. [13] classified injury severity into fatal and nonfatal based on the highest injury to the vehicle occupants involved in the crash. Rahimi et al. [8] defined the injury severity of a single-vehicle accident based on the driver’s injury.
The Federal Highway Administrations [14] defines accident severity on the KABCO scale that measures crash severity based on fatality (K), incapacitating injury (A), evident injury (B), minor injury (C), and property damage only (O). A fatal injury is defined as any injury that results in death within 30 days after the crash occurring. Incapacitating injury is defined as any injury other than a fatal injury which results in severe laceration, broken or distorted extremity, crush injuries, suspected skull, significant burns, unconsciousness when taken from the crash scene, or paralysis. Evident injury is defined as any injury that is evident at the scene of the crash other than fatal or serious injuries. Examples include lump on the head, abrasions, bruises, and minor lacerations. Minor injury is any injury reported or claimed which is not fatal or suspected serious, which includes momentary loss of consciousness, claim of injuries not evident, limping, or complaint of pain. Property damage only injury is defined as no personal injury includes harm to wild animals, or birds, which have monetary value and others. This scale is usually used by law enforcement for classifying crash injuries. Due to the low proportion of some injury categories using the KABCO scale in a specific scenario, Naik et al. [15] combined the injury into KA, B, C, and O categories. Similarly, Rezapour et al. [7] combined the adjacent injuries into one category, that is, KA, BC, and O categories. Ahmed et al. [16] further merged B, C, and O injury into one category, which classified injury levels into severe and nonsevere ones. However, most of the previous literature defined accident severity using the KABCO scale at the individual level, which may fail to represent the very nature of the accidents globally.
2.2. Risk Factors in Mountainous Freeways
Scholars have explored risk factors influencing accident severity in freeways [17–19]. Identified risk factors include the characteristics of the driver, vehicle, road, weather, light, and the specifics of the crash [4, 7, 20].
Driver-specific characteristics, including gender, age, alcohol consumption, driving fatigue, driving distractions, illicit drug use, and failure to use seatbelts, significantly influence the severity of traffic accidents [13, 21–23]. Regarding gender, numerous studies have demonstrated its heterogeneous impact on accident severity [24]. Specifically, some research suggests that female drivers are more susceptible to severe injuries, as they may exhibit less proficiency in handling emergencies compared to their male counterparts [25]. Chen and Chen [26] observed that the likelihood of severe injury escalates when drivers are distracted or drowsy.
Vehicle characteristics such as vehicle type, vehicle age, overloading, lane changing, and carrying hazardous materials were found to be associated with accidents [27, 28]. Rezapour et al. [7] found that collisions involving trucks in mountainous terrain have a heightened likelihood of resulting in severe and even fatal injuries, primarily attributed to brake failures or the loss of control while navigating downhill sections.
Road-specific characteristics such as curved alignment, downward slope, roadway surface conditions, speed limit, average daily traffic volume, and roadside barriers were found to significantly affect the severity of accidents in mountainous freeways [25, 29]. Wen et al. [30] found that a roadway curve featuring a moderate radius and slope exhibits a notably heightened probability of resulting in medium severity incidents, as opposed to a curve designed with a larger radius and a flatter slope. This finding confirms the critical role that the geometry of curves plays in influencing the severity of traffic accidents.
Environment characteristics such as weather conditions, lighting, and time of day also significantly influence the severity of accidents [17, 31]. Adverse weather conditions, encompassing phenomena such as rain, snow, fog, and strong winds, present a heightened threat to road safety, significantly increasing the likelihood of severe or even fatal injuries in comparison with favorable, clear weather conditions [26, 27] Wen and Xue, 2020).
2.3. Statistical Approaches for Accident Severity Analysis
Statistical approaches such as logit and probit models have been employed to estimate the effects of risk factors on accident severity [4, 30, 33]. However, statistical models assumed that the estimated parameters are fixed for all observations, which may lead to biased parameter estimates and erroneous inferences (Mannering et al., 2016). To address this issue, a number of studies leveraged a random parameters model with heterogeneity in means and variances, enabling the capture of multiple unobserved heterogeneity [18]. For instance, Pervez et al. [34] proposed a random parameter model accounting for heterogeneity in both means and variances to explore the multifaceted impacts of various factors encompassing the environment, driver behavior, crash dynamics, vehicle attributes, and tunnel-specific conditions. Wen et al. [30] introduced a correlated random parameter logit model and investigated the effects of the combination of curve and slope factor on the injury severity of truck crashes.
While logit or probit methodologies provide valuable insights into the correlation between risk factors and accident severity, they are inherently constrained by certain presuppositions or predefined functional forms, thus failing to fully capture the intricate interrelationships among variables. In contrast, BNs represent a probabilistic modeling paradigm that excels in depicting the dependencies and causal linkages among a diverse array of variables [35]. BNs have garnered significant interest in accident analysis and decision-making within the transportation domain. For instance, Li et al. [36] proposed a robust Bayesian robit model, incorporating the Student’s t distribution as the link function to address anomalous data points within traffic accident datasets. Liu et al. [37] introduced a Bayesian deep learning model for detecting freeway incidents with uncertainty quantification. Wu et al. [6] developed a BN to analyze crash injury severity, revealing significant interactions among risk factors. Their findings indicated that vehicle weight and crash mode notably influenced airbag deployment, which in turn had a substantial impact on crash severity.
In summary, previous studies usually focused on the personal injury level rather than the accident level, few of them further quantifying the accident causality by clustering the accident severity from multidimensional perspectives. In this study, we endeavor to mitigate the aforementioned shortcomings by using a two-stage data-driven approach. First, Gaussian mixture clustering is proposed to cluster the accident severity at the aggregation level. Then, a BN is constructed to uncover the interplay among risk factors of accident severity and is further used for one- and two-dimensional inference analysis to maximize the potential of BN to influence policy. Finally, the accident data on mountainous freeways in Yunnan Province of China between 2016 and 2021 are used to calibrate and validate the proposed model.
3. Data
The mountainous freeway segment examined in this study constitutes a 105 km stretch of the Mazhao freeway located in Yunnan Province, China. This segment is an integral part of the G85 Yinchuan–Kunming national highway network, characterized by a design speed of 100 km/h, a roadbed width of 33.5 m, and a bridge-tunnel ratio of 50.79%. The analysis utilized a crash database provided by the Yunnan Provincial Department of Traffic Police. A comprehensive dataset comprising 796 accidents that occurred on this freeway between 2016 and 2021 was compiled for this study.
Based on the available data and the objectives of this study, the variables were categorized into four main groups: driver-related factors (e.g., fatigue, speed limit violations, lane-change violations, improper braking), environment-related factors (e.g., weather conditions, season, lighting, and day of the week), road-related characteristics (e.g., alignment, slope, road type, surface conditions, roadside barriers, and speed limits), and vehicle-related characteristics (e.g., traffic volume levels, vehicle types). The descriptive statistics of the key variables are presented in Table 1.
| Category | Variables | Value | Frequency | Percentage (%) |
|---|---|---|---|---|
| Driver-related | Fatigue | Yes | 73 | 9.22 |
| No | 719 | 90.78 | ||
| Speed limit violation | Yes | 35 | 4.42 | |
| No | 757 | 95.58 | ||
| Lane-change violation | Yes | 9 | 1.14 | |
| No | 720 | 90.91 | ||
| Misoperation | Yes | 451 | 56.94 | |
| No | 278 | 35.10 | ||
| Without maintaining a safe distance | Yes | 95 | 11.99 | |
| No | 634 | 80.05 | ||
| Environment-related | Weather | Clear | 288 | 36.36 |
| Foggy | 4 | 0.51 | ||
| Cloudy | 460 | 58.08 | ||
| Rain | 36 | 4.55 | ||
| Snow | 4 | 0.51 | ||
| Season | Spring | 161 | 20.33 | |
| Summer | 196 | 24.75 | ||
| Autumn | 178 | 22.47 | ||
| Winter | 257 | 32.45 | ||
| Light | Daylight | 589 | 74.37 | |
| Dark, dawn, or dusk | 203 | 25.63 | ||
| Day of week | Weekday | 570 | 71.97 | |
| Weekend | 222 | 28.03 | ||
| Road-related | Alignment | Straight | 503 | 63.51 |
| Curve | 130 | 16.41 | ||
| Flat, or upgrade | 41 | 5.18 | ||
| Downgrade | 118 | 14.90 | ||
| Road type | Ordinary road section | 348 | 43.94 | |
| Bridge | 149 | 18.81 | ||
| Tunnel | 245 | 30.93 | ||
| Ramp | 50 | 6.31 | ||
| Surface condition | Wet | 107 | 13.51 | |
| Dry | 667 | 84.22 | ||
| Snow cover | 13 | 1.64 | ||
| Speed limit | 80 km/h | 685 | 86.49 | |
| 100 km/h | 107 | 13.51 | ||
| Roadside barrier | Protective guard | 485 | 61.24 | |
| Anticollision wall | 224 | 28.28 | ||
| No defence | 10 | 1.26 | ||
| Vehicle-related | Traffic volume level | High (traffic flow ≥ 1000 veh/h) | 302 | 38.13 |
| Medium (500 ≤ traffic flow < 1000 veh/h) | 230 | 29.04 | ||
| Low (traffic flow < 500 veh/h) | 260 | 32.83 | ||
| Type of vehicle | Car | 528 | 66.67 | |
| Coach | 7 | 0.88 | ||
| Truck | 251 | 31.69 | ||
| Severity-related | Death | 0 person | 768 | 96.97 |
| 1 person | 20 | 2.53 | ||
| > 1 person | 4 | 0.51 | ||
| Disability injury | 0 person | 776 | 97.98 | |
| 1 person | 13 | 1.64 | ||
| > 1 person | 3 | 0.38 | ||
| Nondisability injury | 0 person | 695 | 87.75 | |
| 1 person | 62 | 7.83 | ||
| > 1 person | 35 | 4.42 | ||
| Property damage | Yes | 719 | 90.78 | |
| No | 73 | 9.22 | ||
| Traffic disruption | Yes | 76 | 9.60 | |
| No | 716 | 90.40 | ||
4. Methodology
This study endeavors to quantify the causal relationship of accident severity, thereby facilitating the prevention of traffic collisions on mountainous freeways. To thoroughly explore the factors contributing to accident severity, two crucial questions require examination. The first question is how to develop an objective and adaptive scenario classification framework for accident severity. In the majority of prior research, the accident severity level has been categorized using a predefined rule, which is typically based on the most severe injury sustained by an individual involved in the crash. Nevertheless, such an individual-level predefined approach may not effectively reveal the inherent nature of accidents and often struggles to adapt to diverse freeway scenarios. The second question is how to characterize dependency relationships among contributing factors and quantify their respective influences on the accident severity level. In previous studies, the relationship between contributing factors and accident severity was estimated under predefined functions. Unfortunately, these methods were inadequate in describing the dependencies or causal relationships among a set of variables.
To address these questions, a two-stage data-driven approach used in this study is briefly discussed in this section. First, the Gaussian mixture model (GMM) clustering-based method is developed to classify accident severity into different levels. Then, a BN model is constructed to examine the relationship between the risk factors and accident severity levels.
4.1. GMM-Based Severity-Level Clustering
In previous studies, accident severity was usually defined by using the KABCO scale at the individual level [7, 33, 38]. However, accident severity based on the worst injury experience by passengers or drivers involved in the accident may not fully demonstrate the nature of the accident. In this study, accident severity is determined from multidimensional perspectives including the injury level of all people involved in the accident. To be specific, accident severity is related not only to the degree of worst injury, but also to the number of people injured, property damage, and traffic disruption. Since the accident severity is multidimensional and there is no specific probability function available to represent the multimodal nature of the accident covering all types of situations, we need to use a mixture model to represent the accident severity level.
The significant advantage of GMM clustering method is to give the probability distribution of each cluster, which is useful for dealing with inaccurate or overlapping data points, such as some accidents may be between two serious categories. Different from GMM, K-means employs a hard assignment approach requiring explicit cluster allocation, rendering it suboptimal for datasets with overlapping clusters. This technique demonstrates notable limitations in its sensitivity to the initialization of cluster centers, often leading to convergence at local optima rather than global solutions. The GMM clustering addresses these constraints through a probabilistic framework utilizing the EM algorithm for iterative parameter optimization, exhibiting superior capability in modeling complex data distributions through its soft assignment mechanism. Hierarchical clustering, while effective for dendrogram-based analysis, suffers from inherent computational complexity that grows quadratically with dataset size, imposing significant scalability limitations for large-scale applications. Density-based approaches such as DBSCAN, though proficient in identifying arbitrary-shaped clusters, rely on predetermined density thresholds that may exhibit suboptimal performance when handling clusters with heterogeneous densities or non–density-based structures. Therefore, to classify the accident severity with a multimodal distribution, a GMM clustering-based method is proposed to learn the optimal classification.
The model parameters are updated iteratively according to equations (8)–(11). If the stop condition is satisfied, for example, reaching the maximum number of iteration rounds or the likelihood value (LL(D)) stopping growing, the cluster classification can be determined.
4.2. BN
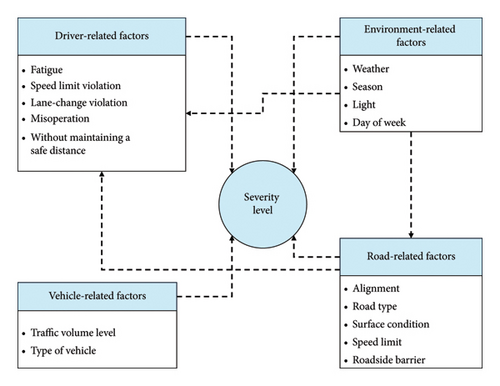
Then, the K2 algorithm [43] is employed to learn the optimal BN structure. With the given BN structure, parameter learning aims to search for the optimal parameters of the conditional probability distribution for each node. Considering that the EM algorithm [40] is capable of estimating parameters from datasets that contain missing values, the EM algorithm is employed in this study for BN parameter estimation.
5. Results
5.1. Clustering Validity Analysis
To evaluate the efficacy of the accident severity clustering in fitting the data, the prevailing approach involves utilizing internal cluster validity indices. Consequently, three representative indices—the Calinski–Harabasz (CH) index [44], the Silhouette coefficient (SC) [45], and the Davies–Bouldin (DB) index [46]—are employed to assess the performance of clustering methods. The CH index is computed based on the ratio of intracluster variance to intercluster variance, with a higher CH index value indicating superior clustering performance. The SC index, which spans from −1 to 1, encapsulates both the compactness of samples within clusters and the distinctness between clusters. A value closer to 1 signifies a more effective clustering outcome. The DB index is derived from the maximum mean value of the ratio of intracluster compactness to intercluster separation, with a smaller DB index value suggesting enhanced clustering efficacy. In summary, a greater degree of similarity among objects within clusters and a lesser degree of similarity between clusters denote improved clustering performance.
Table 2 presents the performance metrics of four clustering methods [47–49]. The GMM-based clustering approach exhibits the highest values for both the CH and SC indices, along with the lowest value for the DB index. These results indicate that the GMM-based method outperforms the other approaches across all evaluated indices. Consequently, the GMM-based clustering method is chosen for classifying the accident severity levels.
| Method | Index | ||
|---|---|---|---|
| CH | SC | DB | |
| k-means | 729 | 0.56 | 0.96 |
| Density-based spatial clustering | 803 | 0.68 | 1.05 |
| Hierarchical clustering | 751 | 0.45 | 0.98 |
| GMM-based clustering | 920 | 0.80 | 0.92 |
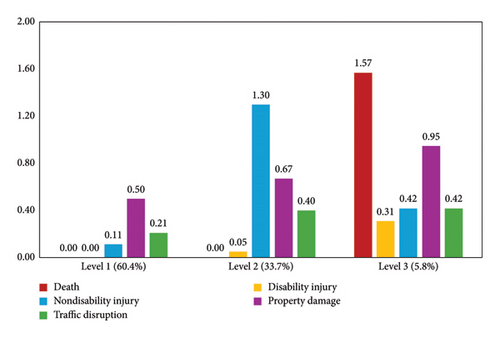
Figure 2 illustrates the centroids of the three accident severity levels classified by the GMM-based clustering approach. These levels account for 60.4%, 33.7%, and 5.8% of the cases, respectively. Level 1 is distinguished by accident cases involving no fatalities or disability injuries, representing the lowest severity level. Level 2 encompasses a relatively small number of fatal and disability injuries but the highest proportion of nondisability injuries, thus being categorized as the medium severity level. Level 3 is characterized by the highest incidence of fatalities, disability injuries, and property damage cases, indicating the most severe accidents. By contrasting the classification results with the KABCO scale at the individual level, we observed that the clustering outcome exhibits greater rationality at the aggregate level, and the cases within each level are more amenable to interpretation for modeling purposes. Consequently, BN inference is conducted using the clustering results derived from the GMM approach.
5.2. BN Structure Analysis
As illustrated in Figure 3, 12 discrete risk factors, meticulously selected from the domains of driver characteristics, environmental conditions, road attributes, and vehicle-related parameters, demonstrate significant associations with the probability of accident severity. The BN structure underwent rigorous validation via the Monte Carlo permutation test, confirming that all established links within the network exhibit statistical significance at a 95% confidence level.
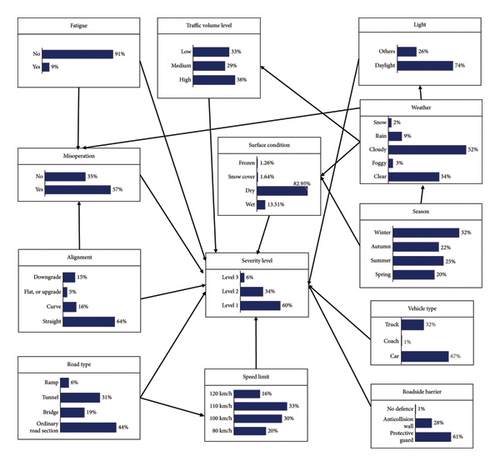
Specifically, Figure 3 highlights that driving fatigue, misoperation, light, traffic volume level, surface condition, alignment, road type, speed limit, roadside barrier, and vehicle type are directly linked to accident severity. Notably, while the BN structure does not depict a direct causal relationship between weather conditions and accident severity, this absence does not imply the lack of an underlying association. Instead, an indirect dependency emerges, mediated by three intermediate risk factors: misoperation, surface condition, and traffic volume. Similarly, although no direct connection between seasonality and accident severity is observed, an indirect relationship is evident through the sequential pathways linking season to weather conditions and season to road surface conditions.
Furthermore, the network reveals a direct association between fatigue driving and misoperation, suggesting that driver fatigue can precipitate abnormal driving behaviors. This finding represents a novel contribution to the literature, as previous studies relying on regression-based methodologies were inherently limited in their ability to uncover complex interdependencies among dependent variables, thereby overlooking this critical association.
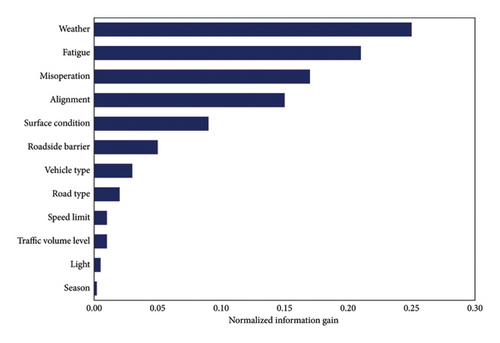
To identify the risk factors that mostly influence the accident severity level, IG is employed to measure the feature importance. The relative importance for 12 risk factors in the BN model is shown in Figure 4. It demonstrates that weather condition plays the most important role in accident severity, while the season has slight impact on the severity. Driving fatigue and misoperation occupy more than 38% relative importance to the BN model. It indicates that driver-related factors should be taken seriously for accident prevention.
5.3. BN Model Performance
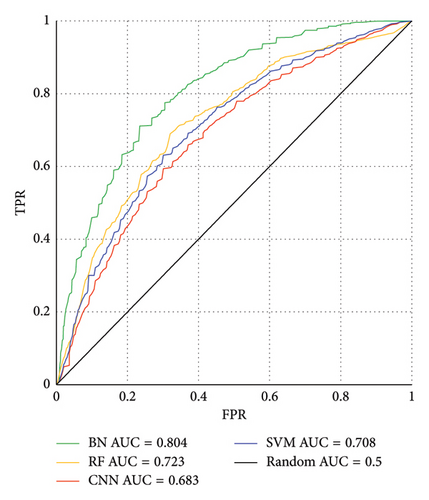
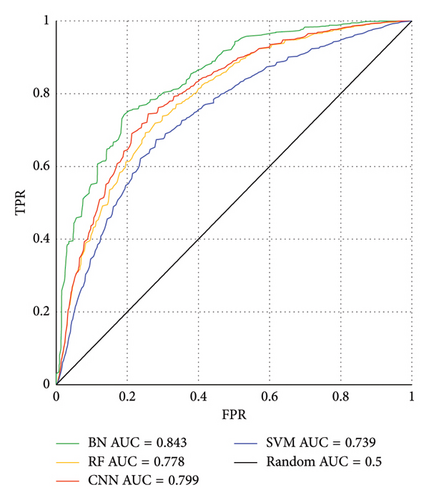
The BN model must be verified before implementation. The accuracy is usually selected as the evaluation metric to assess the performance of the model. However, it is problematic to assess the accuracy of the cases with unbalanced positive and negative samples. Alternatively, it is reasonable to assess the predictive performance by the area under the curve (AUC) [50]. The AUC, which represents the area under the receiver operating characteristic (ROC) curve, serves as a reliable metric for evaluating the classifier performance. The ROC curve is constructed by plotting the true positive rate (TPR) against the false positive rate (FPR) for all relevant categories.
To rigorously validate the reliability and predictive accuracy of our proposed BN model, we conducted comparative experiments against several state-of-the-art machine learning models, including random forest (RF), convolutional neural network (CNN), and support vector machine (SVM). As illustrated in Figure 5, ROC curves were plotted for each accident severity level. The experimental results demonstrate that the BN model outperforms its counterparts, achieving AUC values of 0.804, 0.843, and 0.822 for severity levels 1, 2, and 3, respectively. These AUC scores surpass those reported in prior research [6], thereby underscoring the superior performance of our BN model. Consequently, the BN model exhibits robust reliability in accurately predicting accident severity levels.

5.4. Inference Analysis for BN Model
An inference analysis is conducted to investigate the extent of the impact of each risk factor on accident severity level. The default value for each factor is set to median. The tested evidence is manually set to a specific state with 100% probability. Then, the posterior probability of accident severity level on this evidence is obtained. In the following sections, the unidimensional and two-dimensional inference analysis is reported for the top five most influential risk factors.
5.4.1. Unidimensional Inference Analysis
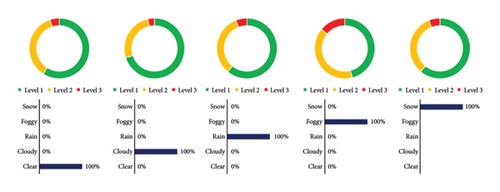
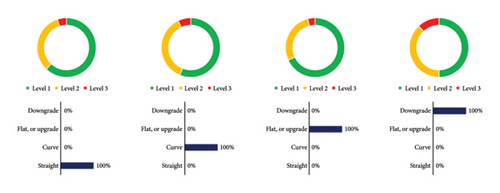
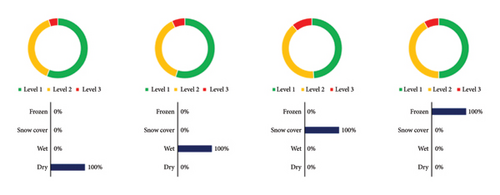
Figure 6 presents the results of a univariate inference analysis. With regard to the weather variable, adverse weather conditions, including fog and snow, exhibit a higher proportion of accidents classified as severity levels 2 and 3 compared to clear, cloudy, and rainy conditions. This finding suggests that accidents occurring under adverse weather conditions are associated with increased severity. However, our analysis reveals that the rain condition variable does not attain statistical significance. A plausible explanation for this observation is that drivers exhibit heightened caution on mountainous freeways during rainfall, potentially mitigating the severity of accidents.
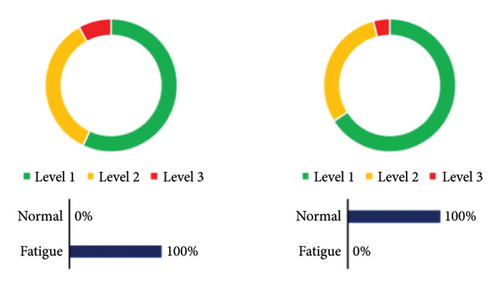
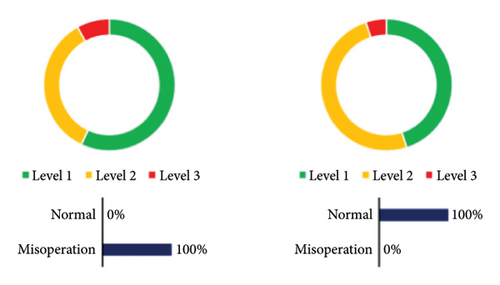
Regarding driver-related factors, our analysis indicates that the likelihood of more severe accidents (severity levels 2 and 3) is significantly elevated under conditions of fatigue driving. Empirical evidence pertaining to the variable “misoperation” reveals that if a driver engages in misoperations such as illegal lane changes, unsafe overtaking, or improper throttle control, the resulting accident is more prone to exhibit higher severity. Consequently, a comprehensive understanding of the impacts of fatigue driving and driver misoperations is pivotal for the development and design of effective countermeasures aimed at mitigating the risks associated with driver-related crashes.
Regarding road-related factors, the inference of road alignment suggests that the probability of more severe accidents is higher if the crash occurs on a curve and downgrade. For road surface conditions, the results suggest that snow cover and frozen conditions may cause more severe accidents. A possible reason is that the braking performance may degrade severely when the vehicle runs on the snow cover and frozen surface. However, the wet and dry surface conditions have a comparable impact on the severity level.
5.4.2. Two-Dimensional Inference Analysis
The advantages of using a two-dimensional Bayesian inferential analysis stem from its ability to model the joint distribution of two parameters, capturing their interdependencies and providing a comprehensive framework for uncertainty quantification. When analyzing two variables, Bayesian inferential analysis can easily handle multivariate relationships and interaction effects. It can estimate not only the main effects of each variable but also the interaction between them. This is important in accident-related risk factor analysis where the relationship between risk factors is often complex and nonadditive. Considering that the weather is changeable and the road conditions are complex in the studied freeway section, a two-dimensional inference analysis is conducted to reveal the association between the weather and other risk factors. Weather, as the risk factor with the most relative importance, is taken in combination with each of the remaining four risk factors with higher relative importance.
Figure 7(a) shows the accident severity distribution under the joint inference of weather and fatigue driving. The results suggest that fatigue driving increases the probability of Level 2 and Level 3, regardless of the weather conditions in the accident. The probability of Level 2 and Level 3 raises by up to more than 50% when the driver is in the fatigue driving state in the foggy weather condition. This demonstrates that policymakers should consider installing driver fatigue prevention devices (e.g., deceleration strips or warning signs) on mountainous freeways since those devices help reducing driver fatigue as well as injury severity [51].
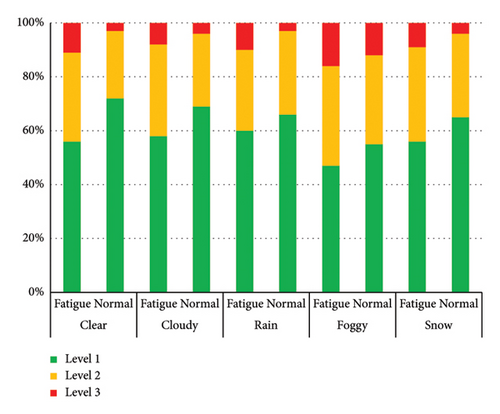
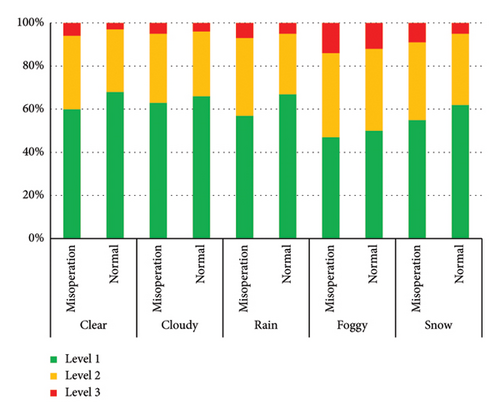
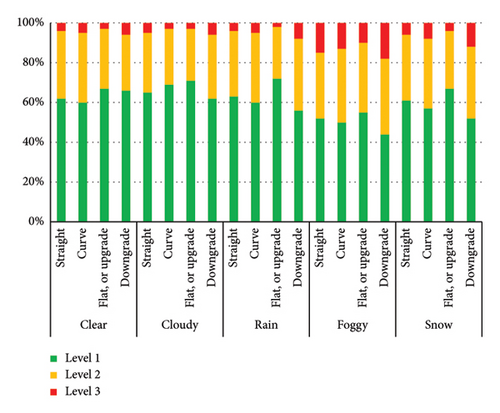
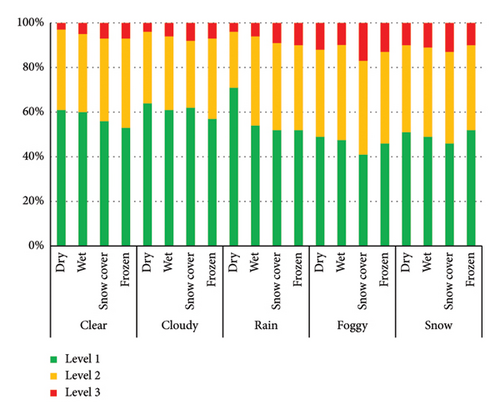
Figure 7(b) illustrates the simultaneous inference of weather and misoperation. The results suggest that when the driver makes a misoperation during a crash, regardless of the weather condition, the probability of higher severity (Level 2 and Level 3) is more than when a crash involves no misoperation. This demonstrates the necessity of the vehicle safety assistant driving devices including advanced cruise control system to ensure that a control system can take over the vehicle when the driver makes an operation error.
Figure 7(c) presents the impact of weather and alignment on the accident severity level. In foggy weather condition, the probability of higher severity (Level 2 and Level 3) is more than when an accident occurs in other weather conditions. By analyzing the inference results of the two risk factors on injury severity, it can be seen that severe injury are most likely to occur in foggy conditions of downgrade road sections.
The inference of weather and road surface condition on the severity of the accident is shown in Figure 7(d). The results suggest that when the road surface is snow covered and the weather is foggy, the probability of severe accident is the largest due to the poor visibility and braking performance. Therefore, it is necessary to close the snow-covered mountainous freeway sections in the foggy weather conditions.
6. Conclusions
- 1.
The GMM clustering method classifies accident severity into three distinct levels. Level 1 comprises accident cases with no fatalities or disabling injuries. Level 2 includes a small number of fatalities and disabling injuries, along with the highest proportion of nondisabling injuries. Level 3 is characterized by the highest number of fatalities, disabling injuries, and property damage cases. Compared to the KABCO scale classification at the individual level, our aggregation-level classification method demonstrates greater rationality and practical relevance.
- 2.
In this study, IG values were incorporated into the BN structure learning process to determine the relative importance of each variable on the decision variables. The results reveal that weather conditions exert the most significant influence on accident severity, whereas the season has a relatively minor impact. Other critical factors include driving fatigue, misoperation, road alignment, and surface conditions, which rank among the top five most influential variables.
- 3.
Unidimensional and two-dimensional Bayesian inferential analyses were conducted to explore the causal relationships between the top five risk factors and accident severity. The findings indicate that adverse weather conditions, such as fog and snow, are prevalent in most combined scenarios leading to severe accidents. Foggy conditions, in particular, are most strongly associated with fatal crashes. Driver-related factors, such as fatigue and misoperation, significantly increase the likelihood of severe outcomes. Additionally, road-related factors, including alignment and surface conditions, play a substantial role in determining severity levels. The analysis suggests that the synergistic interaction of foggy weather, fatigue driving, misoperation, downhill gradients, and snow-covered surfaces significantly elevates the risk of severe accidents.
This study has several limitations that warrant discussion. First, the effective performance of BN relies heavily on the availability of large datasets. However, since traffic accidents are inherently low-probability events, the limited amount of data poses a significant challenge to the accuracy and reliability of this research. Second, the influence of weather on accidents is primarily determined by the overall weather conditions on the day of the incident rather than the immediate weather conditions preceding the accident. This factor may obscure the true impact of weather on accident occurrence. Third, in the construction of the BN, the same network structure was applied across all time slices, which may fail to capture the potential variations in variable relationships under different temporal conditions.
For future research directions, the traffic conflict index could serve as a valuable risk assessment metric to proactively identify potential traffic safety hazards. Additionally, further investigation into the effects of weather on traffic conflicts should consider the persistence and intensity of adverse weather conditions, as these factors are likely to play a critical role in influencing traffic dynamics.
Disclosure
Broadvision Engineering Consultants Co., Ltd., had no role in manuscript preparation or decision to publish.
Conflicts of Interest
The authors Lingzhi Kong, Changan Xiong, and Wenchen Yang are affiliated with Broadvision Engineering Consultants Co., Ltd., which provided partial funding for this study through a general research grant. However, the grant was awarded through an open competition with no stipulations on research outcomes. The remaining author declares no conflicts of interest.
Author Contributions
Lingzhi Kong: conceptualization, methodology, and writing the original draft; Changan Xiong: data curation and analysis; Wenchen Yang: supervision and editing; Weiliang Zeng: conceptualization, methodology, writing the original draft, and reviewing. All data were analyzed independently by the authors.
Funding
This work was supported by the Science and Technology Program of the Department of Transportation, Yunnan Province (No. 2022-107, 2019303), the Science and Technology Research Project of YCIC, China (No. YCIC-YF-2022-06), the National Natural Science Foundation of China (No. 62273102), the Guangdong Basic and Applied Basic Research Foundation (No. 2024A1515010629), and the Open Funding of Guangdong Provincial Key Laboratory of Intelligent Transportation System (No. 202005003).
Open Research
Data Availability Statement
The data that support the findings of this study are available from the corresponding author, Weiliang Zeng, upon reasonable request. The data are not publicly available due to privacy.


