Riding Through the Pandemic: Unveiling Motorcycle Crash Trends Amidst Three Years of the COVID-19 Crisis
Abstract
Bangladesh has a significant prevalence of motorcycle usage accompanied by a correspondingly high incidence of motorcycle-related fatalities. The COVID-19 crisis has brought additional challenges to road safety in Bangladesh because of containment strategies and restrictions. The impacts of the pandemic on motorcycle-related road traffic crashes, injuries, and fatalities in Bangladesh are investigated in this study using ARIMA time series analysis. Data spanning 86 months (January 2016 to February 2023) were collected from the Accident Research Institute (ARI), which compiles newspaper-based data serving as an alternative source of information on crashes encompassing both pre-COVID (January 2016 to February 2020) and COVID-19 periods (March 2020 to February 2023). Three COVID-19 waves were demonstrated, with the first wave showing a significant decrease in crashes, injuries, and fatalities due to a government-imposed lockdown. During the second wave, crashes and fatalities approached predicted values, while injuries remained lower than anticipated. The third wave witnessed a sudden drop, followed by a sharp rise in all three variables. Box and whisker plot analysis confirmed the disparities between observed and predicted values, with observed data being lower. These results demonstrate the significant impact that COVID-19 containment strategies have had on trends in motorcycle crashes. By understanding these patterns, policymakers and road safety authorities can develop adaptive interventions to mitigate motorcycle-related incidents during pandemics or similar crises. The study provides a data-driven foundation for designing context-specific policies, adjusting law enforcement strategies, and efficiently allocating resources to enhance road safety under varying conditions.
1. Introduction
Motorcycles have emerged as a vital mode of transportation in Asian nations, accounting for nearly 80 percent of the world’s motorcycles [1]. Affordability, simplicity of use, and excellent maneuverability are important aspects behind its enormous appeal [2]. However, this popularity comes with a significant drawback: Asia has experienced the highest fatality rate, responsible for 78% of global motorcycle-related fatalities due to the lack of rider protection, high speed, gender, age, type of roads, failure to detect motorcyclists on the road, etc. [1, 3]. Despite the perceived risk and collision severity, motorcycles have always been popular in low- and middle-income nations as they offer low purchase costs and excellent fuel efficiency [4].
Bangladesh, like other Asian nations, shares the exact motorcycle prevalence and associated challenges. Recent statistics from 2022 reveal that motorcycles constitute over 70% of the total registered vehicles in the country, totaling 4.0 million, making it the most prevalent mode of transportation, with cars accounting for less than 0.4 million [5]. Unfortunately, Bangladesh also experiences a significantly higher death rate. The reported death rate in Bangladesh is around four times higher than the global and Asian average of motorcycle-associated deaths [1]. Moreover, between 1999 and 2014, Bangladesh witnessed a notable upward trend in motorcycle crash fatalities, increasing from 3% to 22% [6]. These statistics underscore the urgent need to address motorcycle safety in Bangladesh and implement effective measures to reduce the risk of accidents and fatalities.
With the emergence of the COVID-19 pandemic, these existing motorcycle safety challenges have been further complicated, as the transportation patterns and road safety dynamics have been altered by the impact of the pandemic. In order to tackle the devastating outcome of the coronavirus, which caused more than 6.5 million deaths all around the world, many countries have opted for containment strategies to combat the transmission rate in the form of lockdowns, travel bans, distant socializing, closures of educational institution, and requests to stay at home [7, 8]. The first detection of a coronavirus-affected case in Bangladesh occurred on March 8, 2020. Recognizing the country’s inadequate infrastructure and limited capacity to tackle the virus, the government of Bangladesh took decisive actions, including the shutdown of every academic institution (schools, colleges, universities, and so on) starting on March 19, 2020, followed by a 66-day nationwide lockdown between March 26, 2020, and May 30, 2020 [9]. Over the past three years since the emergence of the pandemic, Bangladesh has experienced three distinct waves of COVID-19 infections. These waves occurred from March 2020 to May 2020, March 2021 to May 2021, and May 2021 to August 2021 [10]. During these waves, the government introduced various protective measures and containment strategies to curb community transmission. During these restrictive measures, public transportation was also significantly limited to reduce the risk of virus transmission among commuters. As a result, many individuals turned to alternative means of transportation, which offered a lower infection risk than crowded public transportation systems such as motorcycles. Hence, understanding the impact of the global health crisis on motorcycle-related road traffic incidents in Bangladesh is crucial, as evidenced by the shift in the choice of transportation mode.
During the COVID-19 pandemic, the Bangladeshi government implemented key measures such as health screenings at airports, suspending on-arrival visas, quarantine protocols for returning citizens, and enforcing travel restrictions [10]. The educational institutions were closed for over a year, with a shift to online learning that left many rural students struggling with access. The government also rolled out a mass vaccination campaign. Local and international NGOs played a vital role by raising funds, increasing awareness, and providing essential support to vulnerable households, though their efforts were largely independent of a coordinated national response [11]. Despite these efforts, Bangladesh’s COVID-19 response was criticized for being delayed and inconsistent. Poor coordination between government agencies, ineffective risk communication, and logistical issues further hindered the response [12]. Although diagnostic and case management services improved over time, the overall handling of the pandemic exposed significant gaps in the country’s health system and governance.
The imposition of these restrictions during the pandemic generated a heightened awareness among the population. Consequently, people began seeking alternative modes of transportation that would enable them to maintain physical distancing from large groups while being more affordable than private cars. This shift in perspective has further underscored the importance of relying on motorcycles as an alternative means of transport, as they carry a lower risk of infection than private cars or public transportation [13, 14]. It has become evident that the coronavirus outbreak in Bangladesh has caused a rise in the number of people traveling by motorcycle and an interest in buying motorcycles. A survey among 300 individuals, including service members, educators, and individuals from various income groups, revealed that approximately 79% of respondents considered motorcycles suitable and safe for commuting during the pandemic [15, 16]. In addition, a survey conducted in Dhaka, Bangladesh, found that after the withdrawal of the lockdown, around 46% of respondents anticipated an increase in motorcycle travel, with approximately 31% expressing intentions to purchase a motorcycle [17]. The Bangladesh Road Transport Authority (BRTA) data confirm the registration of approximately 1.2 million new motorcycles between 2020 and 2022, providing concrete evidence of the population’s growing preference for motorcycles as an alternative mode of transportation at the time of the pandemic [5]. While motorcycles became a popular alternative due to limited public transport, the rise in usage led to an increase in crashes, with motorbike-related collisions jumping from 19% in 2019 to 27% in 2020. This trend highlights both the growing reliance on motorcycles and the associated safety risks during the pandemic [18].
The surge in motorcycle traffic on the streets during the coronavirus crisis has raised concerns regarding the increased likelihood of severe motorcycle-involved crash occurrences, presenting a new challenge to address [19]. To comprehensively understand the deviation in crash statistics at the time of the coronavirus pandemic compared to the prepandemic trends, we utilized autoregressive integrated moving average (ARIMA) time series analysis. This allowed us to make predictions based on historical data and determine the trend of motorcycle crashes, injuries, and fatalities during the 3 years of the pandemic. We then compared these predicted values with the observed data to assess and quantify the impact of the pandemic. This study represents the first attempt, to the best of our knowledge, to model the pattern of motorcycle crashes, injuries, and fatalities during the pandemic in Bangladesh. By doing so, we aimed to provide valuable insights into the impact of the pandemic outbreak on road safety concerning motorcycles, contributing to the existing literature and enhancing our understanding of the challenges faced in ensuring motorcycle safety during unprecedented times.
Road safety research plays a crucial role in reducing traffic crashes and hazards. Furthermore, accurate and comprehensive crash data are essential for effective road safety planning and policymaking. However, in specific contexts, such as Bangladesh, accessing official accident data or publicly available sources can be challenging, limiting the ability to conduct in-depth analyses. This research aims to address this data availability gap by exploring an alternative source of information: newspaper-based data. The absence of a centralized accident reporting system and limited data sharing between relevant authorities pose challenges for researchers and policymakers. In light of these challenges, newspaper archives can serve as a valuable source of information on accidents, providing insights into the frequency, patterns, and trends of road crashes.
The subsequent sections are structured in the following manner: Section 2 provides a concise overview of the relevant literature and focuses on prior research that studied road traffic safety under the impact of the COVID-19 crisis. In this section, we also underlined the factor behind utilizing newspaper-based data based on the evidence from previous research. Moving on to Section 3, the methodology employed in this research is described, encompassing the theory of time series modeling and forecasting. This section includes a comprehensive study area description, details on the data source, and the data collection method. Section 4 delves into the model development specifics and presents the results. Building on the results obtained, Section 5 thoroughly discusses the trends of motorcycle-related crashes, injuries, and fatalities. In addition, this part offers insights into the fundamental causes of the noted patterns. An overview of the research findings, suggested recommendations and study limitations are provided in the conclusion (Section 6) section.
2. Literature Review
Researchers have shown a keen interest in examining the impact of travel bans and restrictions implemented to combat the global pandemic on traffic safety parameters. These containment strategies have undeniably reduced viral transmission and prevented potential deaths. However, they have also led to various shifts and changes in on-road safety dynamics. In this literature review section, we present noteworthy findings to shed light on the evolving patterns and changes observed in traffic safety due to these drastic measures.
2.1. Impact of Mobility Restrictions on Road Safety During Pandemic
Research studies have highlighted the significant impact of mobility restrictions on reducing the rate of crashes and injuries during the COVID-19 pandemic. For instance, a 30% reduction in traffic volume in Qatar resulted in a remarkable 37% decrease in crash frequency [20]. Similarly, in Spain, Saladié et al. found that a 12-week containment order led to a 34% reduction in overall crashes compared to the average of 2018–2019 [21]. Another study conducted in Greece observed a substantial decline in crashes, with a 62% reduction, along with a 68% decrease in fatalities and a 48% drop in serious injuries during the pandemic [22]. In a comprehensive study conducted by Gupta et al., several countries, including the United States of America, Australia, Brazil, Russia, Denmark, Finland, France, Germany, Greece, Hungary, Italy, Japan, Poland, Spain, and Sweden, were examined to assess the impact of strict lockdown policies and reduced mobility on road fatalities during the COVID-19 pandemic [23]. According to this study, fewer travels for shopping and leisure activities have resulted in a notable decline in road fatalities across all nations. These findings highlighted that implementing rigorous measures of lockdown and limiting mobility have proven to be effective strategies in promoting road safety by minimizing vehicular traffic and associated risks.
Despite the results of the studies mentioned earlier, some researchers have observed only slight alterations in crash rates amidst the COVID-19 pandemic. Studies carried out in Nepal showed that the predicted decrease in road traffic accidents, injuries, and fatalities was not as substantial as expected at the time of the pandemic [24]. Similarly, despite a decrease in the overall crash rate, the number of fatalities from traffic crashes in Northern Ireland remained unchanged compared to prepandemic levels [25]. In Missouri State, minor injury crashes experienced reductions, whereas fatal crash patterns did not change [26]. In addition, there has been an escalation in the number of fatalities observed in various regions worldwide [27]. According to research conducted in Alabama, although there was a significant decrease in traffic flow and distance covered by vehicles, an unfortunate surge in crashes, injuries (major), and fatalities was reported [28]. Higher fatality rates were also reported in Queensland, Australia, during the pandemic [29]. According to most of the literature, the leading cause of the poor road safety situation is attributed to dangerous driving habits, such as driving under the influence of alcohol and exceeding the speed limit [27, 30, 31].
Incorporating the detailed statistics into the comparative analysis between the Global North and Global South, we observe a diverse impact of the pandemic on road traffic collisions/crashes (RTCs) [32]. The significant reduction in RTCs in Spain (67%), France (74%), and Germany (23%) reflects the effectiveness of lockdown measures in the Global North, where advanced transport systems and strict adherence to restrictions contributed to a pronounced decrease in traffic volumes. Conversely, in the Global South, countries like Nepal (48%) and UAE (84%) also saw significant reductions, yet the variations within and between these regions underline the influence of local transport systems, behaviors, and enforcement of lockdown measures. This disparity emphasizes the critical need for tailored road safety strategies that consider regional transport characteristics and pandemic response effectiveness.
2.2. Motorcycle-Involved Crashes During COVID-19
During the COVID-19 pandemic, motorcycle-related crashes increased significantly in various regions, including Türkiye and the Middle East. In Türkiye (2024), a study revealed a notable rise in motorcycle accidents, particularly among motor couriers, during quarantine periods, with an increase in injuries among motorcyclists who relied on two wheelers for essential services [33]. In Qatar, another study found that the surge in demand for motorcycle delivery drivers during the pandemic led to a 66.3% increase in motorcycle-related crashes, primarily among young, work-related riders, compared to the prepandemic period [34]. In Kentucky, a separate investigation compared pre- and postpandemic motorcycle crashes along urban roadways, finding that factors like higher traffic volumes and sharp horizontal curves contributed to increased crash frequencies in both periods [35]. In Taiwan, motorcycle crashes increased from 47,108 in 2019 to 51,441 in 2020, with a rise in injuries and fatalities, particularly among food delivery riders [36]. Interestingly, in Florida while motorcycle crashes decreased during the pandemic, fatality rates rose [37]. These findings emphasize the increased vulnerability of motorcyclists during the pandemic due to heightened demand for delivery services and reduced public transport.
2.3. Challenges in Data Availability for Developing Countries and Alternative Data Sources
The adoption of mobile sensors and publicly available data from companies such as Google, Facebook, and Cuebiq has revolutionized the evaluation of transportation systems and mobility changes in real time, allowing for detailed assessments of the impact of COVID-19 on human mobility and traffic safety [38]. This approach, alongside a systematic literature review on big data applications during the pandemic, underscores the critical role of technological advancements in understanding and mitigating transport safety impacts. However, it also highlights the need for further research, especially in developing countries where traditional data sources may not fully capture the extent of road traffic injuries and fatalities [39].
The limited data availability in developing countries poses a significant challenge to comprehensive road safety analysis. This review highlights innovative approaches taken by researchers to overcome data gaps, such as the utilization of newspaper reports and social media content to infer traffic accident trends and causes. Yet, the scarcity of systematic and reliable data remains a critical barrier to understanding the full impact of the pandemic on road safety in these regions. The lack of evidence underscores the urgent need for investment in robust data collection and analysis systems that can provide actionable insights for policymakers and road safety practitioners.
The impact of restrictive measures implemented to combat the transmission of the coronavirus has demonstrated both positive and negative consequences for road safety. Hence, understanding these impacts and their relationship with road crash patterns is essential. However, limited data availability in Bangladesh poses a significant challenge to road safety analysis. In response, researchers are turning to alternative sources, such as newspapers, to bridge the gap caused by data unavailability [40, 41]. For example, the research by Ahmed et al. utilized newspaper-based data to examine the causes and trends of fatal vehicle crashes involving truck in Bangladesh [40]. This approach is common in other countries as well [42–44]. Interestingly, many studies have employed time series analysis to analyze newspaper data. Jünger and Gärtner used time series analysis to examine the trend of media coverage and reporting on terrorism, while Daw et al. conducted a monthly time series analysis to quantify changes in newspaper coverage of drug financing over time [45, 46].
Motorcycles play a crucial mode of transportation in low-income developing countries, including Bangladesh. However, they are also associated with high levels of risk [47]. Hence, this study holds immense significance in guiding policymakers on how to handle future waves or related situations, intending to reduce the occurrences of crashes and deaths. By understanding the factors and patterns related to motorcycle crashes, appropriate measures can be implemented to enhance road safety and mitigate the risks associated with motorcycle transportation.
3. Methodology
3.1. Study Area
The study was conducted in Bangladesh, a South Asian nation of more than 165 million people [48]. Geographically, Bangladesh is surrounded by Myanmar and India and is located in the fertile Bengal Delta. The study area encompasses all the urban, suburban, and rural regions across the country.
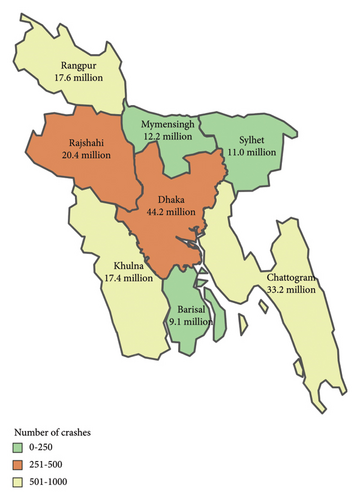
The study area, as depicted in the accompanying map (Figure 1), covers the entire nation of Bangladesh, divided into eight major administrative divisions: Dhaka, Chattogram, Khulna, Barishal, Rajshahi, Sylhet, Rangpur, and Mymensingh. These regions encompass a range of urban, suburban, and rural environments, providing a comprehensive framework for assessing motorcycle-related road traffic accidents. The map highlights the geographical distribution of these divisions, categorizing motorcycle crashes from March 2020 to February 2023. Dhaka and Rajshahi exhibit the highest crash rates, while Sylhet, Barisal, and Rangpur report fewer incidents. In addition, population figures for each division are noted, helping contextualize crash data within the broader regional demographics, thus facilitating a clearer understanding of the study’s findings.
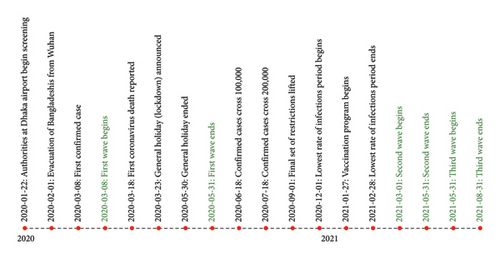
The plot (Figure 2) visualized significant COVID-19 events in Bangladesh from the start of 2020 through 2021, highlighting key moments in the pandemic’s progression. It began with authorities at Dhaka airport beginning screening in January 2020, followed by the evacuation of Bangladeshis from Wuhan in February. The timeline marked the first confirmed COVID-19 case on March 8, 2020, signifying the beginning of the pandemic in the country. This event coincided with the start of the first wave, which lasted until May 31, 2020. The plot also illustrated the implementation and conclusion of a general holiday (lockdown) to curb the virus spread. It continued to track the pandemic through the second and third waves, marked by their start and end dates in 2021, alongside other pivotal moments such as the crossing of 100,000 and 200,000 confirmed cases and the start of the vaccination program in January 2021. The timeline ended with the third wave concluding in August 2021, providing a succinct overview of the pandemic’s key phases in Bangladesh within the given timeframe.
3.2. Data Source
The data used in this study were obtained from the Accident Research Institute (ARI), an organization supervised by the Bangladesh University of Engineering and Technology (BUET). ARI is the most authentic and reliable source of crash data, which has been manually collecting newspaper-based data since January 2016 as a response to the challenges associated with accessing official accident data in Bangladesh. The researchers and data collectors working in ARI first identify the newspapers relevant to RTCs. This includes reliable national newspapers that regularly cover all types of traffic crashes nationwide and have a wide readership. Once relevant articles are identified, data collectors extract key crash-related information. This includes details such as the date of the accident, location (e.g., district, division, road name, and hospital name), type of transport mode (e.g., road traffic, railway, and waterway), type of accident (e.g., head on, rear end, fall from the vehicle, and lost control), vehicles involved, number of injuries or fatalities, and any additional relevant information reported in the article. The extracted information is then recorded in a standardized format. Researchers can analyze the accident data using various statistical techniques once the accident data are compiled. We only extracted the reports from the whole dataset that involved at least one motorcycle, focusing our analysis on motorcycle-related crashes. This approach allowed us to narrow down the dataset and focus on the specific context of motorcycle crashes. The final dataset comprised monthly estimates of total motorcycle RTCs, injuries, and fatalities, which were treated as the dependent variables in our analysis.
The study period for this research encompassed 86 months, from January 2016 to February 2023. This timeframe aligns closely with the period of significant motorcycle registration, as the BRTA reported, with approximately 2.6 million new motorcycles registered between 2016 and 2022 (BRTA, 2023). The inclusion of this specific timeframe allows us to capture the consequences of the substantial growth in motorcycle numbers and their impact on road safety before and during the pandemic.
Included in the supplementary materials is a table of pseudo data (see Appendix Table A1), which emulates the structure of our comprehensive accident dataset. This pseudo dataset includes a variety of fields such as the date of the accident, time of day, district, Thana (subdistrict), accident location, road name, name of the hospital, numbers killed and injured, age of those killed, accident type, and vehicles involved. Each record in the pseudo dataset is formatted to closely resemble the actual data collected, albeit with anonymized and nonspecific data to maintain confidentiality and privacy. The format of this table allows readers to appreciate the breadth and depth of the data collected for this study without revealing sensitive information.
3.3. Statistical Analysis
The specific method that studies the collected data points over a period is called a time series analysis. Since variables may be analyzed to illustrate how they vary over time, time series data differ from other data types in this way. It forecasts data for the future based on past data and ensures that any trends or patterns are not outliers and can consider seasonal variation. One popular time series analysis method is ARIMA. The efficiency and theoretical foundation of ARIMA have made it a popular choice in transportation research, i.e., forecasting and modeling of vehicle emissions [49], air transportation research [50, 51], traffic congestion [52], traffic flow [53], traffic volume [54], and RTCs [55, 56]. In addition, ARIMA has been effectively employed in analyzing intervention-impacted crash patterns [57–60].
Despite the widespread application of the ARIMA model in studying traffic collisions, there is a need for more literature that specifically focuses on utilizing ARIMA to analyze motorcycle crash patterns and trends [61, 62]. The influence of the coronavirus pandemic on the frequency and severity of motorcycle accidents has received very little attention. This study will add to the expanding knowledge based on the diverse impacts of the coronavirus pandemic on worldwide transportation.
For the analysis purpose, we have utilized R statistical software tools. This statistical research aims to determine the time series trend for motorcycle crashes’ frequency, injury, and fatality and compare the situation before and during the pandemic. The 86 months (January 2016 to February 2022) of data were split into two sets: the first 50 months (prepandemic: January 2016 to February 2020) were used for model fitting, and the last 36 months (during the pandemic/intervention period: March 2020 to February 2023) were used for prediction. The projected and actual values were compared to comprehend how the pandemic affected the statistics on motorcycle crashes.
3.4. Development of Time Series Model
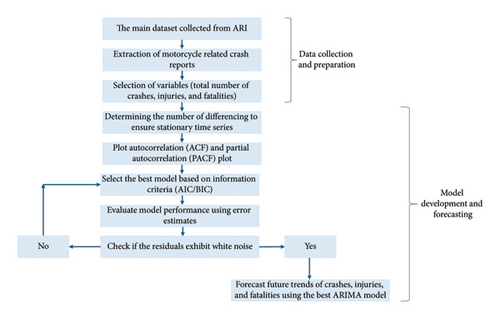
This flowchart (Figure 3) summarizes the ARIMA model development process for motorcycle crash data. Starting with data collection and extraction of relevant variables, it proceeds through steps such as plotting trends, ensuring stationarity, and selecting model parameters using ACF/PACF and AIC/BIC. The model is finalized once residuals are confirmed as white noise. Detailed steps are discussed in the following.
ARIMA modeling is a powerful tool for assessing the impact of interruption since it accounts for underlying trends, autocorrelation, and seasonality, as well as allowing for dynamic modeling of numerous impacts [26, 63].
For the purpose of forecasting future trends, in 1976, Box and Jenkin proposed the ARIMA model [64]. This model comprises three parameters denoted by the letters p for the autoregressive term, d for the degree of integration or differencing, and q for the moving average term.
In the time series analysis, the value at time t, represented by yt , is determined by a combination of factors. These factors include a constant term (δ), autoregressive coefficients (φi) that capture the relationship between current and past values, moving average coefficients (θj) that account for the influence of past residuals, and uncorrelated residuals (et) that represent the unexplained variability.
When dealing with time series data that exhibit seasonal patterns, such as recurring fluctuations over specific time intervals, a seasonal ARIMA (SARIMA) model can be employed. This model extends the ARIMA (p, d, and q) framework by incorporating seasonal fluctuations denoted as (P, D, and Q). Here, P represents the order of the seasonal autoregressive (SAR) term, D represents the degree of seasonal differencing or integration, and Q represents the order of the seasonal moving average (SMA) term.
- a.
Understanding Trends by Plotting Data
-
Before proceeding to model fitting, we plotted and decomposed the time series to identify the underlying patterns, such as pre-existing trends, seasonal impacts, and extreme or outlier values.
- b.
Model Selection
-
We chose to estimate the model parameters with the aid of the autocorrelation function (ACF) and partial ACF (PACF) plots, although several statistical tools offer an automated way of identifying potential model parameters.
- c.
Determining Differencing, AR, and MA Orders
-
The stationarity of the data and the appropriate number of differencing needed were assessed using diagnostic tools such as the ACF and PACF plots. In addition, unit-root tests such as the Dickey–Fuller (ADF) test and Kwiatkowski–Phillips–Schmidt–Shin (KPSS) test were employed. To deal with the seasonality, a seasonal difference (D) can also be incorporated into the model if required. The d and D parameters in the model can be prespecified by some automated methods as well.
- d.
Model Estimation and Use Information Criteria
-
This step is likely to influence the optimal model. To begin with, the estimation of some potential models using the p, d, q, P, D, and Q variables was conducted. Then, the Akaike information criterion (AIC) and the Bayesian information criterion (BIC) have both been used to determine the best model.
- e.
Diagnostics
-
In this stage, we employed residual plots to confirm that there was no autocorrelation in the residuals. The Ljung–Box test for white noise has also been used, as it specifically checks for the existence of autocorrelation [65]. When autocorrelation is present, a model is unsuitable and can be rectified by selecting a different order for AR and/or MA. It is also essential to consider the possibility that there is not one “best” model.
- f.
Model Errors
-
In this study, mean error (ME), root mean squared error (RMSE), mean absolute error (MAE), and mean absolute squared error (MASE) were used as error matrices.
- g.
Forecasting
-
With the obtained best models, we forecasted the trends of crashes, injuries, and fatalities at the time of the pandemic.
4. Results
4.1. Preliminary Analysis
Over the course of the 86-month observation, which spanned between January 2016 and February 2023, a total of 5771 motorcycle-associated RTCs, 3373 injuries, and 6649 fatalities were reported. The following is the summary of descriptive analysis (Table 1) for the total number of motorcycle-associated crashes, injuries, and fatalities before and at the time of the pandemic. It is important to note that during the pandemic, the minimum value for RTCs, injury, and fatality was not zero, indicating that crashes, injuries, and fatalities occurred every month. In addition, in all cases, the minimum, median, mean, and maximum values were higher during the pandemic than they were before in the pre-COVID phase.
| Crash | Injury | Fatality | ||||
|---|---|---|---|---|---|---|
| Prepandemic | Through pandemic | Prepandemic | Through pandemic | Prepandemic | Through pandemic | |
| Minimum | 8 | 37 | 0 | 11 | 11 | 40 |
| 1st quartile | 39 | 71 | 19 | 29.75 | 46.25 | 78.75 |
| Median | 58.5 | 87.5 | 37 | 41.5 | 69.5 | 105 |
| Mean | 60.32 | 88.67 | 39.04 | 45.42 | 68.58 | 103.22 |
| 3rd quartile | 79.75 | 107.25 | 54.75 | 53 | 88.75 | 123.25 |
| Maximum | 127 | 137 | 107 | 126 | 140 | 161 |
| Standard deviation | 28.96 | 24.04 | 23.96 | 25.36 | 31.49 | 29.27 |
4.2. Exploratory Analysis
Figure 4 displays the basic time series plots of RTCs, injury, and fatality, distinguishing between the pre-COVID and through-COVID timeframes. None of the plots exhibited prominent upward or downward patterns, making it challenging to discern a clear trend. Consequently, we employed the time series decomposition technique to gain further insights.
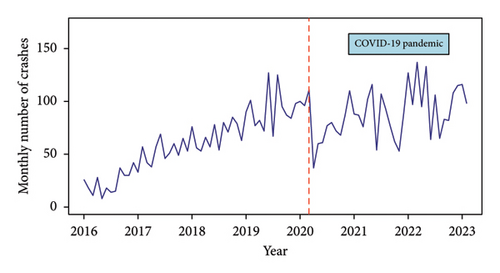
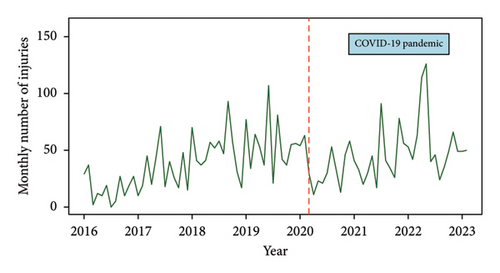
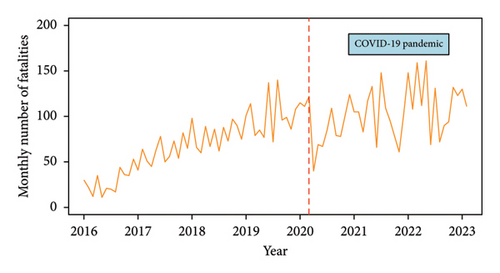
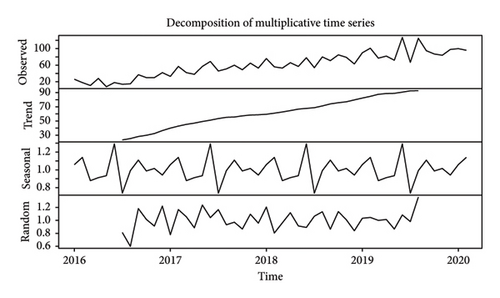
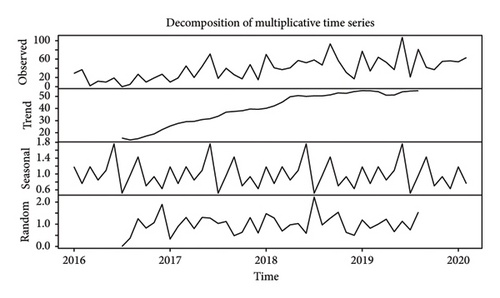
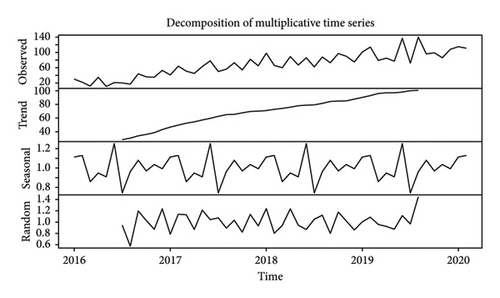
Figure 5 presents the decomposed plots for RTCs, injury, and fatality. The decomposition plot separates the time series into three key components: trend, seasonality, and random. We identified an exponential growth trend based on the observed time series, indicating a multiplicative time series. In addition, from the seasonal components of the decomposed plots, we observed seasonal trends recurring at a frequency of 12 months.
4.3. Stationarity Test
To ensure the suitability of the data for ARIMA modeling, it was required to confirm that the time series is stationary. To achieve this, we conducted two tests which are the ADF and KPSS tests. The ADF test indicates stationarity when the p value was less than 0.05, while the KPSS test indicates stationarity when the p value was greater than 0.10. The initial analysis revealed that all three series (RTCs, injury, and fatality) were nonstationary according to both the ADF and KPSS tests (Table 2). Therefore, first-order differencing was applied to all three series to achieve stationary time series. Subsequently, conflicting outcomes were observed in the ADF and KPSS test results. While the KPSS test indicated stationarity after first-degree differencing (p value > 0.01), the ADF test suggested nonstationarity (p value > 0.05), suggesting the need for second-order differencing.
| Time series | ADF test | Before differencing | ADF test | After first-order differencing | ||||
|---|---|---|---|---|---|---|---|---|
| Comment | KPSS test | Comment | Comment | KPSS test | Comment | |||
| Crash | 0.0959 | Nonstationary | < 0.01 | Nonstationary | 0.5457 | Nonstationary | > 0.10 | Stationary |
| Injury | 0.8459 | Nonstationary | < 0.01 | Nonstationary | 0.06316 | Nonstationary | > 0.10 | Stationary |
| Fatality | 0.1771 | Nonstationary | < 0.01 | Nonstationary | 0.2999 | Nonstationary | > 0.10 | Stationary |
4.4. Fitting Time Series Models
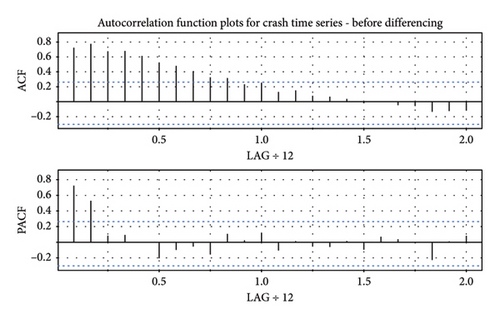
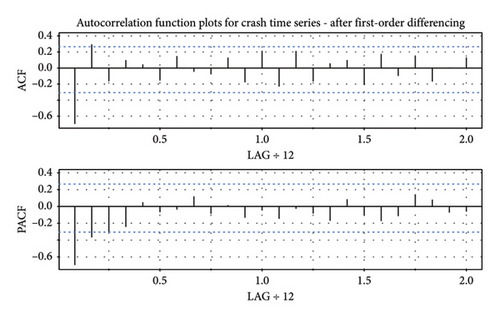
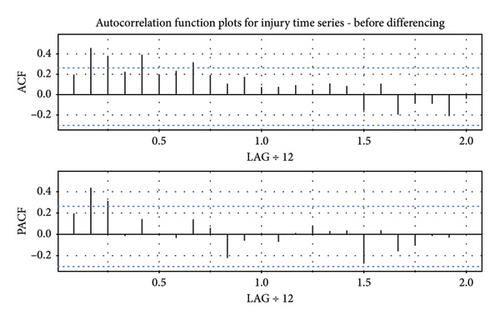
Figures 6, 7, and 8 depict the ACF and PACF plots. These plots are constructed for the RTC, injury, and fatality time series before and after applying first-order differencing. These plots were utilized to determine the appropriate degree of differencing needed to achieve stationarity in all of the three time series, as ADF and KPSS test results were contradictory. ACF and PACF plots serve as visual indicators of stationarity in the data. Stationarity is confirmed when the ACF plot exhibits a gradual decrease within the confidence interval, and the PACF plot displays a sharp cutoff. As illustrated in Figures 4, 5, and 6, after applying first-order differencing, the RTC, injury, and fatality time series exhibited the desired features of stationarity. Therefore, no further differencing was required.
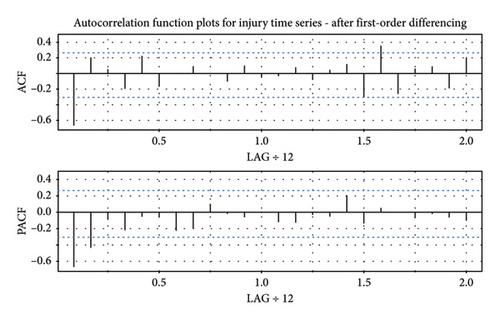
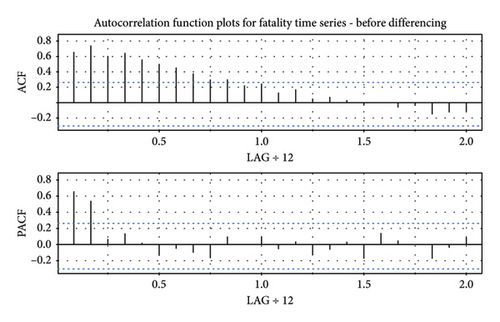
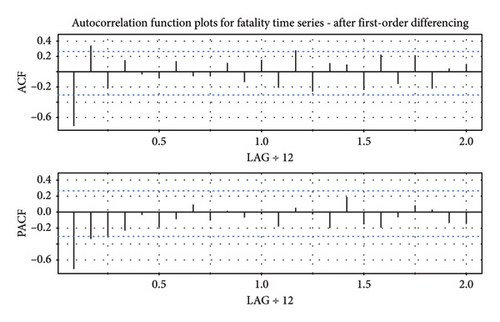
The next stage was to choose parameters for the ARIMA model as the data were prepared and satisfied the modeling requirements of being stationary [65]. This has also been accomplished with the help of ACF and PACF plots.
4.5. Model Selection
The ACF and PACF plots were used to assist us in finding some potential models. Also, we incorporated seasonal parameters in the model because of seasonality being discovered in the time series through the decomposed plots. The models were further assessed using the AIC and BIC values, with lower values indicating better fits, as shown in Table 3.
| Model | AIC | BIC | |
|---|---|---|---|
| Crash | ARIMA (1,1,1) (1,1,0) [12] | 307.4672 | 313.9109 |
| ARIMA (2,1,1) (1,1,0) [12] ∗ | 309.3281 | 317.3827 | |
| ARIMA (1,1,0) (1,1,0) [12] | 314.3036 | 319.1364 | |
| Injury | ARIMA (1,1,0) (1,1,0) [12] | 351.9232 | 356.756 |
| ARIMA (1,1,1) (1,1,0) [12] ∗ | 351.7082 | 345.2645 | |
| ARIMA (0,1,1) (1,1,0) [12] | 346.4246 | 351.2573 | |
| Fatality | ARIMA (1,1,0) (1,1,0) [12] | 329.6649 | 334.4976 |
| ARIMA (0,1,1) (1,1,0) [12] | 325.88 | 330.7128 | |
| ARIMA (0,1,1) (0,1,1) [12] ∗ | 327.4707 | 332.3035 | |
- Note: The significance levels of the parameters in bold are stated in Table 4.
- ∗Not all parameters are significant.
Specifically, for the RTC, injury, and fatality time series, we selected the ARIMA (1,1,1) (1,1,0) [12], ARIMA (0,1,1) (1,1,0) [12], and ARIMA (0,1,1) (1,1,0) [12] models, respectively, as they had the lowest AIC values. When considering the lowest BIC values, we found that the parameters of the chosen RTC model (“ARIMA (1,1,1) (1,1,0) [12] and fatality model (“ARIMA (0,1,1) (1,1,0)[12]”) were significant. However, the injury model (“ARIMA (1,1,1) (1,1,0) [12]”) with the lowest BIC value demonstrated insignificant parameters. Therefore, we selected the ARIMA (0,1,1) (1,1,0) [12] model for the injury time series, which had the lowest AIC value and the second-lowest BIC value. Finally, the parameters of the selected models for RTCs, injury, and fatality time series are statistically significant as presented in Table 4 (p value < 0.05).
| Time series | Parameters | Estimate | Standard error | z value | p value | Error estimates | Ljung test (at lag 24) | |||
|---|---|---|---|---|---|---|---|---|---|---|
| ME | RMSE | MAE | MASE | |||||||
| Crash | ar1 | −0.41 | 0.18 | −2.24 | ≤ 0.05. | −1.09 | 10.60 | 7.42 | 0.48 | 0.81 |
| ma1 | −0.74 | 0.17 | −4.40 | ≤ 0.0001 ∗∗∗ | ||||||
| sar1 | −0.67 | 0.13 | −5.08 | ≤ 0.0001 ∗∗∗ | ||||||
| Injury | ma1 | −0.89 | 0.09 | −9.74 | ≤ 0.0001 ∗∗∗ | −0.48 | 18.05 | 12.71 | 0.49 | 0.15 |
| sar1 | −0.70 | 0.11 | −6.15 | ≤ 0.0001 ∗∗∗ | ||||||
| Fatality | ma1 | −0.87 | 0.08 | −10.93 | ≤ 0.0001 ∗∗∗ | −2.18 | 14.67 | 11.24 | 0.48 | 0.17 |
| sar1 | −0.50 | 0.15 | −3.26 | ≤ 0.001 ∗∗ | ||||||
- Note: Significance codes: 0 “ ∗∗∗;” 0.001 “ ∗∗;” 0.01 “ ∗;” 0.05 “.”.
4.6. Model Diagnostics
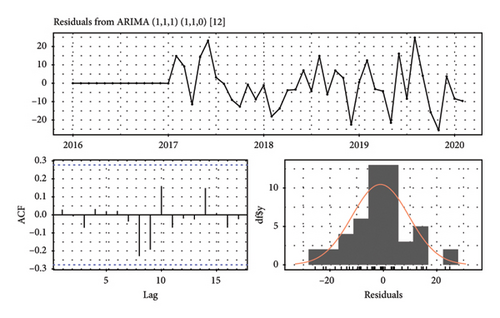
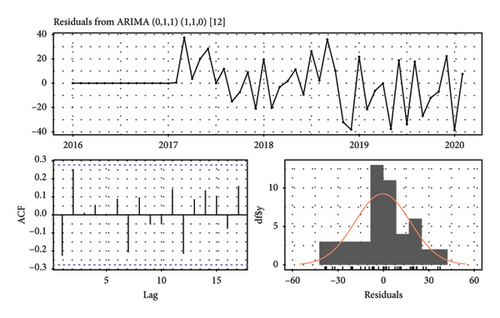
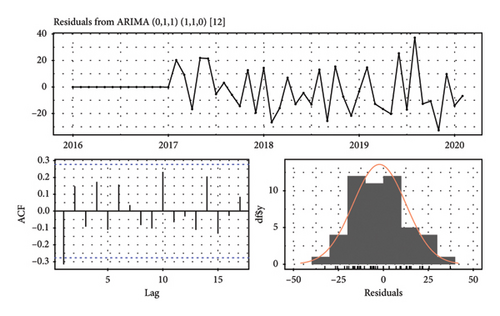
Figure 9 shows residual plots for RTCs, injury, and fatality variables. The residuals display no discernible pattern or substantial autocorrelation and follow a normal distribution. The Ljung–Box test was conducted, yielding p values of 0.81 (RTCs), 0.15 (injury), and 0.17 (fatality) (Table 4). As all p-values exceed 0.05, the null hypothesis of no autocorrelation is not rejected. The absence of evident patterns, the normal distribution of residuals, and the nonrejection of the null hypothesis in the Ljung–Box test support the suitability of the models for forecasting RTCs, injury, and fatality variables.
4.7. Forecasting
The models were fitted for a duration of 50 months, and the subsequent 36 months of the pandemic were projected and compared to the actual values, as presented in Figure 10.
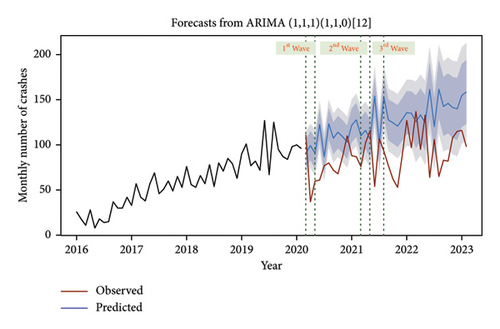
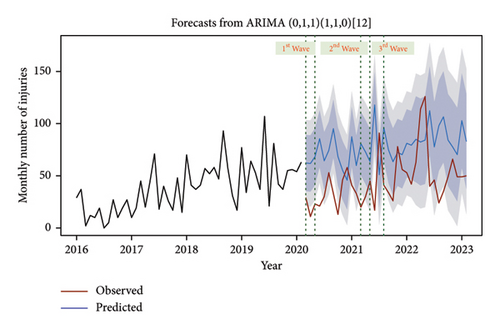
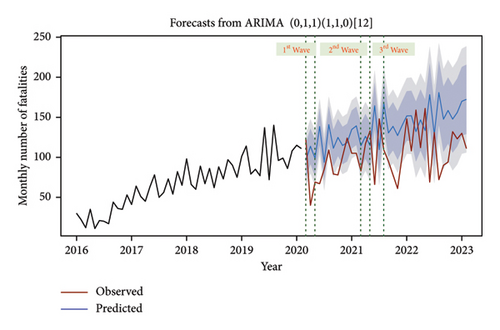
We have delineated the timeframes of three COVID-19 waves experienced in Bangladesh. During the first wave, crashes, injuries, and fatalities decreased significantly due to a 66-day government-imposed lockdown. As the second wave subsided, the number of crashes and fatalities approached predicted levels, while injuries remained notably lower than anticipated. In the third wave, there was an initial sharp decline followed by a rapid increase in crashes, injuries, and fatalities. Interestingly, during the rising phase of the third wave, the number of crashes was lower than predicted, whereas injuries and fatalities exceeded forecasts. In addition, these waves reveal a consistent pattern: in the first and second waves, there is a significant surge in the number of crashes, injuries, and fatalities toward the end of each wave, whereas in the third wave, a similar surge occurs approximately at the midpoint.
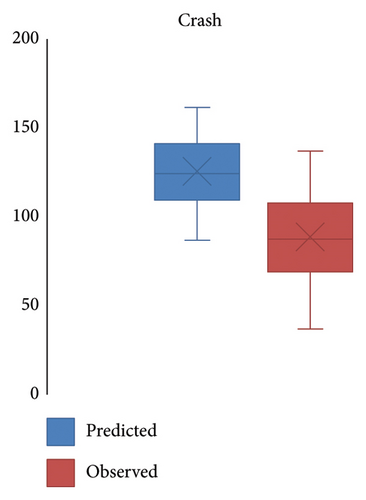
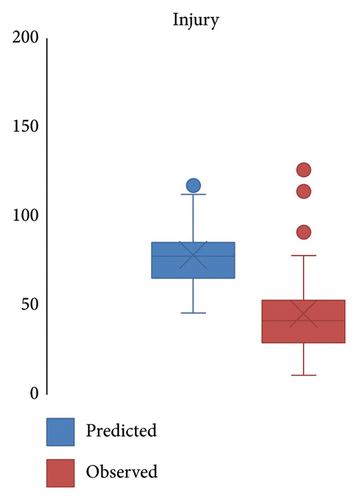
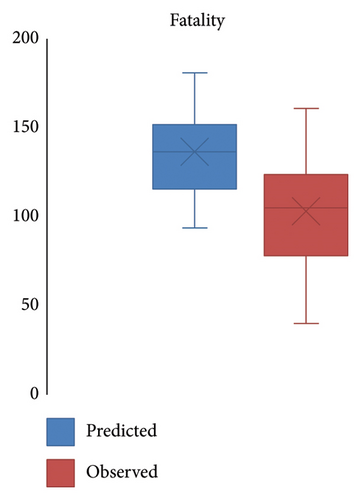
Furthermore, the box and whisker plot analysis were conducted to investigate the disparities between the observed and predicted values (Figure 11). The dataset encompassed the pandemic period (36 months) with predicted values derived from the forecasting models and corresponding observed values (testing data). The observed values consistently remained lower than the predicted values for all three variables (RTCs, injury, and fatality). This discrepancy can be attributed to the implementation of various containment measures during the COVID-19 pandemic. The lower medians and shorter whiskers for observed data further support this trend. These findings suggest that the COVID-19 containment measures significantly shaped the observed outcomes of motorcycle crashes, injuries, and fatalities.
5. Discussion
The study’s key findings are highlighted in this section. We developed three ARIMA models to demonstrate the effect of the coronavirus crisis. It is critical to emphasize that the values predicted by these models correspond to what would have been seen in the absence of the epidemic. The actual data, which include the recorded numbers of motorcycle-involved crashes, injuries, and deaths, were then compared to the anticipated values.
The results revealed the positive impact of containment measures on motorcycle crash occurrences in Bangladesh. The data showed a notable decline in the occurrence of crashes, injuries, and fatalities primarily due to limiting mobility. This highlights the positive impact of containment measures during the pandemic on reducing motorcycle crashes. Restrictions such as lockdowns, travel bans, and limited public transport led to decreased road activity, contributing to a significant decline in crashes, injuries, and fatalities. This aligns with global findings, showing that reduced mobility effectively enhances road safety including motorcyclists [21, 22, 66]. The results emphasize the effectiveness of mobility restrictions in promoting road safety and reducing motorcycle-related accidents.
However, motorcycle-involved incidents (crash, injury, and fatality) did not reach zero levels during the pandemic, not even during the 66-day general holiday period. Contrary to expectations, the research conducted in Bangladesh revealed that more than half of the population needed to adhere to the government’s instructions to stay home or practice isolation during the lockdown [67]. This lack of adherence reflects broader criticisms of the government’s measures, which were often seen as ineffective due to poor enforcement and coordination [12]. Consequently, the level of mobility did not decrease as anticipated, which can be identified as the primary cause of nonzero motorcycle occurrences, as supported by previous research [68]. These findings highlight the complex dynamics between pandemic-related restrictions, individual behavior, and road safety outcomes in Bangladesh.
During the first and second waves, a notable increase in these incidents was observed toward the end of each wave, correlating with the gradual relaxation of government-imposed restrictions. This suggests that as mobility restrictions eased, there was an immediate rise in road activity, leading to a spike in accidents. Conversely, during the third wave, the surge in crashes, injuries, and fatalities emerged earlier, around the midpoint of the wave, indicating that riskier driving behavior and increased road use occurred even before the full relaxation of restrictions. The findings suggest that while government measures initially curbed mobility and crashes, these surges highlight the importance of consistent road safety strategies, especially as restrictions are lifted.
Box and whisker plots revealed higher fatality rates compared to injury rates during the pandemic. This can be attributed to a potential tendency among motorcycle riders to opt for higher speeds due to reduced traffic, as their perception of safety increases with lesser vehicles on the road [69]. As a result, the likelihood of fatal motorcycle crashes increased [70]. This notion is supported by several studies that have reported an increase in speed-related fatal collisions in the course of the pandemic [20, 26, 58, 71]. Another reason could be that around 1.1 million new motorcycles were registered between 2020 and 2022 in Bangladesh [5]. These newly purchased motorcycles can impact road safety. Studies have provided evidence that individuals who have limited experience in motorcycle riding, as well as those who lack familiarity with a particular motorcycle, are at a higher risk of being involved in fatal motorcycle crashes (Mullin et al., 2000; Paulozzi, 2005). Furthermore, being a new rider to a particular type of motorcycle can double the risk [72]. Finally, during the pandemic, the government of Bangladesh adopted a containment framework that focused heavily on travel bans and mobility restrictions, while road safety strategies were largely overlooked. This lack of emphasis on safety measures resulted in an unregulated road environment, contributing to motorcycle crash data that showed a significantly higher fatality rate compared to injury rates. These factors, including increased motorcycle purchases, rider inexperience, and the underemphasis on road safety measures by the government, contributed to the higher levels of motorcycle-related fatalities during the pandemic. Addressing these critical issues is essential to reducing risks and improving the safety of motorcycle riders on the road.
6. Conclusion
This study employed ARIMA models to assess the impact of the COVID-19 pandemic on motorcycle-related crashes, injuries, and fatalities in Bangladesh by comparing expected figures without the pandemic to actual recorded data. The findings indicate that containment measures like lockdowns and travel restrictions significantly reduced road activity, leading to a notable decline in motorcycle incidents, aligning with global trends of enhanced road safety due to decreased mobility. However, full adherence to restrictions was lacking, resulting in motorcycle incidents not dropping to zero even during strict lockdowns. As government-imposed restrictions eased toward the end of the first and second waves, a surge in incidents occurred due to increased mobility, while in the third wave, this surge appeared earlier, suggesting riskier driving behaviors before full relaxation of measures. In addition, higher fatality rates compared to injury rates were observed, likely due to riders adopting higher speeds on less congested roads and an influx of inexperienced riders following a rise in new motorcycle registrations. The government’s focus on containment without adequate road safety strategies led to an unregulated road environment, emphasizing the necessity for integrated policies that address both mobility restrictions and road safety enforcement to improve motorcycle safety during pandemics.
The recommended countermeasures are described in terms of the observed results.
6.1. Enhancing Data Collection to Improve Motorcycle Safety in Bangladesh
Collecting comprehensive data on mobility patterns and road user behavior is crucial for understanding crash risks and implementing effective road safety measures. The ITF (2021) emphasizes that analyzing pandemic data helps policymakers discern whether changes in road fatalities result from altered travel behaviors or exposure levels, enabling targeted interventions [73]. In Bangladesh, enhancing data collection will empower authorities to monitor the impact of mobility changes during the pandemic and develop evidence-based policies to significantly improve motorcycle safety outcomes.
6.2. Speed Management
To enhance traffic safety during and after pandemics, a comprehensive speed management program is recommended. This should include focused enforcement, such as deploying speed cameras and increasing police patrols on high-speed roads, along with signs that provide real-time speed feedback to encourage safer driving [73]. Engineering solutions like speed cushions in residential areas can help slow traffic, and public awareness campaigns should target risky speeding behaviors. These measures are expected to reduce speeding-related crashes, safeguard vulnerable road users, and lower fatalities and serious injuries, particularly benefiting motorcyclists who are at higher risk during high-speed incidents.
6.3. Enhancing Rider Education Through Structured Training
Rider education is essential for reducing crash risks, especially among younger and inexperienced motorcyclists. Traditional training often focuses on basic skills but lacks real-world road experience, leaving riders vulnerable. Adopting a system for motorcyclists, which emphasizes supervised road experience and hazard perception, can significantly improve safety. This structured approach helps new riders develop essential cognitive skills while gradually gaining experience [74]. Involving the community in developing these programs ensures riders are well-prepared to handle road risks from the training stage, ultimately enhancing safety outcomes.
6.4. Using Helmets
Amid the COVID-19 pandemic, enforcing the use of full-face helmets for both motorcycle riders and passengers is highly recommended. Properly worn helmets have been proven to significantly decrease the risk of fatal injuries, making their mandatory use a vital measure during this period [75, 76]. With healthcare systems strained by the surge in COVID-19 cases, reducing preventable injuries from motorcycle crashes is essential to alleviate the burden on medical facilities. In the long term, widespread helmet use can lead to sustained improvements in road safety, reduce healthcare costs associated with traffic accidents, and contribute to a safer postpandemic recovery.
Finally, it is essential to acknowledge that our research faced limitations due to the need for more crucial information in the dataset. We did not have access to data regarding the driver’s age, weather conditions (clear/cloudy/rainy), road characteristics (geometric features), impairment from drugs and alcohol, and other relevant factors. This absence of information prevents us from comprehensively understanding the driving and environmental elements involved in the crash. Therefore, we strongly advocate developing guidelines to educate journalists on accurately documenting crash reports with all the necessary information. In addition, our study was conducted at an aggregate level, focusing on Bangladesh. However, since Bangladesh has eight administrative divisions, conducting separate analyses for each division could provide valuable insights into identifying which areas are more vulnerable and require specific attention. Furthermore, it should be noted that this study does not include a detailed exploration of the interactions among various transportation modes. The impact and dynamics of these interactions remain outside the scope of this analysis, representing a significant limitation.
Conflicts of Interest
The authors declare no conflicts of interest.
Funding
This research received no specific grant from any funding agency in the public, commercial, or not-for-profit sectors.
Appendix
| Record | Source | Page no. | Date of accident occurrence | Day of week | Time of accident | Date of newspaper | Month | Year | District | Thana | Accident location | Road name | Name of hospital | Killed nos | Age killed | Injured | Accident type | Vehicles 1 | Vehicles 2 | Vehicle 3 | Remarks | Data entry operator |
|---|---|---|---|---|---|---|---|---|---|---|---|---|---|---|---|---|---|---|---|---|---|---|
| 1 | B.P | 3 | 31 | Tue | Day | 1 | 1 | 2020 | Dhaka | Sutrapur | Victoria park | ? | DMCH | 2 | 56,60 | ? | Hit pedestrian | Bus | M | |||
| 2 | B.P | 3 | 31 | Tue | Day | 1 | 1 | 2020 | Dhaka | Motijheel | Narinda | ? | ? | 1 | 34 | ? | Hit pedestrian | Bus | M | |||
| 3 | P.A | 20 | 31 | Tue | Day | 1 | 1 | 2020 | Dhaka | Shampur | ? | ? | ? | 1 | 60 | ? | Rear end | Truck | Auto ricksha | M | ||
| 4 | Jugantor | 15 | 30 | Mon | Night | 1 | 1 | 2020 | Tangail | Gopalpur | Sonamui | ? | ? | 1 | ? | ? | Hit pedestrian | Auto ricksha | M | |||
| 5 | Jugantor | 15 | 31 | Tue | Day | 1 | 1 | 2020 | Bogra | Dhunat | Banigati | ? | ? | 1 | 35 | ? | Rear end | Truck | Motor cycle | M | ||
| 6 | Jugantor | 15 | 31 | Tue | Day | 1 | 1 | 2020 | Rajbari | Sadar | Front of murge firm | Rajbari-Baliakandi | ? | 1 | ? | ? | Rear end | Truck | Bicycle | M |
Open Research
Data Availability Statement
The data utilized in this study are available through the Accident Research Institute (ARI) at the Bangladesh University of Engineering and Technology (BUET), a nonprofit organization. Access to this data can be facilitated upon formal request to the institute, subject to its terms and conditions.


