Impact of Electric Vehicles on Traffic Assignment and Carbon Emission for Road Network: Modeling and Analysis
Abstract
This paper develops a method for estimating carbon-emission specific road networks, considering the presence of electric vehicles (EVs). A mixed equilibrium traffic assignment model is set up to obtain the traffic volume for each link in the network, where oil-fueled vehicles (OFVs) prioritizing travel time minimization, while EVs also consider charging station locations and battery charge state in route selection. A carbon-emission estimation method is then developed, which is calculated by three parameters of traffic volume, average speed, and the road category. A case study is carried out using two networks. It is found that the travel time of the road network has increased by 27%, because EVs tend to choose paths containing charging stations. The route selection of EVs is affected by perceived risk, safe electric quantity, and expected charging electricity. EVs can reduce carbon dioxide emissions but not energy consumption for road network. In addition, it was found that the location of charging stations has a significant impact on traffic flow. After optimizing the location of charging stations, the total travel time, total carbon emissions, and balance of charging station utilization indicators in the transportation network have all relatively decreased. Among them, the total travel time has decreased by 0.2%, the total carbon emissions have decreased by 1.85%, and the balance of charging station utilization has decreased by 0.95%. The research is helpful for determining the locations of charging piles and designing road networks, and it is also helpful for estimating the traffic flow and carbon emissions.
1. Introduction
Many countries have introduced carbon reduction policies in response to global warming, identifying transportation as primary source of carbon emissions. For example, “The Long-Term Strategy of The United States Pathways to Net-Zero Greenhouse Gas Emissions by 2050”, “The Action Plan for Peak Carbon Dioxide Emissions by 2030” issued by China, and “Clean Growth Strategy” issued by the United Kingdom. Encouraging travelers to choose environmentally friendly travel modes is crucial for reducing carbon emissions. Electric vehicles (EVs) are expected to reduce carbon emissions and air pollution, leading to extensive development of associated transportation infrastructure. As the transition unfolds, a mixed traffic flow comprising both oil-fueled vehicles (OFVs) and EVs will persist until EVs eventually replace OFVs entirely.
EVs also have some problems that need to be solved: First, charging stations is limited, and how to optimize the charging facilities are crucial; Secondly, the distance an EV can travel is short, causing anxiety among users on the route; Finally, the driving behavior of EV user is inconsistent with that of OFV, which could have new impacts on the road network. Therefore, scholars in academia are actively investigating topics such as EV path selection, charging behavior, and energy consumption.
In those studies on EVs charging behavior, Cai et al. [1] proposed two charging strategies: user optimization and system optimization. They pointed out that the user optimization strategy aims to guide individual charging behavior, while the system optimization strategy focuses on coordinating and controlling charging behavior at a broader level. Liu [2] developed a charging process function and vehicle energy consumption model to examine charging strategies for connected EVs. Wang et al. [3] proposed a model to predict EV charging demand, employing the Monte Carlo method to simulate EV travel characteristics. Yang et al. [4] analyzed factors that affect high-power charging for private EVs, considering travel time and driving distance. Wang et al. [5] designed a geometry-based charging guidance algorithm, suitable for intelligent charging services. Pan et al. [6] developed a charging choice behavior model for EV drivers based on a logit model to simulate charging decisions at the destination. Yang et al. [7] proposed a polynomial logit model and a nested logit model using survey data to compare travel behavior among EV and OFV drivers. Wang et al. [8] analyzed the charging behavior of EV drivers considering heterogeneity and satisfaction factors. Wang et al. [9] proposed a multistage optimization model to provide inter-city travel charging strategies for EV drivers. Xiong et al. [10] formulated an optimization model for charging station to minimize social costs, introducing a K-level nested quantum response equilibrium model to analyze the EV driver decision-making during the charging. He et al. [11] investigated the influence of EVs’ limited driving range and charging requirements on route choice, although a linear charging function was used for charging time calculation, without considering for charging piles location planning in the hybrid traffic network. Agrawal et al. [12] developed a multiclass dynamic user equilibrium model to investigate EV driver routes and their impact on traffic network performance.
Aiming at EV path selection, Chen et al. [13] proposed a bi-level programming model to optimize the location and capacity of charging facilities, striking a balance between EV route selection and charging waiting time. Jensen et al. [14] found that drivers’ preferences shift from travel time and travel distance before using EVs to route accessibility afterward. It implies that it may be necessary to modify the traffic planning model of EVs and the assumptions of path problems. Pourazarm and Cassandras [15] studied EV path problem in networks with charging nodes to minimize the total travel time. Shao et al. [16] proposed a path selection method for EVs, integrating charging time and variable travel time consideration based on distance limit and EV charging demand.
In the realm of energy consumption literature, Cai [17] developed a path planning model incorporating the energy consumption model for EVs and a nonlinear charging function. Song [18] proposed an energy consumption model under various driving conditions considering the correlation between battery energy consumption and the vehicle driving index. He et al. [19] proposed an emission model for EVs and OFVs based on energy consumption data. Zhang and Yao [20] developed an energy consumption factor model using actual driving condition data, considering the correlation between speed and link. Yao et al. [21] investigated an electricity consumption model and a gasoline consumption model to explore the influence of EV penetration on road traffic conditions and energy consumption. Zhong et al. [22] integrated environmental capacity constraints into mixed EV and OFV network traffic to mitigate emissions in protected areas, addressing suboptimal charging pricing scheme within fixed and elastic demand user equilibrium frameworks. Yao et al. [23] used vehicle-specific electricity as an intermediate variable to analyze energy consumption models disparities across distinct road structures, highlighting the pivotal role of the energy consumption coefficient in road energy consumption.
In summary, existing literature has explored the classification of charging piles in relation to travel, has not delved into traffic equilibrium assignment considering the hierarchical layout of charging piles within mixed traffic flows. As for the research on traffic equilibrium assignment, existing works modeled the EV route selection by limiting the range of EV, failing to consider the impact of user perception deviation and the state of charge (SOC). In addition, the effect of EV on the road network is unclear, the measurement method for network carbon emission requires further explored.
To address these research gaps, this paper develops a mixed user equilibrium (M-UE) traffic assignment model to analyze path selection, charging behavior, charging station utilization and traffic flow distribution. Factors such as traveler risk perception, perceived time deviation, and initial SOC are taken into account. A novel method is proposed to describe charging behavior by introducing minimum remaining charge and desired charge parameters. Additionally, a carbon-emission method is developed based on the mixed equilibrium assignment model.
The remainder of this paper is organized as follows: Section 2 presents a mixed traffic equilibrium assignment model and a carbon-emissions method. Section 3 presents a case study, and Section 4 outline important conclusions.
2. Methodology
This paper mainly investigates the impact of EVs on traffic flow assignment and carbon emissions in road network. EV users have range anxiety, and EV need to consider charging, leading to inconsistent path selection with fuel vehicles. Therefore, it is necessary to propose a new traffic assignment model to describe the impact of EVs on flow distribution. Then, a carbon emission calculation model is set up based on traffic volume obtained from traffic assignment model to analyze the impact of EVs in road network.
2.1. Mixed Traffic Equilibrium Assignment Model
To simplify the model in this paper, several assumptions are made regarding the types of vehicles and their behavior within the network. The network comprises traditional OFVs and EVs. OFV users choose route based on the shortest time, drawing from their own experience. Meanwhile, EV users consider both travel time and charging time when choosing. EVs require charging at stations located at the network’s connection nodes, based on distance and SOC. Two user types are considered: EV users and OFV users. EVs may need to charge during a trip to ensure reach their destination, while OFVs are assumed to have sufficient gasoline to complete their trip. EV users have varying risk perceptions and associated perceived travel time. In addition, the number of charging stations in the traffic network is limited.
Equation (13) is the complementary. Given , if , then ; if , then .
2.2. Carbon Emissions Calculation Model
2.3. Solution Algorithm
In the above model, the objective function formula (21) aims to minimize the total travel time; constraint formula (22) ensures traffic flow balance; constraint formulas (23) and (25) specify the electric quantity relationship for a selected path between the origin and destination. Travelers will not deplete the electric quantity completely in the constraint condition (24), and they prefer to keep some remaining electric quantity not less than the comfortable electric quantity.
-
Step 1: Convert the proposed traffic assignment model into an optimization model. The transformation model is solved for each type of user (m ∈ M) between the OD pair (w ∈ W). The initial available path set is obtained based on link flow xa, and the minimum actual charging time is calculated by .
-
Step 2: Let iterations n = 0, and is obtained based on traffic flow xa. The M-UE model is solved to obtain the optimal road network traffic flow assignment ( and ) based on the initial available path ().
-
Step 2.1: Let n = n + 1, calculate based on the current traffic flow of each section .
-
Step 2.2: According to the travel time and OD traffic obtained in step 2.1, perform all or nothing traffic assignment to obtain the additional traffic flow of each link .
-
Step 2.3: Calculate the current link flow . Based on the traffic flow of each road, the traffic flow that can reach the path.
-
Step 3: If , joins in . If , iteration stop, and the optimal path traffic are output; otherwise, go to Step 1.

3. Analysis
This section uses two classic networks to analyze the proposed traffic assignment model and carbon emission calculation model. This paper analyzes the impact of four parameters on travel time and charging, including risk perception, safe remained electricity, initial electricity, and proportion. The carbon emission calculation model is tested by considering safe remained electricity, desired charging electricity, and road type.
3.1. Traffic Assignment
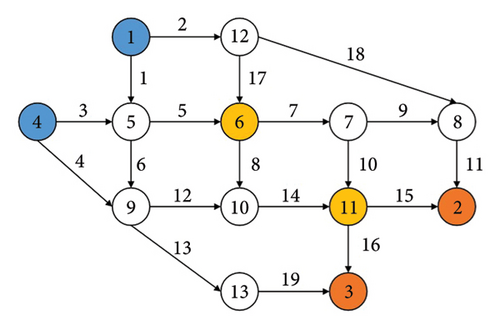
The Nguyen-Dupius network is a classical network commonly used to assess the traffic assignment models. It consists of 4 OD pairs, 19 links, and 13 nodes [24], as shown in Figure 2. Nodes 1 and 4 serve as origins, nodes 6 and 11 are designated charging nodes, and nodes 2 and 3 represent destinations. The parameters are shown in Table 1. The battery capacity (Lmax) is set at 40 kWh, and ϖ = 0.167 kWh/km.
| Link | Distance (km) | Free flow travel time (min) | Capacity (veh/h) |
|---|---|---|---|
| 1 | 14 | 7 | 900 |
| 2 | 16 | 8 | 700 |
| 3 | 18 | 9 | 700 |
| 4 | 28 | 14 | 900 |
| 5 | 10 | 5 | 800 |
| 6 | 18 | 9 | 600 |
| 7 | 10 | 5 | 900 |
| 8 | 26 | 13 | 500 |
| 9 | 10 | 5 | 300 |
| 10 | 18 | 9 | 400 |
| 11 | 20 | 10 | 700 |
| 12 | 20 | 10 | 700 |
| 13 | 18 | 9 | 600 |
| 14 | 16 | 8 | 700 |
| 15 | 18 | 9 | 700 |
| 16 | 16 | 8 | 700 |
| 17 | 14 | 7 | 300 |
| 18 | 30 | 15 | 700 |
| 19 | 22 | 11 | 700 |
| — | — | — | — |
The EV penetration rate is assumed to be 30%. EV users are divided into three different types, with each type having a penetration rate is set to 10%. Other parameters such as demand, risk perception (θm), and perceived time errors (γm) are shown in Table 2. The safe electricity and initial electricity are provided in Table 3.
| OD | Demand | Users type | Risk perception θm | Perception time deviation γm and proportion | Proportion (%) |
|---|---|---|---|---|---|
| (1, 2) | 400 | BEV | 1.1 | (1.2, 50%; 1.5, 40%; 2, 10%) | 10 |
| 1.3 | 10 | ||||
| 1.5 | 10 | ||||
| (1, 3) | 800 | BEV | 1.1 | (1.2, 50%; 1.5, 40%; 2, 10%) | 10 |
| 1.3 | 10 | ||||
| 1.5 | 10 | ||||
| (4, 2) | 600 | BEV | 1.1 | (1.2, 50%; 1.5, 40%; 2, 10%) | 10 |
| 1.3 | 10 | ||||
| 1.5 | 10 | ||||
| (4, 3) | 200 | BEV | 1.1 | (1.2, 50%; 1.5, 40%; 2, 10%) | 10 |
| 1.3 | 10 | ||||
| 1.5 | 10 | ||||
| θm | Safe remained electricity | Initial electricity and proportion |
|---|---|---|
| 1.1 | 0.1Lmax | (0.15Lmax, 60%; 0.2Lmax, 30%; 0.25Lmax, 10%) |
| 1.3 | 0.15Lmax | (0.15Lmax, 60%; 0.2Lmax, 30%; 0.25Lmax, 10%) |
| 1.5 | 0.2Lmax | (0.15Lmax, 60%; 0.2Lmax, 30%; 0.25Lmax, 10%) |
The results of the traffic assignment are shown in Table 4, indicating the utilization of 13 paths by travelers along with path flow and path travel time. In addition, paths 1, 6, and 13 have no EVs flows, due to there are no charging station in the path. Paths 3, 5, 9, 10, and 12 are unsuitable for EVs with low initial electricity due to limitations arising from distance and position of charging station node.
| OD | Path ID | Path | Number of vehicles on the path (veh) | Travel time (min) | |||
|---|---|---|---|---|---|---|---|
| EV | Energy consumption (kWh) | OFV | Total | ||||
| (1, 2) | 1 | 1-12-8-2 | 0 | 11.02 | 264 | 264 | 49.63 |
| 2 | 1-5-6-7-8-2 | 120 | 10.69 | 0 | 120 | 51.09 | |
| 3 | 1-5-9-10-11-2 | 0 | 14.36 | 16 | 16 | 49.63 | |
| (1, 3) | 4 | 1-5-6-7-11-3 | 240 | 11.36 | 0 | 240 | 50.53 |
| 5 | 1-5-9-10-11-3 | 0 | 14.03 | 345 | 345 | 49.07 | |
| 6 | 1-5-9-13-3 | 0 | 12.02 | 215 | 215 | 49.07 | |
| (4, 2) | 7 | 4-5-6-7-8-2 | 103 | 11.36 | 154 | 257 | 63.90 |
| 8 | 4-5-6-7-11-2 | 77 | 12.36 | 0 | 77 | 63.90 | |
| 9 | 4-5-6-10-11-2 | 0 | 14.7 | 50 | 50 | 63.80 | |
| 10 | 4-9-10-11-2 | 0 | 13.69 | 216 | 216 | 63.90 | |
| (4, 3) | 11 | 4-5-6-7-11-3 | 64 | 12.02 | 4 | 64 | 63.33 |
| 12 | 4-9-10-11-3 | 0 | 13.36 | 10 | 10 | 63.33 | |
| 13 | 4-9-13-3 | 0 | 11.36 | 122 | 122 | 63.33 | |
Figure 3 illustrate the number of charging vehicles at charging station node 6 and 11 under a mixed equilibrium. Node 6 has a higher number of charging vehicles compared to node 11, attributed to varying risk perceptions. However, the number of EV users choosing node 6 gradually decreases with the increase in risk perception and initial electricity. Correspondingly, the safe electricity and initial electricity increase with the improvement of risk perception. Additionally, node 11 is closer to the destination, leading to more EVs choose node 11 for charging.
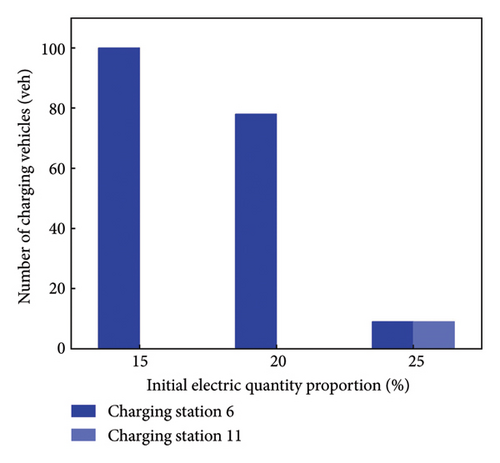
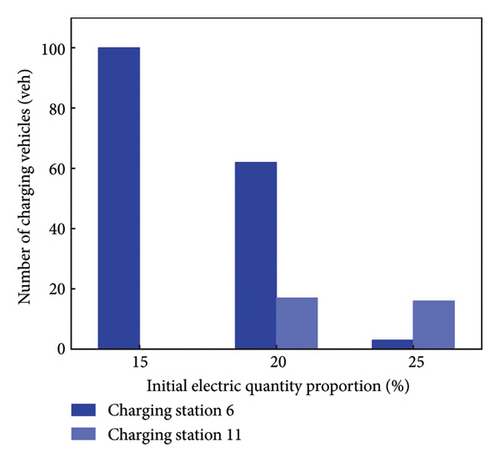
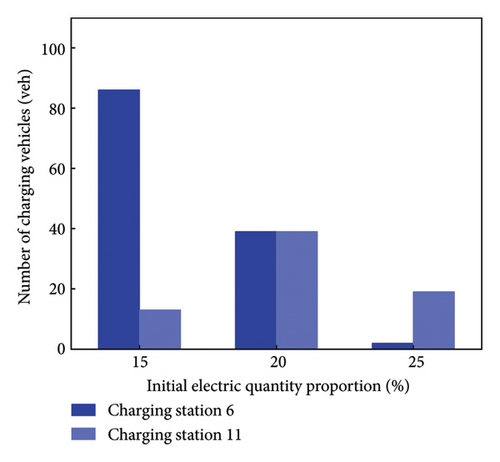
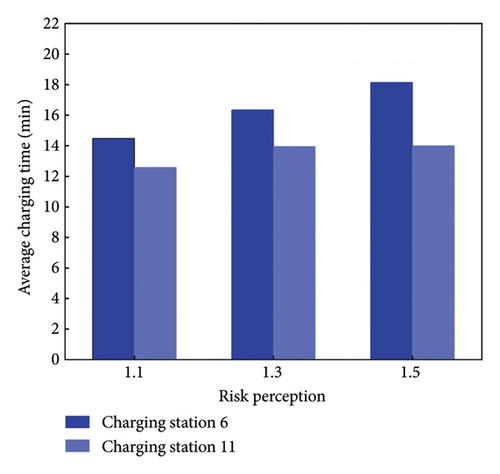
Figure 3 depicts the charging time of nodes 6 and 11. The average charging time at node six exceeds that of node 11, due to the latter’s proximity to the destination. More EVs opt for node 6 to ensure their remaining electricity surpassed the safe electricity threshold. EV users tend to increase their charging time to avoid the anxiety associated with heightened of risk perception. Comparison between Figures 4(a) and 4(b), reveals that perceived charging time is higher than the actual charging time.
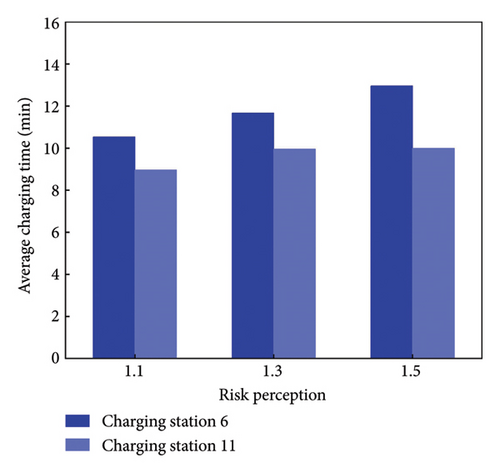
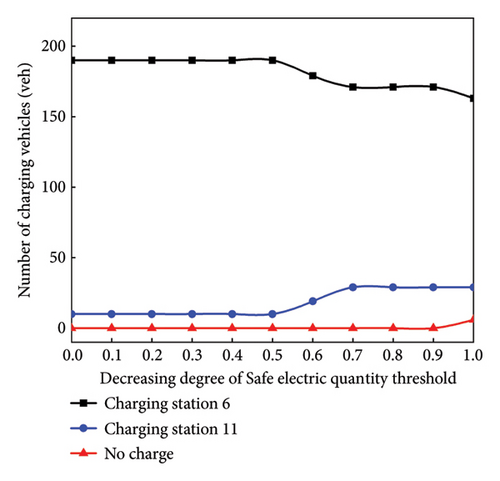
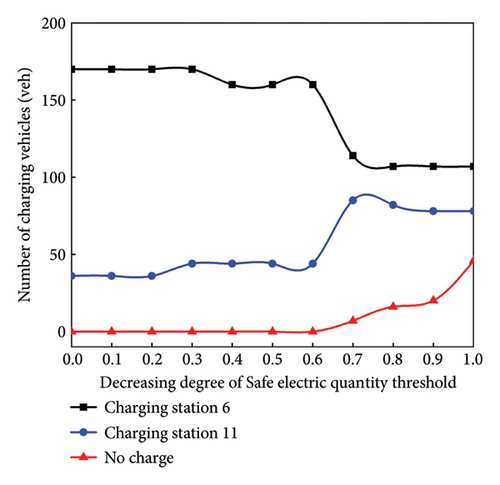
The impact of risk perception on the M-UE model is further analyzed by a reduction the initial electricity, as shown in Figure 5. The number at charging vehicles at charging station node 6 and node 11 is shown in Figure 5 under different risk perceptions. If θm = 1.1, a small number of EV users transition from node 6 to node 11for charging as the safe electricity diminishes. If the safe electricity reaches 0, most users choose to charge their EVs. If θm = 1.3, the number of EV users who charge at node 11 gradually increases as the safe electricity decreases. If θm = 1.5, the number of EVs users choosing not to charge their EV increases the most as the safe electricity decreases.
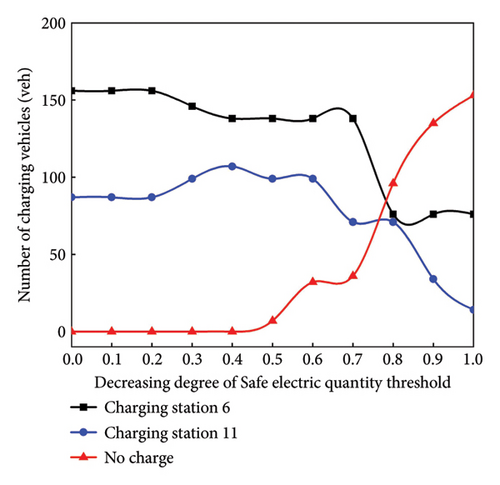
Based on the information provided in Table 4, it appears that some users do not charge their EVs on route, thereby making path 2 and path 4 suboptimal. Consequently, Table 5 presents detailed path information without considering the safe electricity. Comparing the travel time between Tables 4 and 5 reveals differences. Notably, the total travel time increases by 37.02% when considering the safe electricity.
| OD | Path ID | Node order | Total | Travel time (min) |
|---|---|---|---|---|
| (1, 2) | 1 | 1-12-8-2 | 271 | 50.26 |
| 2 | 1-5-6-7-8-2 | 92 | 50.25 | |
| 3 | 1-5-9-10-11-2 | 43 | 50.25 | |
| (1, 3) | 4 | 1-5-6-7-11-3 | 193 | 49.35 |
| 5 | 1-5-9-10-11-3 | 381 | 49.35 | |
| 6 | 1-5-9-13-3 | 226 | 49.35 | |
| (4, 2) | 7 | 4-5-6-7-8-2 | 275 | 63.92 |
| 8 | 4-5-6-7-11-2 | 65 | 63.92 | |
| 9 | 4-5-6-10-11-2 | 50 | 63.92 | |
| 10 | 4-9-10-11-2 | 210 | 63.92 | |
| (4, 3) | 11 | 4-5-6-7-11-3 | 62 | 63.02 |
| 12 | 4-9-10-11-3 | 12 | 63.02 | |
| 13 | 4-9-13-3 | 121 | 63.02 | |
Figure 6 shows the average charging time for node 6 and node 11, without setting the safe electricity. Comparing with Figure 4, if θm = 1.1, the average charging time is smaller; if θm = 1.3 or θm = 1.5, the charging time at node 11 increases, because more EV users choose to charge at station 11 to supplement electricity without considering the safe electricity.
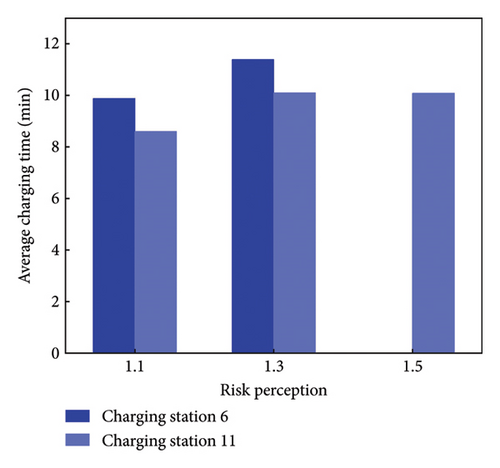
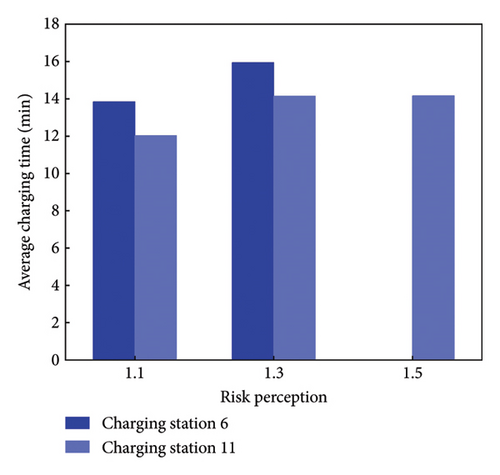
In summary, considering the safe electricity parameter leads to higher travel times for some paths compared to others. With the increase in risk perception, more EV users choose node 11 for charging, despite the potential increase in charging time. In addition, the influence of the safe electricity on the M-UE model is further analyzed in the N-D network.
3.2. Carbon Emissions and Energy Consumption
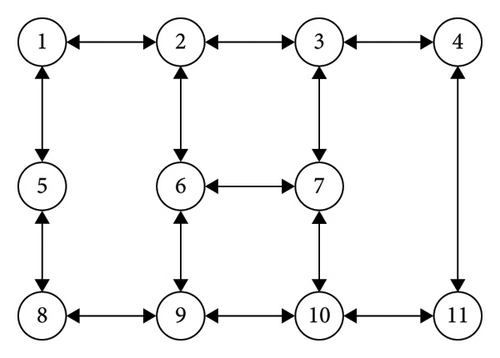
Figure 7 shows the test network, that consists of 2 OD pairs, 11 nodes and 14 links. The information of this network is shown in Table 6. The EV battery capacity is set at Lmax = 24 kWh in this study. The charging stations are located at nodes 1, 9, and 10 respectively. The safe electricity values are shown in Table 7.
| Link | Road degree | Road capacity (veh/h) | Road distance (km) | Road speed (km/h) | |
|---|---|---|---|---|---|
| 1 | 1–2 | Main road | 1400 | 14.5 | 12.27 |
| 2 | 2–3 | Main road | 1400 | 26.2 | 25.02 |
| 3 | 3–4 | Main road | 1400 | 37.5 | 16.26 |
| 4 | 4–11 | Main road | 1400 | 46.8 | 26.84 |
| 5 | 8–5 | Main road | 1400 | 14.2 | 37.72 |
| 6 | 9–8 | Main road | 1400 | 33.4 | 26.16 |
| 7 | 10–9 | Main road | 1400 | 24.2 | 26.22 |
| 8 | 11–10 | Main road | 1400 | 36.9 | 14.50 |
| 9 | 1–5 | Secondary road | 1000 | 44.5 | 17.78 |
| 10 | 2–6 | Branch road | 700 | 19.2 | 24.15 |
| 11 | 3–7 | Branch road | 700 | 7.4 | 25.43 |
| 12 | 6–9 | Branch road | 700 | 27.8 | 21.63 |
| 13 | 6–7 | Branch road | 700 | 26.4 | 25.39 |
| 14 | 7–10 | Branch road | 700 | 28.9 | 27.49 |
| Parameters | Value |
|---|---|
| α∗ | , , |
| β∗ | , |
The results of traffic assignment, obtained using the network equilibrium, are shown in Table 8, serving as the basis for analyzing emissions and energy consumption.
| OD | Demand | Path ID | Node order | Path distance (km) | Number of vehicles on path (veh) | Selection probability | Path travel time (min) |
|---|---|---|---|---|---|---|---|
| 1–11 | 1400 | 1 | 1-2-3-4-11 | 125 | 263.29 | 0.19 | 127.00 |
| 2 | 1-2-3-7-10-11 | 123.9 | 297.72 | 0.21 | 125.76 | ||
| 3 | 1-2-6-7-10-11 | 125.9 | 197.66 | 0.14 | 129.86 | ||
| 4 | 1-2-6-9-10-11 | 122.6 | 624.22 | 0.45 | 118.40 | ||
| 5 | 1-5-8-9-10-11 | 153.2 | 17.11 | 0.01 | 154.28 | ||
| 4–8 | 1200 | 6 | 4-3-2-1-5-8 | 136.9 | 246.33 | 0.21 | 138.49 |
| 7 | 4-3-2-6-9-8 | 144.1 | 109.77 | 0.09 | 146.54 | ||
| 8 | 4-3-7-6-9-8 | 142.5 | 318.37 | 0.26 | 135.96 | ||
| 9 | 4-3-7-10-9-8 | 141.4 | 362.19 | 0.30 | 134.69 | ||
| 10 | 4-11-10-9-8 | 141.3 | 163.35 | 0.14 | 142.59 | ||
3.2.1. Road Type
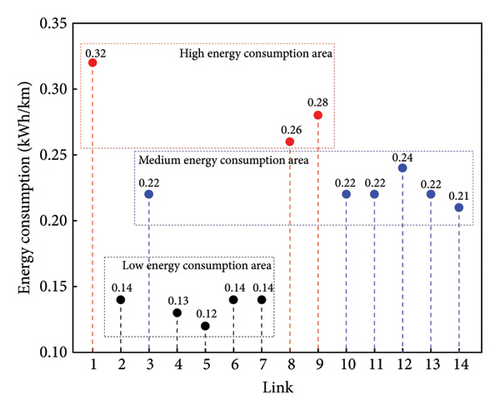
Figure 8 is a scatter diagram illustrating the energy consumption rate on roads, divided into three categories based on energy consumption. Road with an energy consumption rate below 0.15 kWh/km, are classified as low energy consumption areas; those with the energy consumption rate ranging from 0.15 to 0.25 kWh/km, are classified as medium energy consumption areas; while roads with rates exceeding 0.25 kWh/km are considered high energy consumption areas. Specifically, links 2 and 4 to 7 fall under the category of low energy consumption areas; links 1, 8 and 9 belong to the high energy consumption areas; links 3 and 10 to 14 are categorized in the medium energy consumption areas. According to Table 5, the energy consumption is found to be significantly related to speed and traffic volume.
The initial electricity is assumed to be full, and the safe electricity is 1%. Figure 9 illustrates the charging time, total travel time, and carbon emissions for four different road network categories. Category 1 is defined as main roads, category 2 is defined as secondary roads, category 3 is defined as branches, and category 4 is a mixed road network composed of the mentioned three types of roads.
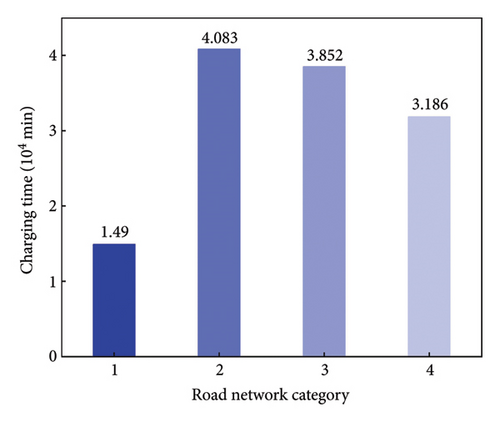
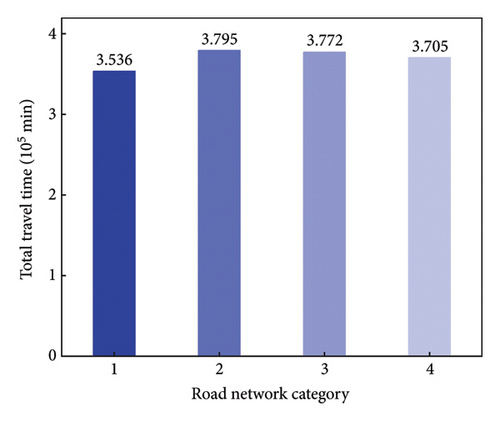
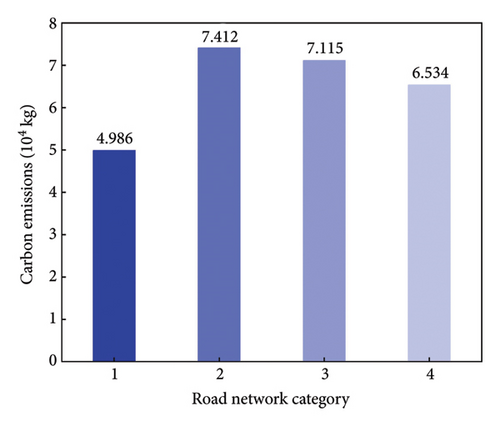
It is found from Figure 9 that the charging time, total travel time, and carbon emissions for category 1 are significantly lower than those for other categories. The charging time of category 4 is 113.83% higher than category 1, but 21.96% and 17.29% lower than category 2 and category 3, respectively. The total travel time of category 4 is 4.78% higher than category 1, but 2.37% and 1.77% lower than category 2 and category 3, respectively. The carbon emission of category 4 is 31.04% higher than category 1, but 11.84% and 8.16% lower than category 2 and category 3, respectively.
3.2.2. α∗ − β∗
The impact of safe remained electricity α∗ and desired charging electricity β∗ on travel time and energy consumption is analyzed, assuming a market penetration rate of 50% for EV in the test network.
The charging time is lower with low safe remained electricity and reaches its highest with medium safe remained electricity, as shown in Figure 10. If β∗ = 80%, the charging time is significantly higher than that of β∗ = 70%. As shown in Figure 11, if β∗ = 70%, the total travel time with low safe remained electricity decreases by 0.57% and 0.43% (α∗ = 1%) compared to medium (α∗ = 3%) and high (α∗ = 5%) safe remained electricity values. If β∗ = 80%, the total travel time with low safe remained electricity decreases by 0.64% and 0.51% (α∗ = 1%) compared to medium (α∗ = 3%) and high (α∗ = 5%) safe remained electricity values. In addition, the total travel time with β∗ = 80% is significantly higher than β∗ = 70%.
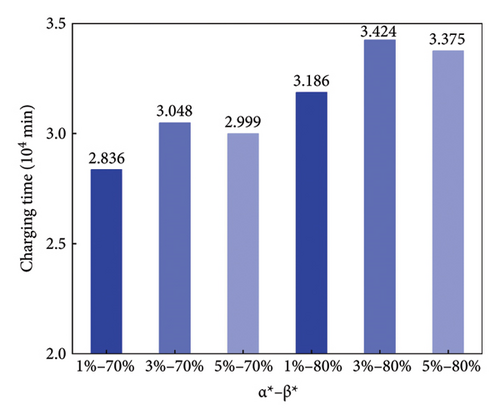
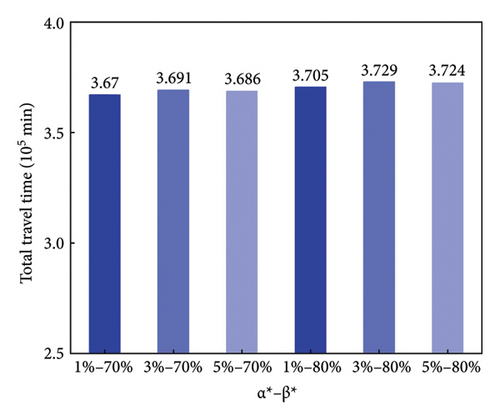
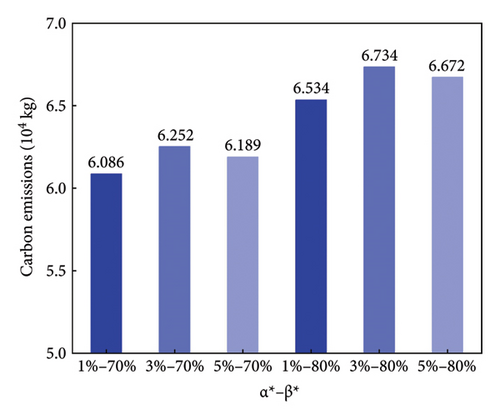
Figure 12 compares carbon emissions considering α∗ and β∗. It is observed that carbon emissions are lower with low safe remained electricity compared to medium and high remained safe electricity values. If β∗ = 70%, the carbon emissions with low safe remained electricity decreases by 2.66% and 1.66% compared to those of medium and high safe remained electricity values respectively. If β∗ = 80%, the carbon emissions with the low safe remained electricity are 2.97% and 2.07% lower than those of medium and high safe remained electricity values respectively. Furthermore, the total carbon emissions with β∗ = 80% is significantly higher than that of β∗ = 70%.
3.3. Comprehensive Analysis
This paper focuses on analyzing the impact of risk perception, perception time error, SOC, and road degree on vehicle path selection and charging behavior. Risk perception has a significant impact on the path selection of EVs, who tend to choose paths with charging stations. In addition, risk perception and SOC can affect EVs’ choice of charging stations. The type of road has a significant impact on the traffic flow of the road network, and the fuel consumption and carbon emissions generated by vehicles driving on main roads are lower than those on secondary roads and branch roads. We further studied the impact of charging station location on the road network. When changing the location of a charging station, the total travel time decreased by 0.2%, the total carbon emissions decreased by 1.85%, and the balance of charging station utilization decreased by 0.95%. From this, it can be seen that the reasonable deployment of charging stations can optimize the efficiency and energy consumption of road network traffic operation. The research is helpful for determining the locations of charging piles and designing road networks, and it is also helpful for estimating the traffic flow and carbon emissions.
4. Conclusion
The paper develops a mixed equilibrium model to assess the impact of EVs on traffic assignment, considering the risk perception, perceived time deviation, and initial battery state for travelers. Additionally, a carbon emission model is built up based on traffic assignment to estimate CO2 emission in the network. Two test cases are used to analyze the impact of EVs characteristics on the network with sensitivity analyses conducted for road type, safe remained electricity, desired charging electricity, and risk perception. The findings indicate that EVs will increase the total travel time in the road network, as they tend to choose paths with charging piles. The travel time of the road network has increased by 27%. The location of charging state and the user’s risk perception affect vehicle routing decisions. After we changed the location of a charging station, the total travel time has decreased by 0.2%, the total carbon emissions have decreased by 1.85%, and the balance of charging station utilization has decreased by 0.95%. Moreover, road type and average speed are important factors affecting carbon emissions. The charging time of mixed network is 113.83% higher than main road, but 21.96% and 17.29% lower than secondary and branch roads, respectively.
Existing research primarily focusses on a static road network, often virtual rather than real-life networks. Future research could explore charging strategies and traffic assignment in dynamic traffic flow networks using actual real-life data. In addition, considering users’ uncertainty in travel time, a hybrid stochastic user equilibrium model could be adopted for further investigation. In parallel, the analysis of charging station optimization could improve the road traffic efficiency and mitigate the EV users’ psychological “charging anxiety” in the future.
Conflicts of Interest
The authors declare no conflicts of interest.
Author Contributions
Z.Z.: formal analysis; investigation; writing–original draft; writing–review and editing. W.H.: conceptualization; funding acquisition; methodology; project administration; resources; supervision; methodology. Y.G.: software; validation; visualization. W.W.: methodology. Y.C.: writing–review and editing; S.L.: software, validation.
Funding
This work was supported by the Science and Technology Innovation Program of Hunan Province (2023SK2052, 2023RC1059) and The Changsha Science and Technology Plan Project Funding (kq2107009, kh2301004).
Acknowledgments
This work was supported by the Science and Technology Innovation Program of Hunan Province (2023SK2052, 2023RC1059) and The Changsha Science and Technology Plan Project Funding (kq2107009, kh2301004).
Open Research
Data Availability Statement
The data used to support the findings of this study are available from the corresponding author upon request.


