Improving Container Port Efficiency: A Data-Driven Model for Optimizing Truck Arrival Appointments Through Distributionally Robust Optimization
Abstract
The irregular arrival patterns of container trucks at ports have a substantial impact on logistics operations’ efficiency, resulting in congestion during peak hours and unused port capacity during idle times. Implementing a truck appointment system (TAS) is vital to address this issue effectively. This paper suggests enhancing the TAS by adopting a data-driven approach using terminal gate data to understand the intricate and uncertain relationship between truck arrival patterns and port operational efficiency. Insights gained from these data are utilized to develop a distributionally robust optimization (DRO) model. This model provides an exact solution for optimizing the appointment quota plan of TASs, thereby improving port efficiency and addressing operational challenges. Compared to existing methods, this approach does not heavily rely on theoretical assumptions concerning the cooperation mechanisms among trucks, yard equipment, quayside equipment, and other facilities and fully considers the complex uncertainties in truck arrivals. Furthermore, to examine the effectiveness of the proposed model, a case study is conducted at Yan Port, China, aiming to achieve practical results. The numerical experiments comparing its performance with the conventional robust optimization (RO) model confirm the superiority of the proposed DRO model in minimizing the total truck turnaround time within the terminal and overall time expenses. This superiority stems from its integration of the respective advantages of stochastic optimization (SO) and traditional RO methods. By optimizing the appointment quota plan in this manner, it achieves a balanced distribution of truck arrivals, showcasing its significant potential to enhance port logistics efficiency.
1. Introduction
In recent years, the growth of containerized trade has caused a notable increase in container transport volumes at ports worldwide. Within the container logistics domain, accelerating the turnaround time of container trucks at terminals is crucial for improving overall operational efficiency. However, the irregular timing of truck arrivals presents a significant challenge to logistics operations efficiency in ports. This challenge is particularly pronounced during peak arrival hours, causing queuing congestion and prolonged waiting time before operations can commence, resulting in delays and inefficiencies in container operations. In addition, it leads to underutilization of port operational capacity during idle periods.
One potential solution to alleviate these challenges is the adoption of a truck appointment system (TAS) to manage the arrival patterns of container trucks at ports [1]. By assigning scheduled arrival time to each truck, the TAS has the potential to reduce congestion and enhance terminal efficiency by regulating the distribution of arrival time for container trucks [2]. However, the effectiveness of the TAS relies heavily on devising an appropriate allocation of appointment quotas for each time slot. Therefore, formulating a robust strategy to determine an optimal appointment quota plan is critical for the seamless and efficient operation of the TAS within the port, highlighting the need for research in this area.
Many studies have tackled the optimization problem of appointment quotas, but most of these studies heavily rely on theoretical assumptions concerning intricate truck operations at terminals. These assumptions encompass factors such as truck travel time within ports [2–6], operational costs of trucks at container yards [2, 3, 7], and the coordination among trucks, yard-side and quayside equipment, and other facilities [3–5, 7–9]. However, aligning these assumptions with the intricate and dynamic nature of container truck operations at ports is challenging and may lead to potential inaccuracies. The following literature review section will delve into the nuances of these unrealistic assumptions in prior research. Furthermore, without real-world data to guide them and reflect the true complexities of truck operations at terminals, these prior approaches often struggle to address uncertainties related to truck arrivals and operational processes. This limitation can result in a suboptimal appointment quota plan.
This study aims to address the existing limitations by proposing a data-driven approach that integrates terminal gate data with a distributionally robust optimization framework (DRO) to optimize the appointment quota plan in the TAS. Specifically, the proposed data-driven approach offers advantages in its simplicity and practicality, requiring fewer parameter estimations and avoiding reliance on assumptions about the cooperation mechanisms among container trucks, yard equipment, and quayside equipment [10]. Instead, it focuses on the causal relationship between truck arrival patterns (inputs) and their total turnaround times (outputs) within the port, effectively utilizing terminal gate data to uncover these patterns. These insights are seamlessly incorporated into a streamlined yet effective optimization model for appointment quota planning. Unlike traditional approaches, this data-driven approach does not attempt to replicate every operational detail for the trucks. It eliminates the needs for extensive parameter calibrations or unrealistic assumptions, greatly reducing the model complexity while enhancing both robustness and realism. In addition, by embedding this data-driven model within a DRO framework, the resulting appointment quota plan for the TAS not only prioritizes efficiency but also demonstrates resilience to the inherent uncertainties in truck arrival processes. Therefore, the practical significance of the current study’s contributions is profound. The shift toward a data-driven framework not only strengthens the theoretical underpinnings of TAS optimization but also delivers tangible improvements in its practical impact. The proposed approach bridges the gap between advanced modeling techniques and their real-world implementation, enabling port organizers to make well-informed decisions in dynamic and uncertain environments.
The remainder of this paper is organized as follows: Section 2 provides a concise overview of existing studies concerning the appointment quota optimization problem. Section 3 outlines the overall theoretical framework proposed in this study. Section 4 details the formulation of the data-driven DRO model, with its solution presented in Section 5. To assess the efficacy and validity of the proposed approach, we conducted a numerical experimental analysis in Section 6. This analysis involves a comparison of the results of the proposed model with those obtained from alternative optimization model. In Section 7, we concluded the findings of this study, acknowledging its limitations, and outlining potential avenues for future research.
2. Literature Review
2.1. Optimizing Appointment Quota Plans in TASs
TASs play a crucial role in minimizing congestion and waiting time for trucks at terminals. However, a primary challenge faced by these systems is optimizing the number of appointment quotas for per time slot, as this directly influences the arrival patterns of container trucks, thereby shaping TAS performance. In recent years, various approaches have emerged to address this issue, broadly falling into three categories: queuing theory-based approaches, mathematical modeling–based approaches, and simulation-based approaches.
2.1.1. Queuing Theory–Based Approaches
Queuing theory has played a fundamental role in optimizing appointment quota plans, with various queuing theory–based approaches being utilized. These approaches include the nonstationary M(t)/E-k/c(t) queuing model [11], the nonstationary vacation queuing model [12], the M/M/l queuing model [13], and the two-phase queuing model [14]. While the specific model employed may vary, queuing theory–based approaches typically optimize the appointment quota plan by considering factors such as the number of truck arrivals, queue length, and overall service time.
Among these approaches, minimizing queue length has consistently been identified as a critical objective in achieving optimal appointment quota plans, as highlighted in prior studies. However, queue length is influenced by various factors that can differ significantly across ports, such as the arrival pattern of container trucks, the number of operational equipment, and liner schedules. This diversity of influencing factors makes it challenging to accurately estimate their impact within the models. Consequently, ensuring that the assumptions made in previous works accurately reflect the reality of the problem is not a straightforward task.
2.1.2. Mathematical Modeling–Based Approaches
Mathematical modeling has been employed as another avenue to optimize appointment quota plans, with various models addressing different aspects ranging from minimizing truck waiting time to considering internal terminal operational efficiency. For instance, Yi, et al. [15] developed a scheduling model to optimize appointment quota plan for the TAS, aiming to minimize trucks’ waiting time at terminals. Other scheduling models have also considered performance indicators related to terminal operations, such as container positioning in stacks [16], crane productivity [17], and yard crane allocation [8].
Apart from scheduling models, the previous research has treated the appointment quota plan optimization problem as a variation of optimizing truck arrival distribution [7, 18]. However, despite the mathematical models developed in these studies, numerous assumptions were necessary. For example, Gracia et al. [3] assumed known travel time and operation time of container trucks and utilized data-mining technology to assign arriving trucks to tuples, constructing a mixed-integer programming (MIP) model with a biobjective function for tuple assignment. Phan and Kim [5] assumed the gate queuing system could be approximated with a pointwise stationary fluid flow approximation (PSFFA) model, establishing a decentralized decision-making model composed of a primal model for different trucking companies and a dual model for the port. Li et al. [8] assumed Erlang distribution for yard crane service time, fitting an M/Ek/c queuing model based on this distribution, and built a biobjective integer model solved with a nondominated genetic algorithm to allocate appointment quotas and yard cranes simultaneously. Duan et al. [19] established a two-stage MIP model that minimizes the number of relocations, and the number of yard crane moves under the maximum appointment quota, while dynamically adjusting the upper limit of the appointment quota for each block. Huang et al. [20] developed a mixed-integer linear programming model and improved the existing genetic algorithm by introducing a topology sorting specifically designed for this problem.
However, a significant issue with these assumptions is their limited alignment with real-world conditions, which can vary across different ports. In addition, an increasing number of assumptions pose challenges in achieving accurate solutions that mirror actual port conditions.
2.1.3. Simulation-Based Approaches
Simulation-based approaches often utilize discrete-event models (DEM) to simulate truck arrivals and departures, evaluating the effectiveness of various appointment quota policies. For instance, Li et al. [21] employed a discrete event simulation model to depict detailed truck and equipment operations under different disruption levels, devising strategies to handle these disruptions effectively, and identified an optimal response strategy to maintain high resilience in the face of disruptions. Similarly, Azab, et al. [22] used a DEM to simulate operations in landside, yard area, and seaside, estimating queue lengths and truck turnaround time. They employed a MIP model to reallocate appointment quotas to reduce congestion by iterating the DEM and MIP models while considering stochastic yard and gate operations. Bett et al. [23] amalgamated discrete event simulation (DES) with MIP to construct an integrated model, employing iterative optimization techniques to culminate in the development of TAS. Although these approaches can assess the performance of the TAS under diverse scenarios, they often entail high computational costs in large-scale scenarios and may not consistently yield optimal solutions.
2.2. Optimization Objectives in TAS
Reducing carbon emissions from container trucks is a critical objective in fostering the sustainable development of green ports. As ports play a central role in global supply chains, addressing environmental concerns has become increasingly important. Previous studies have demonstrated a strong positive correlation between container truck exhaust emissions and their turnaround time within ports [24]. Longer turnaround times result in prolonged idling, increased fuel consumption, and higher emissions, highlighting the urgency of minimizing truck turnaround time as a pivotal strategy for achieving greener port operations [2]. In this context, TASs are instrumental in reducing total turnaround times by effectively managing the distribution of truck arrivals. Through optimized scheduling, the TAS can alleviate congestion, improve operational efficiency, and indirectly contribute to a significant reduction in emissions. Consequently, a substantial body of research has focused on using turnaround time as the primary objective function when designing and optimizing appointment quota allocation plans [9, 25]. By aligning truck arrivals with the operational capacity of ports, these models aim to streamline processes and reduce delays, directly supporting environmental sustainability goals.
Furthermore, within the framework of the TAS, the reassignment of appointment quotas adds a layer of complexity, particularly in terms of its impact on truck companies. Adjustments to the appointment quota plan may require container trucks to modify their preferred arrival time to comply with the maximum quota constraints. Such changes can disrupt schedules, increase operational costs, and potentially lead to inefficiencies for truck companies. To address this issue, optimization models must make a balance between minimizing turnaround times and reducing the disruption caused by these adjustments. To achieve this balance, many studies have incorporated penalty costs into their optimization frameworks [3]. These penalty costs represent the impact of changes in a truck’s originally preferred arrival time compared to its newly assigned time slot. Controlling such discrepancies ensures that the interests of truck companies are considered, fostering better cooperation between port operators and logistics providers. Therefore, considering this in TAS optimization models is critical for achieving a harmonious balance between environmental goals, operational efficiency, and stakeholder satisfaction.
2.3. Addressing Uncertainty in Port Operations
Uncertainty is an intrinsic characteristic of port operations, stemming from their highly dynamic and complex nature. The unpredictability of factors such as travel time, equipment handling time, and operation schedules poses significant challenges to achieving operational efficiency. To address this, previous studies have often sought to model the uncertainty of travel and operation time through specific probability distributions, such as normal, exponential, or Erlang distributions [4, 5, 26]. These studies have provided valuable insights into the variability of port operations, offering foundational approaches for incorporating uncertainty into decision-making frameworks [21]. While these approaches have laid the groundwork for understanding and addressing uncertainty, the more they attempt to reflect the real operational process, the more refined the modeling needs to be, leading to increased complexity, and thus, a greater number of parameters. Many of these parameters are still based on assumptions or limited data, and such parameters may not capture the full complexity of actual port environments, potentially leading to model inaccuracies.
The advent of advanced information technologies has revolutionized the way uncertainty is approached in port operations. With the increasing availability of large volumes of real-time data from port systems, data-driven methods are now emerging as powerful tools to bridge the gap between data availability and effective decision-makings. These approaches harness the richness of real-world data to improve the accuracy and reliability of models, offering a more nuanced understanding of operational uncertainty. For instance, Li et al. [8] utilized real data to model yard crane service time, demonstrating that they follow an Erlang distribution. This study highlighted the potential of real data to enhance the realism of operational models. Nevertheless, these approaches primarily leverage real-world data to refine the estimation of parameters that previously relied on theoretical assumptions. However, they remain confined to the original modeling framework and do not reduce the complexity of the optimization model.
In contrast, Sun et al. [27] used terminal gate data to establish a stochastic regression relationship between truck arrivals and total turnaround time at a terminal. This relationship was incorporated into a robust optimization (RO) model to develop an appointment quota plan for the TAS. The main contribution of this study lies in proposing a novel data-driven modeling framework distinct from traditional methods. Instead of simply utilizing the real-world data to fine-tune parameters within the traditional framework, it integrates insights derived from the terminal gate data directly into the optimization process, significantly simplifying the model. While this approach marked significant progress, it leveraged only a portion of the information contained in the uncertainty set derived from terminal gate data. As a result, the model did not fully exploit the data’s richness, potentially limiting its scope and effectiveness.
2.4. Limitations in Previous Studies and Research Motivations of This Study
Traditional methods for optimizing truck appointment quota plan in TASs, such as queuing theory, mathematical optimization, and simulation-based approaches, often rely on simplifying assumptions about model parameters. For instance, truck arrivals are typically modeled using beta or Poisson distributions, often neglecting the impact of port congestion. Nonstationary queuing theory is frequently used to estimate queue lengths, assuming yard crane service times follow an Erlang distribution. In addition, many studies consider truck turnaround time within the terminal as predetermined values, which oversimplify the complexities of real-world port operations and undermine model accuracy. As port environments grow increasingly complex, these methods require even more assumptions, further limiting their applicability. In addition, uncertainties such as travel and operation time are often inadequately addressed in these studies, depending on rigid probability distributions or assumptions that fail to reflect the variability and complexity inherent in actual port environments.
Advancements in Information and Communication Technology (ICT) have facilitated the use of data mining technology to improve TAS’s performance, offering benefits on two levels. At the foundational level, data analysis results capture characteristics and uncertainties in truck arrivals and operations, enabling more accurate calibration of model parameters that previously relied on assumptions in traditional modeling frameworks. At a higher level, real-world data insights are directly incorporated into the optimization model for appointment quota plans. Unlike traditional methods that attempt to model every detail of truck operations, this approach maintains the integrity of the “black box”, focusing only on the input–output relationship. By avoiding assumptions for each parameter, the model is simplified, significantly reducing the computational complexity. However, despite the vast amount of real-world data available from ports, most studies have only utilized a small portion of this information. For example, while Sun et al. [27] used terminal gate data to model the relationship between truck arrivals and turnaround time, the full potential of the data within uncertainty sets remains underexplored in their RO model, limiting its effectiveness and scope.
This study aims to bridge these gaps by developing a data-driven optimization framework that fully leverages available terminal gate data through a DRO model. Unlike traditional RO methods, such as those used by Sun et al. [27], and stochastic optimization (SO) methods, the DRO does not rely on a single predefined probability distribution. Instead, it considers a range of potential distributions within an uncertainty set, maximizing the value of information within these sets. This flexibility allows the model to more effectively capture the inherent variability of truck arrivals in port operations. As a result, the DRO strikes a balance between robustness (resilience to uncertainty) and optimality (achieving the best solution), leading to appointment quota plans that are both adaptable to uncertainty and highly efficient in performance.
3. Problem Description and Theoretical Framework
3.1. Problem Description
A TAS typically divides a day into multiple time slots, each spanning one or more hours. The primary goal of implementing a TAS at a port is to manage and regulate the arrival patterns of trucks within these time slots using an appointment quota plan. This plan establishes the maximum number of appointment quotas for each time slot, thereby capping the number of truck arrivals and distributing them more evenly throughout the day. To enter the port, each truck must secure an appointment for a specific time slot in advance. Consequently, designing an optimal appointment quota plan is crucial to ensure the effectiveness and efficiency of a TAS. Accordingly, the primary objective of this study is to determine the optimal allocation of appointment quotas for each time slot. To accomplish this, two subproblems must be addressed.
First, the underlying logic of how an appointment quota plan affects port operations is as follows: The plan sets a cap on the maximum number of truck arrivals for each time slot. Trucks schedule specific appointments and arrive at the port according to these quota constraints. This, in turn, affects the actual distribution of truck arrivals, which directly impacts the operational efficiency of the port. This efficiency is measured through indicators such as the turnaround time for trucks at the port. Therefore, from an optimization perspective, indicators such as the total truck turnaround time at the port should be minimized to identify the optimal distribution of truck arrivals. This optimal distribution can then serve as a guide for designing an effective appointment quota plan. To achieve this, the first step is to establish a clear relationship between the distribution of truck arrivals and port operational efficiency, using the insights derived from real-world data.
However, the relationship between truck arrival distribution and operational efficiency is often uncertain rather than deterministic. In addition, while this relationship can be utilized to determine the optimal number of truck arrivals for each time slot by minimizing efficiency metrics such as total turnaround time, the next challenge is to translate these optimal truck arrival numbers into appropriate upper bounds for appointment quotas in the plan. Therefore, a typical Min–Max optimization model is employed to achieve the optimal upper bounds. Given the stochastic nature of this relationship and the Min–Max optimization framework, the focus shifts to developing a DRO model to address the challenge, offering a comparison with traditional RO models.
Overall, the decision variable in the optimization model is the number of appointment quotas allocated for each time slot, which collectively form the appointment quota plan. The objective of the model is to minimize the total turnaround time of trucks at the port. To establish the connection between the appointment quota plan and the total turnaround time, it is assumed that the truck turnaround time at a specific time slot is primarily influenced by the number of truck arrivals during that time slot. However, this relationship may be not deterministic but rather stochastic, and it needs to be further explored and validated in this study. Therefore, the optimization process must account for this uncertainty and adopt an appropriate modeling framework. Moreover, while the shortest total truck turnaround time serves as the optimal objective function from the port’s perspective, reflecting its overall decision-making interests, the study also incorporates a constraint to control the deviations between the original quota plan and the new plan. This ensures that the truck arrival distribution can only be adjusted within a certain range, thereby balancing the rights of the truck companies. The specific details of the other constraints and assumptions are presented in the model establishment section.
3.2. The Overall Theoretical Framework
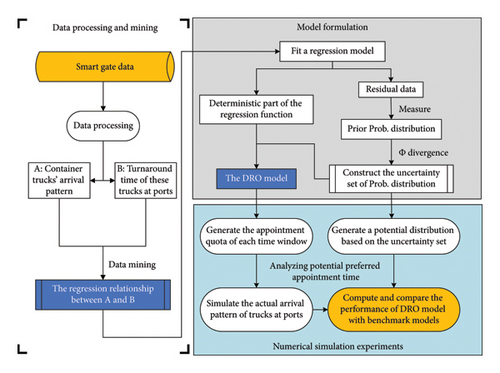
- 1.
Step 1: Data processing and mining
-
In the initial phase, data mining techniques are employed to analyze terminal gate data collected from ports. The goal is to extract valuable insights regarding truck arrival patterns and turnaround times and to explore the regression relationship between them. Subsequently, the residuals of the obtained regression relationship are used to construct a dataset, which helps evaluate and quantify the uncertainties associated with predicting total turnaround time based on container truck arrival patterns at ports.
- 2.
Step 2: Appointment quota plan optimization model
-
The second phase involves constructing a model for optimizing appointment quotas within a DRO framework. Using the regression relationship and residual dataset from the first phase, a DRO model is developed to address uncertainties and optimize the number of appointment quotas for each time slot. The objective is to minimize the worst-case total turnaround time for trucks, predicted based on the anticipated truck arrival patterns.
- 3.
Step 3: Validation of the data-driven DRO model’s effectiveness
-
In the final phase, numerical experiments are conducted to validate the effectiveness of the proposed model. The performance of the data-driven DRO model is compared with that of conventional RO methods. This comparison demonstrates the effectiveness of the approach in optimizing appointment quotas at ports and evaluates whether it outperforms other optimization methods.
4. The Formulation of the Data-Driven DRO Model
4.1. Data Processing and Mining
4.1.1. Terminal Gate Data
Terminal gate data are typically collected during the operational process of container trucks at ports. When a truck arrives, the gate system records essential details such as its arrival time and container information. The trucks then queue in the yard for loading or unloading operations. Once these operations are complete, the trucks exit the port, and the gate system records their outbound time. The recorded parameters form the terminal gate dataset, which includes the precise inbound and outbound time of the trucks and their container information. Table 1 presents the structured layout of the recorded parameters.
| Data field | Descriptions |
|---|---|
| Truck_ID | ID of the truck |
| Truck_gate_in_time | The datetime when the truck entered the gate |
| Truck_gate_out_time | The datetime when the truck existed from the gate |
4.1.2. Data Processing
- •
Step 1: One day is segmented into 24 1 h appointment windows.
- •
Step 2: The number of inbound container trucks for each time period is calculated based on the gate-in time of the trucks from the terminal gate data. Specifically, the inbound container truck count for the jth time slot is denoted by Nj, where represents the ith truck that arrived at the terminal during the jth time slot.
- •
Step 3: The total turnaround time of Nj at the port is calculated as follows:
()() - •
where is defined as the turnaround time of at the terminal, and , respectively, represent the time when the truck exits and enters the terminal, and Tj is denoted as the actual total turnaround time of Nj, referring to the total turnaround time of the container trucks arriving at the port during the jth time slot.
4.1.3. Data Mining
It is clear that as the number of truck arrivals in a specific time slot increases, the total turnaround time of these trucks at the port will also rise. However, this relationship is not linear. Initially, when the port’s operational capacity is underutilized, it can handle truck operations efficiently, with each truck consuming nearly the same turnaround time. As truck arrivals grow, the port becomes more congested, leading to increasing delays and a more significant rise in the average turnaround time of these trucks. Thus, the relationship between truck arrivals at each time slot and their total turnaround time at the port should exhibit a nonlinear relationship with an increasing slope. This reflects how congestion intensifies as the number of arrivals grows, gradually increasing the average turnaround time for each truck as the port’s capacity becomes strained. To capture the relationship between the arrival distribution of container trucks and their turnaround time at ports, a regression model is constructed using the results of terminal gate data processing.
4.2. The Establishment of a Traditional RO Model for Appointment Quota Optimization
4.2.1. Theoretical Settings for Modeling
- •
Setting 1: Each container truck entering the terminal is required to make an appointment in advance via the TAS for operational purposes.
- •
Setting 2: The day is divided into 24 discrete time slots, each representing one hour. The appointment quota plan requires determining the number of quotas allocated for each time slot.
- •
Setting 3: It is assumed that the total daily appointment quotas remain unchanged before and after the plan optimization.
4.2.2. Establishment of the Traditional RO Model
Building upon the previous study of Sun et al. [27], an initial optimization model based on a traditional RO approach is presented below, with notations detailed in Table 2. The purpose of introducing this initial model is two-fold: First, it provides a foundational framework for the development of the DRO model; second, the outcomes from this model serve as a benchmark for comparison against the results of the developed DRO framework.
| Notations | Descriptions |
|---|---|
| Indices | |
| i, j | Time slot i, j; there are 24 one-hour appointment windows within a day |
| Variables | |
| Tj | The total turnaround time of the trucks arriving at time slot j, predicted by the obtained regression relationship Tj = f(Nj) + εj |
| Nj | The number of truck arrivals at time slot j |
| NNj | The optimized number of quotas at time slot j |
| Decision variable | |
| mij | The number of quotas transferred from time slot i to time slot j |
| Parameters | |
| εj | The regression residual when Nj is input |
| The prior values of εj when Nj is input, derived from the regression results of the empirical study using historical data, together constitute the dataset Oj | |
| nj | The original number of quotas at time slot j before optimization |
| M | A specific large integer |
| Datasets | |
| Oj | The dataset of , obtained from historical regression residuals at time slot j |
| Z | The set of integers |
Here, the primary goal of equation (4) is to minimize the total turnaround time for trucks at the port, where the total turnaround time can be inferred based on the obtained function in equation (3). This objective is well justified, as the total turnaround time of trucks is widely recognized as a crucial metric for assessing a port’s efficiency in handling truck operations. Thus, it directly reflects how effectively an appointment quota plan in the TAS manages truck arrivals and optimizes the ports’ operational performance. Furthermore, to address the inherent uncertainties in trucks’ total turnaround time, this study adopts a Min–Max approach within a traditional RO framework, as reflected in equation (4). Therefore, this study aims to minimize the trucks’ total turnaround time under the extreme or worst-case scenarios to develop a robust and optimal appointment quota plan for trucks. More detailed reasons are as follows.
This further illustrates why the traditional SO methods are not well-suited for this problem. SO methods typically focus on estimating and minimizing the expected total turnaround time of trucks to achieve the optimal expected truck arrivals for each time slot j. However, accurately utilizing these expected results to determine the optimal upper bound for truck arrivals in each time slot j is highly complex and challenging. As a result, SO methods are often impractical in this scenario. In comparison, the traditional RO method employs the Min–Max approach to provide a more practical and effective solution, as shown in equation (11).
Regarding the other model constraints, the transfer of quotas from time slot i to time slot j, represented as a decision variable mij, enables quick computation of the optimization quota results NNj based on the initial appointment quotas, as shown in equation (8). Moreover, this variable mij is defined as an integer, including zero, and can take positive or negative values. The total number of appointment quotas is assumed to remain constant before and after the optimization process (equation (9)). However, if the model prioritizes only the port’s interests by focusing solely on minimizing the overall truck turnaround time, it may lead to substantial changes in container truck arrival patterns compared to the original plan. Such changes could disrupt the operational schedules of specific trucking companies and ultimately lower the overall service level at the port. To address this issue, equation (10) is introduced to ensure that the optimized appointment quota plan does not deviate greatly from the initial plan. That is, truck arrival time slots can only be adjusted within a certain range, then maintaining port service quality and balancing users’ rights. Specifically, the left side of the inequality in equation (10) calculates the sum of quota transfers, weighted by the number of time slots crossed during the transfer. This term quantifies the degree of redistribution caused by the optimization process relative to the initial plan. The constant M on the right side of the inequality acts as a control parameter to limit the extent of this redistribution.
4.3. The Establishment of a DRO Model for Appointment Quota Optimization
Although the traditional RO model employing the Min–Max approach provides a robust and effective solution for the designing appointment quota plans, it is overly conservative. This conservatism arises because the RO model focuses solely on optimizing under the worst-case scenario for the trucks’ total turnaround time. Specifically, in relation to equation (7), if the worst-case scenario occurs, the number of trucks arriving during each time slot must reach the upper limit of the appointment quotas. Simultaneously, the variable εj, representing the influence of other factors on trucks’ total turnaround time at the port, must take the highest value (max ) observed historically. While the former condition is relatively more likely to be met in real-world scenarios, the latter often leads to an overestimation of the uncertainty. Consequently, the RO model fails to capitalize on opportunities for more flexible and dynamic adjustments under less extreme conditions.
In this context, the DRO model addresses the limitations of the traditional RO approach by shifting from a worst-case scenario focus to a probabilistic framework that captures a range of plausible scenarios. Using terminal gate dataset information, the DRO model constructs a distributional uncertainty set that contains potential probability distributions, each representing different uncertain scenarios and aligning closely with the prior probability distribution of εj. By considering the likelihood and variability of these scenarios, the DRO model facilitates dynamic adjustments, striking a balance between conservatism and adaptability. This ensures robust performance against disruptions while maintaining operational efficiency. With its data-driven foundation, the DRO model provides practical, real-world solutions that are more flexible and effective than the overly cautious outcomes of the RO approach. The formulation of the DRO model is as follows, accompanied by a detailed explanation of how it differs from the traditional RO model.
The equations (5), (8)–(10) are constraints, as same as those in the RO model.
The additional notations introduced in the DRO model, compared to the RO model, are summarized in Table 3, while the remaining notations retain the same definitions as provided in Table 2. Building on the objective function of the RO model, as shown in Equations (11), (12) presents the objective function for the DRO model. This formulation also employs a Min–Max approach, aiming to minimize the total turnaround time of trucks at the port. The key distinction lies in the treatment of εj, which represents the impact of external factors such as weather, mechanical failures, and other disruptions on truck turnaround time. Unlike the RO model, which directly considers the extreme impact of εj, leading to its overly conservative nature, the DRO model adopts a more balanced approach, mitigating this conservatism by accounting for a range of plausible scenarios rather than single worst-case scenario. As specifically reflected in equation (12), the DRO model departs from the RO model’s reliance on the historically observed worst-case values of εj. Instead, the DRO model focuses on the expected values of εj across a range of different but possible scenarios, denoted as E(εj). The model then evaluates the worst-case scenario for E(εj), incorporating it into the optimization. This approach allows the DRO model to strike a balance between robustness and flexibility by taking in to account of a broader distribution of potential impacts rather than fixating on a single extreme value.
| Notations | Descriptions |
|---|---|
| Additional decision variable | |
| The probability of εj taking values from the kth interval of dataset Oj, k = 1, 2, 3, …, K, considering all the potential distributions. This variable is subject to uncertainty in our model and requires determination | |
| Additional parameters | |
| E(εj) | The expected value of εj |
| The expected value of εj when it falls within the kth interval of dataset Oj, k = 1, 2, 3, …, K. This metric is defined in this study as the average value of from the kth interval of dataset Oj | |
| The prior probability of εj taking values from the kth interval of dataset Oj, k = 1, 2, 3, …, K. This metric is derived from the regression results of the empirical study using historical data | |
| K | For a given dataset Oj, the values inside it are sorted in ascending order and then divided into K intervals with equally spaced values. The length of each interval can be computed by |
| ρj | The maximum discrepancy between and ; this value is determined by the dimension of Oj and the confident level that use to approximate |
| Function | |
| ϕ(x) | The function of Φ divergence used to measure the differences between two probability distributions |
| Additional datasets | |
| Oj | The dataset of , obtained from historical regression residuals at time slot j. For a given dataset Oj, the values inside it are sorted in ascending order and then divided into K intervals with equally spaced values |
| Uj | The uncertainty set of . This set describes all the potential values of through determining the maximum discrepancy between and |
E(εj) is obtained by considering the prior values of εj and the associated probabilities of these values occurring, as illustrated in equation (13). Here, Oj is denotes as the dataset of , which represents the prior values of εj, obtained from historical regression residuals at time slot j. The values inside Oj are sorted in ascending order and then divided into K intervals with equally spaced values. is defined in this study as the average value of from the kth interval of dataset Oj, k = 1, 2, 3, …, K; this value is used to denote the expected value of εj when it falls within the kth interval. represents the probability of εj falling within the kth interval of dataset Oj, considering all the potential distributions.
However, is always unknown and must be estimated based on the prior probability of εj, denoted as . To construct the uncertainty set for , this study employs the discrepancy-based method given in [30] to measure the difference between and , denoted as , and constrains the potential probability to be close to the prior probability within a maximum discrepancy ρj, as shown in equation (14). In this study, the Φ divergence function proposed in [28] is adopted to define , where ϕ(x) is a known function determined by different definitions of Φ divergence, as specified in equation (15). Moreover, the maximum discrepancy ρj is calculated by using equation (16), where B denotes the sampling size, represents the Chi-square distribution, dj is the dimension of , and α is the confidence level of the uncertainty set [29]. Finally, equations (17) and (18) constrain that the probability cannot be negative and that the sum of probabilities across all intervals must equal 1. The remaining constraints are consistent with those defined in the RO model.
4.4. The Establishment of the Lagrange Dual Model for the DRO Model
The large-scale nature of dataset Uj introduces an infinite number of potential scenarios for , making the proposed DRO model a semi-infinite programming (SIP) problem. As a result, directly obtaining the optimal solution to the proposed DRO model becomes a significant challenge. The study in [30] emphasized the limitations of traditional methods, such as interior point techniques, in solving SIP problems, even when these problems exhibit convexity. To address this, it becomes essential to reformulate the SIP problem into a more manageable form. This study employed the Lagrange dual method to transform this SIP problem containing uncertain parameters, into a dual problem characterized by deterministic parameters [31]. The reformulation process is described as follows.
As a result, the dual function g(λj, ηj) establishes an upper bound for . As demonstrated in the study by Ben-Tal et al. (10), there must exist a pair of λj, ηj that satisfies . This implies that by solving the minimization for g(λj, ηj), the solution for can be obtained. Therefore, the original problem can be converted into the dual model, as demonstrated below.
The equations (14)–(19) are constraints, as same as those in the original model.
Equation (26) defines the conjugate function ϕ∗(y), where the original Φ-divergence function is characterized as a variance distance function, denoted by ϕ(x) = |x − 1|. Meanwhile, equation (27) imposes constraints on the variable’s range within the conjugate function, thereby specifying the corresponding range of uncertainty for εj in the original problem. Equations (29) and (30) present the range of λj and ηj.
By the principle of Lagrangian duality, the solution of the dual model is equivalent to that of the original problem. Moreover, the dual model is clearly an integer programming problem, making it well suited for direct and efficient resolution using mathematical solvers.
5. The Solution Results for the DRO Model
5.1. The Terminal Gate Data Used in This Study
The terminal gate data used in this study were collected from the container terminal at Yan port in China. Yan port is a significant port in southern China, with a container terminal throughput of nearly 13 million TEU in 2019. The container terminal operates 24 h a day, and the dataset used in this study encompassed the terminal gate data from March 1st to July 31th, 2019. The dataset consisted of over 2.3 million records.
5.2. The Results of the Regression Relationship
Using the terminal gate data, the number of truck arrivals and their corresponding total turnaround times for each hour over a 4-month period were analyzed, as detailed in Section 4.2. This analysis yielded a dataset of 2928 sample pairs. These samples were utilized to train a regression model designed to predict truck turnaround time at the port based on the number of truck arrivals within a specified time slot. The model was trained on data from the first 3 months, with the final month’s data reserved for performance evaluation.
5.2.1. The Training of the Regression
To train the regression model, a scatter diagram (Figure 2) was initially created to visualize the relationship between the two variables, aiding in the identification of the potential function type for the regression.
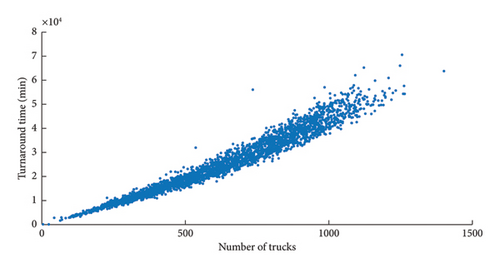
As shown in Figure 2, the relationship between the variables was observed to approximately follow a quadratic function. Consequently, EViews 10 software was used to conduct a quadratic regression analysis, with the results presented in Table 4. Notably, since the turnaround time is expected to be zero when no trucks arrive at the terminal, the constant term in the regression model was set to zero.
| Variable | Coefficient | Std. error | t-statistic | Prob. |
|---|---|---|---|---|
| 0.014243 | 0.000329 | 43.24278 | 0.00 | |
| Nj | 30.34224 | 0.284702 | 106.5756 | 0.00 |
| R2 | 0.9612 | |||
| MAPE | 0.0755 | |||
5.2.2. The Testing of the Obtained Regression Function
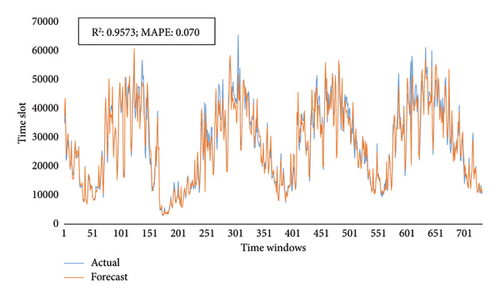
The performance of the function on the test set is presented in Figure 3, with an R2 value of 0.9573 and a MAPE value of 0.070. This indicated that the proposed regression function exhibited good generalization and could be utilized in the proposed optimization model.
5.3. Obtaining the Prior Distribution of the Residuals
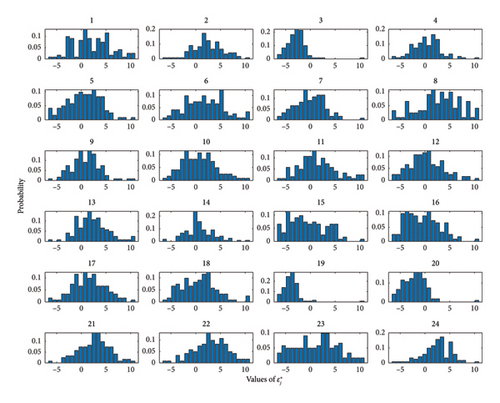
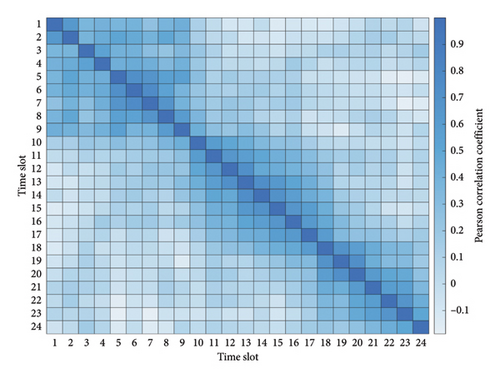
To assess the assumption of independence between the distributions of residuals across time slots, this study investigates the prior distributions of residuals for each appointment time slot throughout the 4-month period. The aim is to ascertain whether the distribution of residuals is consistent across different time slots. As depicted in Figure 4, the distributions of residual exhibit variation across each time slot. In addition, the correlations between any two distributions are investigated by analyzing the relationship in the probability of specific residuals occurring within both distributions. The results confirm the validity of the assumption about distinct residual distributions across different time slots, as shown in Figure 5.
In addition, to provide a quantitative description of the distributions of for each time slot, the range of values was divided into equally spaced intervals. In this study, the number of intervals, denoted as K, was set to 20. This choice was made after testing various values, as K = 20 ensures that each interval contains prior values in the majority of distributions. The number of values falling within each interval was then counted, enabling the computation of the prior probability . Moreover, the number of intervals that contained data were recorded to determine the dimensions of in each time slot. Finally, ρj, the maximum discrepancy between and was calculated using equation (16), with a 95% confidence level. The distribution information of in each time slot is presented in Table 5, which are used to estimate and solve the DRO model.
| Time slot | Max | Min | Dimension | ρj |
|---|---|---|---|---|
| 1 | −6.9997 | 6.7505 | 20 | 0.129 |
| 2 | −9.1694 | 10.1050 | 20 | 0.129 |
| 3 | −7.1403 | 13.0217 | 19 | 0.124 |
| 4 | −7.094 | 14.8257 | 17 | 0.113 |
| 5 | −5.6941 | 11.3706 | 18 | 0.118 |
| 6 | −7.185 | 6.8366 | 20 | 0.129 |
| 8 | −6.1032 | 7.6542 | 20 | 0.129 |
| 9 | −8.0128 | 11.3112 | 17 | 0.113 |
| 10 | −6.5133 | 5.9663 | 20 | 0.129 |
| 11 | −8.049 | 5.3282 | 20 | 0.129 |
| 13 | −9.1261 | 6.1026 | 18 | 0.118 |
| 14 | −9.0915 | 7.4552 | 16 | 0.108 |
| 15 | −6.3098 | 10.5602 | 17 | 0.113 |
| 16 | −7.0248 | 10.5418 | 17 | 0.113 |
| 17 | −8.5322 | 7.0123 | 19 | 0.124 |
| 18 | −7.3785 | 8.0159 | 18 | 0.118 |
| 19 | −6.6581 | 10.3524 | 17 | 0.113 |
| 20 | −4.7562 | 8.2297 | 19 | 0.124 |
| 21 | −7.9504 | 9.1721 | 18 | 0.118 |
| 22 | −7.1337 | 7.2428 | 19 | 0.124 |
| 23 | −3.5287 | 7.4424 | 20 | 0.129 |
| 24 | −6.2811 | 10.5078 | 18 | 0.118 |
5.4. The Model Results
5.4.1. Model Preparation
The data collected from the terminal gates of the port during the first week of July 2019 were utilized. The average number of truck arrivals during specific time slots in that week was calculated to create an initial appointment quota plan. This initial plan was then optimized using the proposed DRO model. The total number of daily appointment quotas was determined based on this initial plan.
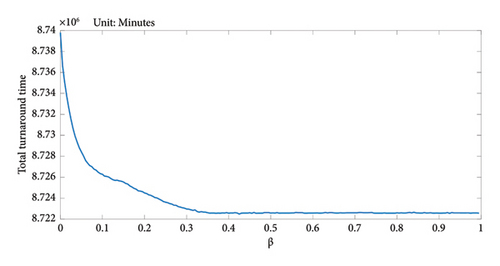
This means that, for instance, when β = 0.5, the constraint ensures that the total number of adjusted quotas does not exceed half of the total daily appointment quotas. To identify a suitable value for M, the effect of the weighting factor β on the DRO model solution is analyzed by iteratively calculating the total turnaround time for trucks under each solution across a range of β values. The results are depicted in Figure 6. It can be observed that as β increases, the total turnaround time decreases. This result is attributed to the fact that as β increases, the constraints on quota transfers become more relaxed, optimizing the system toward reducing the trucks’ total turnaround time. However, this relaxation also leads to more significant changes in quota transfers compared to the initial plan, which could substantially affect the operational schedules of specific truck companies. Moreover, it is found that when β exceeds 0.355, the constraint on quota transfers loses its effectiveness completely. Thus, to ensure the efficacy of this constraint, we set β = 0.3 in this study.
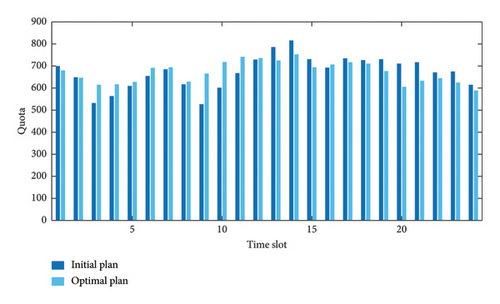
The reformulated DRO dual model, being an integer programming problem, was solved using IBM ILGO CPLEX Optimization Studio1, commonly referred to as CPLEX. The model comprises 1236 variables and 1226 constraints, and CPLEX solved it in approximately 0.3 s. As illustrated in Figure 7, the results emphasize the differences between the initial and optimized plans. The optimization process redistributed appointment quotas, shifting them from peak hours to idle hours, resulting in a more balanced allocation of quotas.
6. Numerical Experiment Analysis
6.1. Generating Truck Arrival Pattern Based on the Appointment Quota Plan
To evaluate the efficiency of the optimized appointment quota plan in minimizing the overall turnaround time for container trucks at the port, the truck arrival pattern is simulated based on the optimized plan. The simulation assumes that truck arrivals follow the appointment outcomes determined for each time slot, with the expectation that all trucks adhere to their scheduled times, excluding any potential delays.
- •
Rule 1: If the number of appointment requests for a specific time slot exceeds the allocated quota, the TAS will reject the surplus requests. These trucks are assumed to reschedule for the nearest available time slot that aligns with their preferred arrival time, provided there are unused quotas available on the same day.
- •
Rule 2: Trucks with earlier preferred arrival time are given priority when rescheduling appointments.
- •
Rule 3: If all daily quotas are fully allocated, the TAS will reassign the remaining container trucks in a way that minimizes the overall turnaround time, ensuring all the container trucks are accommodated.
- •
Rule 4: The appointment outcomes are treated as the actual arrival distribution of trucks, assuming that all trucks comply with their scheduled appointments and no delays occur.
6.2. Calculating the Total Expense of Trucks Based on Their Arrival Pattern
- •
Step 1: Set the confidence level at 95%. The parameter space of the probability vector involved in this paper is k, with a freedom degree of k − 1. is supposed to obey a Gaussian distribution , , and ξ = 1, 2.., K − 1.
- •
Step 2: Sampling by using the Gaussian distribution. If the probability returned meets the requirements of being positive, then accept it; otherwise, repeat sampling experiment until meeting the requirements.
- •
Step 3: Continue the sampling process multiple times until the desired sample size is achieved, and then add all the sampled into a set Pj, resulting in the potential values of .
6.3. Validating the Effectiveness of the Proposed DRO Model
The actual count of truck arrivals for each time slot during the first week of July 2019 is extracted from the terminal gate records. These figures are then used to represent the number of appointment requests for each time slot on the corresponding days. Following the guidelines outlined in Section 6.1 and applying the appointment quota plans shown in Figure 7, the potential truck arrival patterns are generated for both the initial and optimized appointment quota plans, as illustrated in Figure 8.
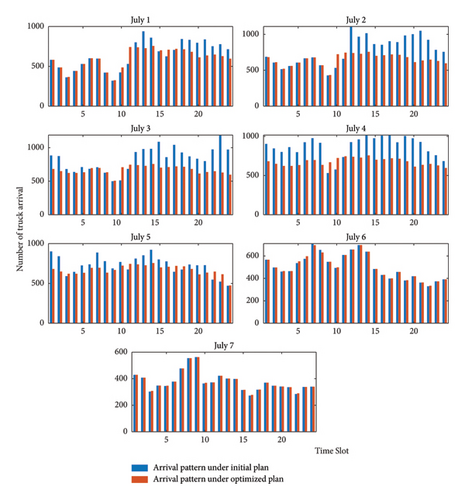
The results demonstrated that implementing the optimized plan effectively achieved a more evenly distributed pattern of truck arrivals on a daily basis. Specifically, between July 1st and 5th, the optimized plan successfully redistributed trucks that typically arrived during peak hours to adjacent time slots with fewer incoming trucks, thereby alleviating congestion during these peak periods. However, on July 6th and July 7th, the count of appointment requests was lower than the number of appointment quotas designated for the majority of time slots, leading to no changes in the arrival pattern by the optimized plan.
Then, the overall time expenses are calculated based on their arrival patterns under both the initial and optimized plans. To account for the uncertain relationship between truck arrivals and their total turnaround time at the port, stochastic scenarios are constructed and simulated, as outlined in Section 6.2. In addition, to assess the impact of sampling size on the overall time expenses, sampling sizes are varied between 10 and 1000 in intervals of 50. For each sampling size, 1000 iterations of the stochastic experiments are conducted, and the overall time expenses for each of the seven days in that specific week are calculated. The average overall time expenses, along with their range for each sampling size, are presented in Figure 9.
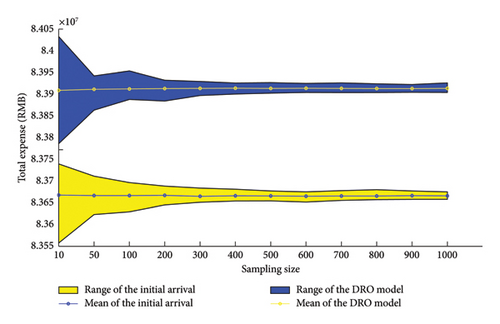
The optimized plan outperforms the initial plan in terms of average overall time expenses, demonstrating the significant optimization effect and advantages of the proposed DRO model in real stochastic environments. As the sampling size increases, the uncertainty regarding the relationship between truck arrival patterns and their total turnaround time decreases. Both the initial and optimized plans show reduced volatility in overall time expenses with larger sampling sizes. However, the sampling size does not significantly affect the average overall time expenses. The average overall time expenses based on the optimized plan remain relatively stable and yield favorable results from the outset. This suggests that even with a small sample size, the DRO model is able to quickly capture the stochastic characteristics of uncertain parameters and efficiently obtain a relatively optimal solution for minimizing overall time expenses.
6.4. The Performance Comparison Between RO and DRO Model
This study evaluates the effectiveness of the proposed DRO model by comparing its results with those from the traditional RO model. First, the RO model is used to optimize the initial plan, producing a new optimized version. Then, the truck arrival patterns are simulated based on this new plan, and the overall time expenses are calculated using a process similar to the one for the DRO model. The results, shown in Figure 10, highlight the significant impact of sampling size on model solutions and emphasize the superior performance of the proposed DRO model compared to the traditional RO model. Specifically, the DRO model leads to a reduced average total truck turnaround time and lower overall time expenses.
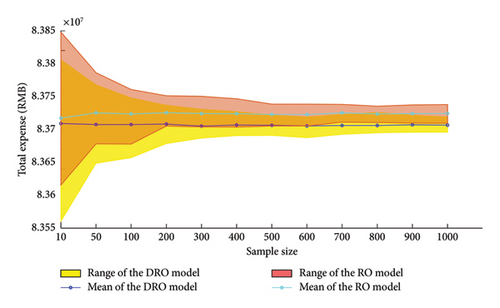
In addition, in scenarios with the same sampling size, indicating an identical level of uncertainty, the appointment quota plan generated by the RO model exhibits greater robustness and lower volatility in overall time expenses than the DRO model. This is because the RO model is inherently more conservative, focusing on cost minimization in the worst-case scenario. In contrast, the DRO model combines the advantages of both stochastic and RO to achieve better performance, at the cost of some robustness. These findings, also supported by the results in Figure 10, demonstrate that the proposed DRO model, which effectively integrates terminal gate data, can optimize the appointment quota plan of a TAS, significantly improving port efficiency.
7. Conclusions and Limitations
The data-driven approach presented in this paper, which combines data mining techniques with a DRO framework, aims to optimize the appointment quota plan in a TAS. The case study conducted at Yan Port demonstrates the effectiveness and advantages of the proposed model compared to benchmark models, such as the RO model. The main conclusions drawn from this study are as follows:
Firstly, the proposed approach outperforms traditional theoretical models by integrating real-world data, thus reducing reliance on stringent theoretical assumptions. Historical terminal gate data from the port are used to establish the relationship between truck arrivals at each time slot and the total turnaround time within the terminal. This relationship is modeled through the quadratic regression, simplifying the development of optimization models and facilitating the derivation of exact solutions. In addition, the model provides a clear explanation of the nonlinear increase in turnaround time caused by congestion when a large number of trucks arrive in a given time slot. If truck arrivals are more evenly distributed, the overall turnaround time can be effectively reduced.
Secondly, an analysis of the residuals from the regression reveals that their distribution varies across different time slots and days, reflecting changing operational conditions. To account for the uncertainties inherent in the regression relationship and ensure robust solutions, the study incorporates DRO theory to develop an optimization model for the appointment quota plan. The DRO model allows for the consideration of residual variability, producing reliable and robust solutions that address the system’s uncertainties.
Thirdly, the experimental results clearly demonstrate the superiority of the proposed DRO model over traditional RO models in minimizing overall time expenses. This highlights the DRO model as the optimal choice for determining the best appointment quota plan for a TAS. By implementing the proposed DRO model, port managers can make more informed decisions, significantly improving the effectiveness of the TAS.
However, there are some limitations in the current study. A key limitation is the availability of data from multiple sources, as only terminal gate data for trucks were used. To further enhance the port’s operational efficiency, which is a complex system, additional data sources should be considered, such as ship schedules, equipment operation data (e.g., cranes and gantry cranes), and yard layout information. Moreover, in this study, we assumed that all appointed trucks would arrive on time. In reality, trucks may arrive earlier or later than scheduled, introducing additional uncertainties that should be addressed in the future research.
Conflicts of Interest
The authors declare no conflicts of interest.
Author Contributions
Shichao Sun: conceptualization, funding acquisition, resources, supervision, validation, writing–original draft, and writing–review and editing. Yao Dong: data curation, methodology, and writing–original draft.
Funding
This work was supported by the National Natural Science Foundation of China (Grant number: 72202025) and the Fundamental Research Funds for the Central Universities (Grant number: 3132024180).
Acknowledgments
This research was supported by “The National Natural Science Foundation of China (Grant No. 72202025)” and “the Fundamental Research Funds for the Central Universities (Grant No. 3132024180).”
Endnotes
1IBM ILGO CPLEX Optimization Studio is a powerful software designed for decision optimization. With this tool, businesses can quickly develop and deploy optimization models to improve their operations and achieve better outcomes. Whether you need to optimize production processes, logistics, or resource allocation, IBM ILGO CPLEX can help you create real-world applications that deliver measurable results. To learn more about IBM ILGO CPLEX Optimization Studio and its features, please visit the following website: https://www.ibm.com/sg-en/products/ilog-cplex-optimization-studio.
Open Research
Data Availability Statement
The authors do not have the permissions to share the data.


