Influence of Vehicular Flow Instability in a Transport Network on Risk Reduction: Test in a Two-Link Network
Abstract
It is important to study risk in transport systems because mobility is subject to probable dangerous events, both internal and/or external to the traffic flow. This paper presents a method for the probabilistic assessment of social risk for endogenous traffic flow events. The model specification considers the three components of occurrence, vulnerability, and exposure. The first two components, the effects deriving from phenomena endogenous to the flow are considered and specified as a function of mean speed to consider flow instability and vehicle energy. The third component is calculated based on the fundamental flow diagram. The aim is to integrate the specified models for occurrence and vulnerability assessment and the specified models for flow instability. This paper makes a novel contribution to the field by specifying possible occurrence and vulnerability functions, for estimating the probabilities deriving from events endogenous to the flow. The methodology is applied in a two-link road network, and the results obtained demonstrate the quality of the proposed model and the possibility of adequately modelling the phenomenon.
1. Introduction
A transport system is characterized by congestion. Congestion generates additional costs for users. Dangerous events could occur alongside congestion, caused by phenomena internal (endogenous) or external (exogenous) to the traffic flow. These can cause damage to users. Endogenous and exogenous events have a direct impact on the users of the transport system and influence societal risk. Exogenous events are not influenced by congestion and remain independent. Endogenous events are influenced by congestion and depend on it. The two phenomena are connected. Congestion and the speed of vehicles generate instability, which presents a risk to users. It is essential to study and gain a deeper understanding of the relationship between risk and congestion.
Endogenous and exogenous events affect users of the transport system and influence societal risk. Exogenous events are not influenced by congestion and are independent of it. Endogenous events are influenced by congestion and depend on it. The two phenomena are connected because of congestion, and the speed of vehicles can generate risks for users. It is therefore necessary to study and deepen the dependence between risk and congestion.
The issue of risk in transport systems, in conjunction with the examination of technology that facilitates emergency situations [1], is investigated through a system of models that simulate the passenger transport system and its constituent elements, namely, demand ([2]), supply, ([3]) and mutual interactions ([4]). Furthermore, the system of models is employed to examine the transportation of dangerous goods and the optimization ([5]) of associated routes. In addition to the simulation of the system, it is necessary to define a system of models for the optimization of the regulation parameters ([6]) and for the evaluation of the effects ([7, 8]). The papers [2–8] and related references consider methods to study risk in large systems in which the effects on congestion and user choices propagate in a nonlinear way. It is essential to consider the models and the evaluation system within a planning process ([9, 10]), which encompasses the construction of scenarios, the evaluation of the effects of the same scenarios, training for the users, monitoring of the effects and possible redefinition scenarios to reevaluate and compare.
Considering the consolidated formulation proposed in the literature, the risk can be classified into three primary components ([11]): occurrence, vulnerability, and exposure. For an exhaustive examination of the occurrence and vulnerability models and the related methodologies employed in the literature to evaluate them, the reader is directed to Reference [12]. An extensive analysis of the definition of exposure is presented in Reference [13]. With regard to the assessment of risk in relation to the space-time variation of the vehicle, an analysis and experimental investigation utilizing real data are presented in Reference [14]. The first two components (occurrence and vulnerability) estimate the probability of the occurrence of dangerous events and the inverse of the resistence of people and goods following the occurrence of such events. A Bayesian approach to analyzing occurrences in the road transportation systems is presented in Reference [15]. A vulnerability analysis of the road transportation system, from the perspective of network reliability, is presented in Reference [16]. The occurrence is dependent on the mean traffic speed and instability, as reported in References [17, 18]. The third component (exposure) estimates the number of people and quantity of goods exposed at the event. In a transport system, the number of people present in the system can be estimated using the models consolidated in the literature in the field of transport engineering for estimating the demand for mobility, the performance of the supply system, and their mutual interaction [19, 20].
The analysis of large systems can be conducted using the fault tree analysis (FTA) [21, 22], which is supported by the Bayesian theory. The FTA identifies a tree of potential events and the corresponding occurrence probabilities.
The level of risk is contingent upon the variables associated with traffic flow. The study of the relationship between the fundamental variables of traffic flow has been a topic of research for almost a century. The initial research on road networks (e.g., [23–26]) posited relationships between flow and density variables, based on empirical observations and data derived from simulations. A macroscopic approach ([27]) was developed to address the stationary urban flow. Calibration of parameters derived from observed data ([28]) and an analysis of the three fundamental variables ([29]) are prerequisites for the calibration of the traffic flow fundamental diagram. Furthermore, the traffic flow fundamental diagram has been extended to the transport network level, building upon the concept initially considered at the link level ([30]). A study examining the relationship between traffic flow in dynamic contexts and chaos theory is presented in Reference [31]. The study investigates the dependency of injury risk and road chaos.
Integrating traffic flow and travel demand models with information and communication technologies for connected vehicles offers significant benefits in terms of risk reduction. This approach enhances the efficiency and safety of the transport system, minimizes traffic disturbances, and provides decision-makers and decision-takers with valuable insights to inform their decisions. Technologies can also be integrated with external information for users, thereby supporting their decisions in relation to external forecasted dangerous events. One possibility is reported in Reference [32], where a hazard impact model is developed for a short-term weather-related hazard. The model intends to provide information during high-wind events, considering the three risk components described below.
The risk assessment and management, and the problem concerning congestion and the fundamental diagram of traffic flow, could be studied together as a single problem. The principal objective of this paper is to examine the risk assessment and reduction strategies in a road transport network, with a particular focus on the influence of the fundamental flow diagram. The analysis encompasses not only external events that are exogenous to the traffic flow but also endogenous events that are intrinsic to it, such as road accidents. Other events, referred to as exogenous events, are assumed to be fixed and thus beyond the scope of this paper. A comprehensive risk reduction strategy is proposed, which considers the interrelated events and probabilities associated with flow instability. This strategy can be implemented without explicit reliance on the FTA and incorporates traffic flow variables as control variables. The methods could be employed in the construction of models for risk reduction. The proposed approach could be employed to mitigate risk by implementing an appropriate control strategy for traffic flow within the transportation system, specifically by adjusting the timing of traffic signals at intersections in real time.
- i.
Firstly, the specification of the possible occurrence and vulnerability functions allow for the estimation of the probabilities deriving from endogenous events within the general methodology reported.
- ii.
Secondly, the functions have been tested in a small test transport system comprising a two-link network; this system is selected for testing because it allows for step-by-step monitoring and reproduction of the application, as well as the identification of potential limitations.
The research makes a specific contribution to knowledge in the evaluation of the societal risk function in relation to travel demand and the estimation of societal risk in relation to demand and congestion levels. It offers a methodology that can support decision-makers and decision-takers in their decision-making processes.
Section 2 presents the general specifications for social risk assessment, employing the probabilistic risk assessment (PRA) method (subsection 2.1), and traffic flow variables (subsection 2.2). The research contributions, as outlined in bullet points i and ii, are developed in Sections 3 and 4. In Section 3, the three risk components and the dependency on traffic flow variables and a method for social risk assessment are reported. The models are specified and applied with quantitative models in a test transport system consisting of two links arranged in parallel (Section 4). Section 5 provides a discussion of the models and applications. Section 6 reports some conclusions and indicates potential areas for future developments.
2. Societal Risk and Congestion
- •
po, the occurrence, the probability (or likelihood) that the dangerous event defined also with an intensity level, will occur
- •
pv, the vulnerability, the probability that the transport system will have negative effects upon the occurrence of the dangerous event
- •
e, the exposure, the measurement of the number of people and the quantity of goods.
The risk can be calculated by disaggregating the three reported components. To illustrate, the first component can be divided by considering various events, whether linked or not, that could occur; the second component can be divided by considering different vulnerability components associated with the vehicle, the user, and the road; the third component can be subdivided by considering the effects on users and nonusers.
In this paper, the risk calculation is limited to an evaluation of its effects on people; therefore, goods will not be considered further. Furthermore, the aforementioned information can be extended to encompass goods.
The third component of risk, exposure, is significantly influenced by the number of users on the transportation network. The remaining two components of risk, exposure and vulnerability, are also contingent on traffic flow, given that the flow can precipitate endogenous events and that vehicles and users could exhibit disparate levels of vulnerability. In addition, these components are susceptible to fluctuations in traffic conditions.
The number of users on each link of a transport network is contingent upon congestion and is derived from the interaction between the performance of the system (supply system) and the behavior of the users (demand system) across the entire transport network. In a link, the relationship between flow variables and speed is typically illustrated through the fundamental traffic flow diagram. It is thus evident that an evaluation of risk (Section 2.1) requires consideration of the traffic flow fundamental diagram (Section 2.2).
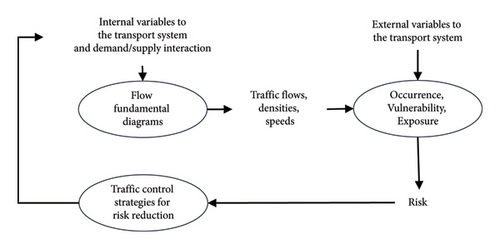
A general scheme that links the calculation of risk with the flow fundamental diagram is presented in Figure 1. The evaluation of risk, which comprises three components (occurrence, vulnerability, and exposure), is contingent upon external and internal variables with respect to the transport system. The internal variables, which derive from interaction models between supply and demand at the link level, are elucidated through the utilization of fundamental flow diagrams. Consequently, it could be possible to control certain variables of the transport system, such as signal settings at junctions, to reduce risk, should this be necessary. The implementation of control measures for flow variables is contingent upon an evaluation of the dependence of risk values on flow variables.
In consideration of the specifications proposed, the primary symbol adopted and its corresponding description are presented in Table 1. The symbol in question is also referenced in the subsequent sections, where additional symbols are introduced.
| Symbol | Description |
|---|---|
| e | Exposure |
| eEX | Exogenous exposure |
| eEN | Endogenous exposure |
| f | Traffic flow |
| k | Flow density |
| k∗ | Density with maximum flow |
| L | Set of possible intensity level |
| l ∈ L | Intensity level |
| m | Link length |
| po | Occurrence |
| po,EX | Exogenous occurrence probability |
| po,EN1 | Endogenous occurrence probability (flow instability) |
| po,EN2 | Endogenous occurrence probability (mean speed) |
| pv | Vulnerability |
| pv,EX | Exogenous vulnerability probability |
| pv,EN | Endogenous vulnerability probability |
| rEN | Endogenous risk |
| rEX | Exogenous risk |
| rs | Social risk |
| rs(s) | Societal risk function |
| rsN | Societal risk in the network |
| rs,i(si) | Societal risk function in the link i |
| s | Mean speed |
| s0 | Free flow speed |
| si | Speed in link i |
| T | Time interval |
| t ∈ T | Instant of time |
| X | Space interval |
| x ∈ X | Point in space |
| ϕ1(s) | Endogenous occurrence probability function (flow instability) |
| ϕ2(s) | Endogenous occurrence probability function (mean speed) |
| α1, α2, α… | Parameters |
| γ (x, l, t) | Vulnerability function |
| η (x, l, t) | Exposure function |
| ϕ (x, l, t) | Occurrence function |
2.1. Societal Risk
The PRA can be extended to the general case; for further details, please refer to Reference [11].
- •
x a point in space, with x ∈ X
- •
X a space interval adopted for the risk evaluation
- •
l an intensity level of a dangerous event, with l ∈ L
- •
L the set of possible intensity level
- •
t an instant of time, with t ∈ T
- •
T a time interval adopted for the risk assessment.
- •
po = ϕ (x, l, t)
- •
pv = γ (x, l, t)
- •
e = η (x, l, t),
Equation (2) is equivalent to Equation (1) with constant values (with respect to x, l, and t) for occurrence, vulnerability, and exposure.
The social risk related to multiple events is obtained by evaluating the social risk for each event, considering the expected value for independent or dependent events.
2.2. Fundamental Diagram
The transport supply is represented with a network comprising three key elements: a set of nodes, a set of ordered pairs of nodes (links), and a vector of link cost functions, with one function for each link. This representation is analyzed using a topological approach. The topological approach offers the advantage of decomposing the supply problem into discrete subproblems pertaining to elementary links and paths and their interdependencies.
The risk is contingent upon the users and the traffic flow characteristics of each link within the network. In congested transport systems, the number of users on a link at a given instant (density), the number of users crossing a section of the link over a given interval of time (flow), and the average speed in the link (speed) are related via the fundamental diagram and the fundamental flow equation. Congestion propagates between network links.
The flow and mean speed on a transportation network link are related via a fundamental diagram. Various specifications for the fundamental diagram have been proposed in the literature (e.g. Greenshields, Drew, Drake, Underwood, …). The choice of the most suitable specification depends on the type of link and the behavioral characteristics of users, which can change based on the territorial area studied.
- •
f, the flow
- •
s, the mean speed
- •
s0, the free flow speed (parameter)
- •
k∗, the density with maximum flow (parameter).
The fundamental diagram is a key concept in the dynamic approach to the route choice simulation in emergency conditions, as discussed in detail in References [33, 34].
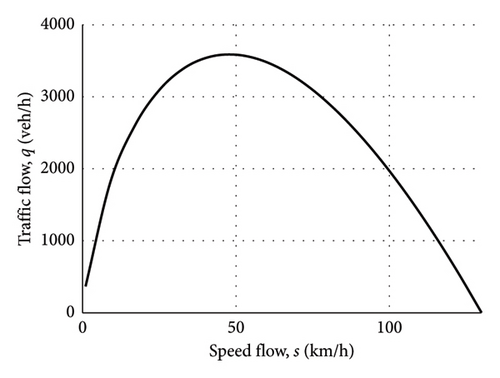
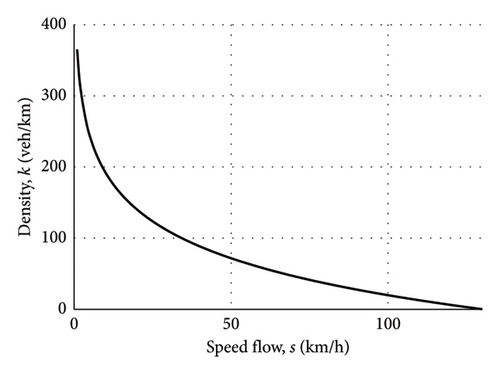
The functions of the Underwood are outlined in Equation (4). Figure 2 provides a visual representation of Equation (4). This specification is presented to emphasize the existence of two distinct branches of the curve. The first branch pertains to stable flow, which is represented by a decreasing function. In this branch, vehicles exert a limited influence on one another during movement, and stop-and-go phenomena are uncommon. The second branch corresponds to unstable flow, which is characterized by an increasing function. In this branch, vehicles are strongly influenced by one another, and the flow is typified by frequent stop-and-go phenomena.
3. Risk Evaluation
This section presents the findings of a qualitative analysis investigating the relationship between risk and travel mean speed in a transport network link. The analysis is conducted separately for each of the three risk components and subsequently for social risk.
The initial four subsections present the findings of the risk assessment conducted on a single network link. The functions proposed are uncertain and cannot be generalized to any situation; furthermore, they depend on the typology of the dangerous event.
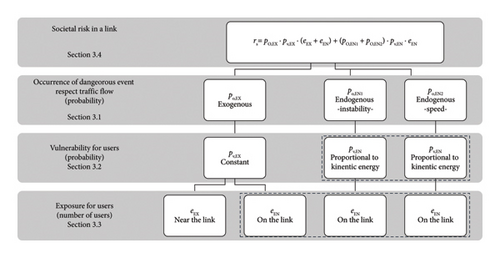
Figure 3 presents the proposed model for risk evaluation in a transport network link. The model considers the three components of risk, differentiating between endogenous and exogenous events within the traffic flow. Further details on each component and the overall risk are provided in Subsections 3.1–3.4. In Subsection 3.5, a proposal for quantitative functions that could be used and generalized in road transport networks is presented.
3.1. Occurrence
The occurrence of dangerous events in a transport system can be classified into two categories: exogenous and endogenous with respect to the vehicular flow. Exogenous events originate from external sources and, as a result, are not subject to the influence of congestion; examples of such events include floods and earthquakes. In contrast, endogenous events are those generated by vehicle flow and congestion, and thus contingent on traffic conditions; examples of such events include vehicular accidents. There is also a class of events generated by vehicles that are not contingent on congestion. These include the emission of dangerous substances transported by a vehicle because of mechanical failure. From a numerical standpoint, these events are treated as exogenous to the vehicular flow.
- •
po,EX, the probability (or likelihood) of the occurrence of an exogenous hazardous event
- •
po,EN1, the probability (or likelihood) of the occurrence of an endogenous dangerous event derived from flow instability
- •
po,EN2, the probability (or likelihood) of the occurrence of an endogenous dangerous event derived from mean speed.
Exogenous dangerous events are defined as those that do not depend on flow conditions and can be assumed to be constant with respect to the flow variables, namely, mean speed and traffic flow. They depend on a set of exogenous attributes and parameters and are denoted by po,EX.
Endogenous dangerous events are contingent upon occurrences within the flow that have the potential to precipitate accidents. The relationship between road safety and mean speed is examined in Reference [13], while the correlation between road safety and flow instability is investigated in Reference [18].
- •
The instability of the flow is a significant factor contributing to accidents; frequent stop-and-go phenomena, lane changes, decelerations, and accelerations are among the primary causes of this instability; the curve in question is higher in the unstable zone (low mean speeds of the fundamental diagram) and decreasing in the stable zone (high mean speeds of the fundamental diagram); it can be assumed that a function of the mean speed can be assumed, po,EN1 = ϕ1(s)
- •
The speed of the vehicles is also a factor. As the mean speed increases, the braking and stopping distances increase, and the instability of the vehicle increases; this curve is at its lowest point in the unstable zone (low mean speeds of the fundamental diagram) and increases in the stable zone (high mean speeds of the fundamental diagram); it is possible to assume a mean speed function, po,EN2 = ϕ2(s).
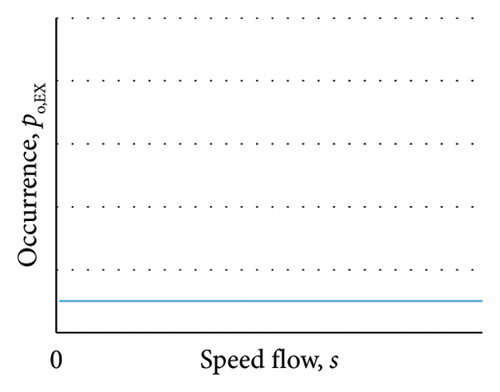
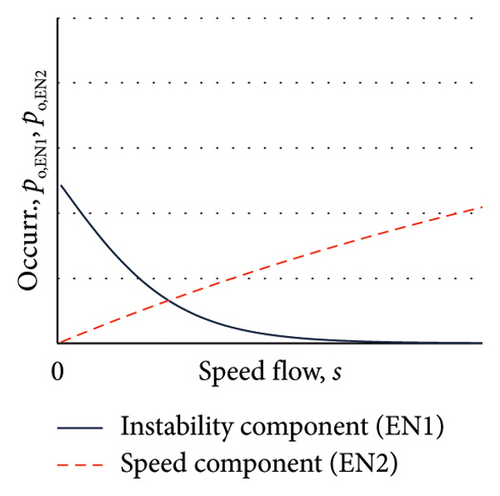
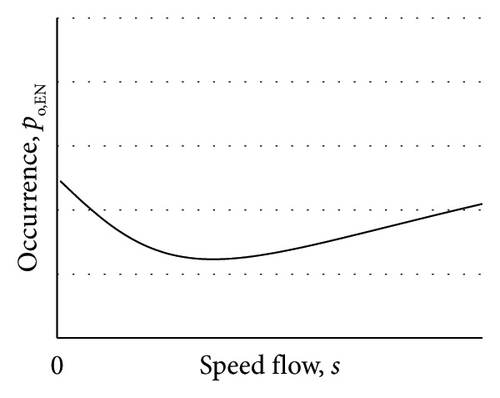
It is essential to consider additional variables that are distinct from those that characterize traffic flow.
It should be noted that in the event that the two endogenous occurrences are not disjoint, the probability of their intersection occurring must be subtracted from the probability of occurrence (ϕ12(s)).
3.2. Vulnerability
The susceptibility of individuals to the occurrence of a hazardous event is contingent upon the magnitude of the event and the resilience of the individuals in question.
- •
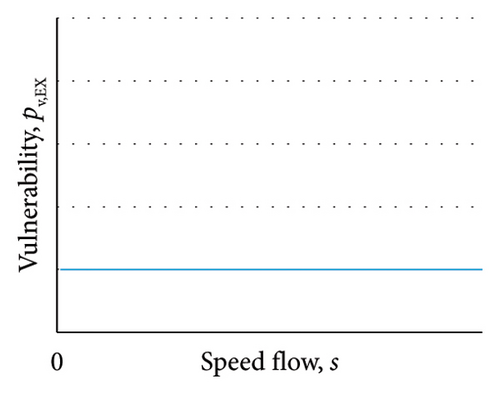
For an exogenous event occurring within the flow, the energy does not depend on the traffic flow variables, as these are external to the flow and therefore not affected by the event; the exogenous vulnerability, pv,EX, can therefore be considered constant with respect to the flow variables (Figure 5(a));
- •
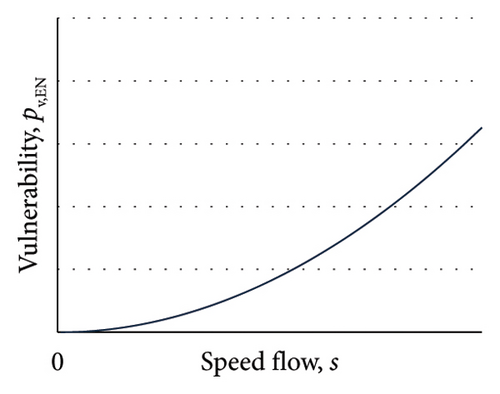
For endogenous events, the energy depends on the traffic flow variable and is mainly a function of the kinetic energy of the vehicles involved in the impact; if the speed is zero, the kinetic energy is zero, the vehicles are stationary, and an accident cannot occur; if the speed is greater than zero, the kinetic energy is proportional to the square of the speed (s2); it can be assumed that the endogenous vulnerability, pv,EN, depends mainly on the kinetic energy, pv,EN = α·s2; α is a parameter independent of the traffic flow variables; a qualitative function of the vulnerability rate for an endogenous event is presented in Figure 5(b).
With regard to vulnerability, further specifications and additional variables dependent on the traffic flow and the road and vehicle characteristics, including those of a technological nature related to safety, can be considered.
3.3. Exposure
- •
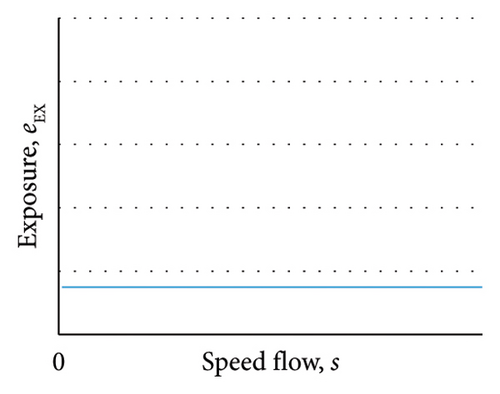
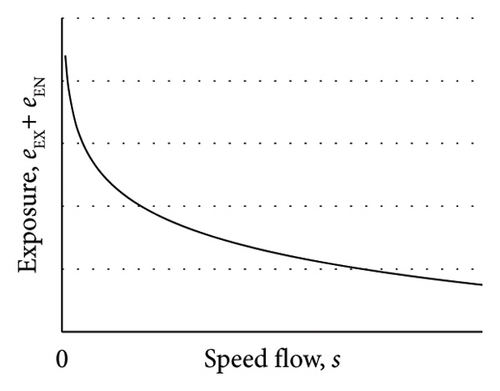
The first category of users is those situated in the vicinity of the link, for example, residents, who could potentially be affected by the dangerous event; this category of users is not dependent on traffic conditions and therefore can be assumed to be a constant in comparison to the value evaluated in the previous point (Figure 6(a))
- •
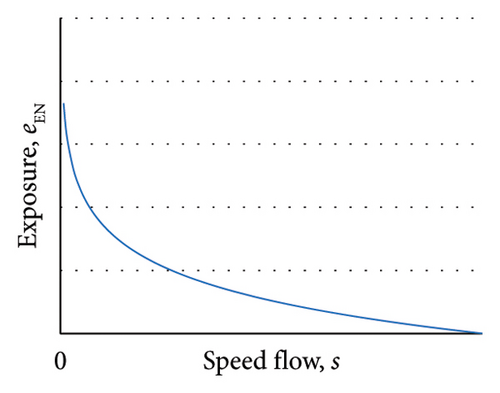
The second category of users is those utilizing the transport link, eEN; this category of users is dependent on traffic conditions, and the number of users can be estimated by multiplying the traffic density, k, by the link length, l, resulting in eEN = k·l (Figure 6(b)).
It should be noted that Figures 2(a), 3(a), and 4(a) are constant with respect to speed flow but refer to different risk components: occurrence, vulnerability, and exposure, respectively. Accordingly, the values are distinct.
3.4. Societal Risk in a Link
The social risk associated with a link, denoted by rs, can be evaluated using Equation (1), which is dependent on whether the event in question is exogenous or endogenous. The mean speed value is a determining factor. The system means speed and performance on each link are obtained through the application of assignment models ([19]). In stationary conditions, the mean speed can be used as an input to obtain the other flow variables (flow rate and density) through the application of a traffic flow model that is dependent on the type of link in question. One potential traffic flow model is the Underwood model, which is reproduced in Section 1 for illustrative purposes.
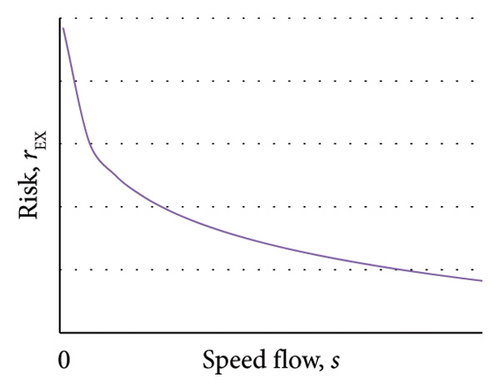
For an exogenous event in a link, the endogenous risk can be considered to have a similar trend to that of the number of users, given that it is derived from a constant for the total exposure (Figure 7(a)). In the case of high congestion, when traffic density approaches that of a traffic jam, the risk is elevated.
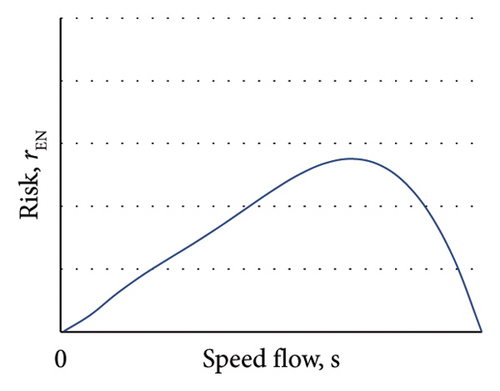
For endogenous events in a link, the exogenous risk (Figure 7(b)) is zero when the speed is zero. This is because: if the speed is at a value of zero, the probability of an accident occurring is null; when the speed is at a value corresponding to free flow, the probability of a user being present on the link is also null, and thus the exposure is also null. The risk is at its maximum when intermediate values are reached. The optimal value for risk acceptance is contingent upon the specific circumstances and the policy in place regarding the speed that facilitates mobility and the associated risk for users.
Figure 7 illustrates the qualitative function for social risk traffic speed mean.
The exposure component is evaluated using models that consider the interdependencies across the entire transport network. Similarly, the components of exposure for endogenous events and user vulnerabilities are dependent on the speed variables. Consequently, these components are evaluated with models that consider the dependencies with the other links of the network.
3.5. Societal Risk in a Network
The societal risk associated with a link, as outlined in Subsection 3.4, is contingent upon the prevailing traffic conditions across the entire transport system. This, in turn, gives rise to the generation of flow and speed on the specific link in question. The risk is evaluated using Equation (8). The relative risk associated with a generic link i is contingent upon the speed of the same link, denoted as a function rs,i(si).
3.5.1. Link exposure
The propagation of congestion and exposure can be evaluated using dynamic assignment models, which were initially developed in ordinary conditions ([19]) and subsequently extended to emergency conditions ([2–4]). These models facilitate the evaluation of flow variables in each link, beginning with the interaction of two models: the supply model, which concerns network performance, and the demand model, which concerns user behavior. The link exposure can be evaluated based on the flow variables, which in this case are expressed in terms of density.
3.5.2. Occurrence and Vulnerability of Links
This paper examines the variability in risk associated with hazardous incidents that are intrinsic to the flow, predominantly vehicular accidents. Such accidents are caused by the interaction between the infrastructure, users, and vehicles. The probability of such occurrences and the vulnerability of users are evaluated as a function of vehicle flow variables, which in turn derive from interaction models between supply and demand in the entire transport system. Consequently, the occurrence and vulnerability probabilities are evaluated for each link, with these probabilities dependent on the overall dynamics of the transport system.
3.5.3. Network Societal Risk
- •
rs,i() the function that evaluates the societal risk in link i
- •
si, the traffic speed in link i.
The social risk on a transport network, contingent on the flow variables, enables the estimation of its variability and, consequently, the identification of the optimal values of the variables to facilitate its reduction. Once the optimal risk values and the corresponding traffic flow quantities have been identified, it is possible to evaluate the feasibility of implementing traffic control strategies (e.g., through the real-time setting of signals at junctions) that can generate such values. It is essential to implement control strategies across the entire transport system, taking into account the interaction between the performance of the supply system and the behavior (typically driven by perceived utility) of users.
4. Quantitative Evaluation in a Test System for an Endogenous Event
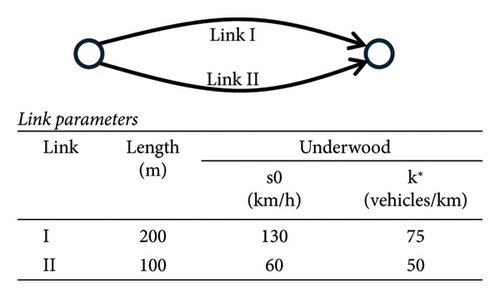
This section presents a numerical application in a small-scale transportation network. The objective of this application is to test the applicability of the method and to ascertain its potential by extending it to real-scale transport networks. The primary objectives of this paper are twofold: firstly, to facilitate the reproduction of results in a test system and secondly, to elucidate the impact of the principal variables.
- •
Link traffic flow modelled with fundamental Underwood diagram in both links
- •
Absence of external exposure
- •
Evaluation of endogenous social risk
- •
Inelastic demand and balance of users in the transport system.
Furthermore, the issue can be addressed by modifying the hypotheses presented.
The application of the method described in Section 2 and the model specified in Section 3 in a two-links test network is based on the premise that in a small system, it is more straightforward to monitor the application and that the results are entirely reproducible. The functions delineated in the five subsections of Section 3 are delineated in a corresponding number of steps, and the results are reproduced in figures for each of the two links and for the system. Furthermore, it enables the identification of the constraints associated with the subject matter under discussion.
- •
α1, α2, α3, α4, greater than zero, and assumed in the numeric test equal to α1 = 0.3, α2 = 0.015, α3 = 0.5, α4 = 0.5; note that other values can be adopted and they must be calibrated from real data
- •
s0, k∗ parameters of the Underwood function and the values assumed are s0 = 130 km/h and k∗ = 75 vehicles/km, reported also in Figure 2
- •
m the link length
- •
k the link density
- •
s the link speed
- •
B, C, D, greater than zero, parameters independent from traffic flow
- •
F = B·C·D
- 1.
Occurrence on link I or II (I or II is omitted for simplicity and reintroduced on point 5)
()()() -
and considering Equations (10) and (11), Equation (12) is:
() - 2.
Vulnerability on link I or II
() - 3.
Exposure on link I or II
() -
It should be noted that, in accordance with the principles of the speed-density function, an increase in speed (s) will result in a reduction in density (k) and, consequently, a decrease in the level of endogenous exposure.
- 4.
Societal risk on link I or II
() -
and considering Equations (13), (14), and (15), Equation (16) is:
() - 5.
Total societal risk on the network N calculated under the assumption that congestion propagation occurs and that the dangerous event does not propagate on the other link (the societal risk and the speed flow for the links I and II, are indicated with respective indices I and II)
() -
The model parameters can be classified into three principal categories:
- •
Parameters that do not depend on traffic speed; they do not influence the minimum risk point (in the specific cases B, C, D, and F); they respect the traffic control variables; these parameters do not need to be calibrated in order to minimise the overall risk
- •
Parameters that define the traffic flow function in each link of the transport network (in the specific case f s0, k∗); these parameters are calibrated in the literature in different territorial areas and link types; the values available in the literature can be used or they can be calibrated using consolidated methods
- •
Parameters in the risk components (in the specific case f α1, α2, α3, α4); these parameters can be calibrated from observed data on occurrence, vulnerability, and exposure; very often real data in emergency conditions are not available and game experiments are developed with limitations and differences that exist between the real context and the simulated context, especially for the behavior of users in conditions of imminent danger.
With the adopted function, the occurrence, vulnerability, exposure, and social risk for each link, without considering the constants B, C, D, F, are shown in Figure 9. The feasible set of each function depends on the mean speed of the free flow, and the trend depends on the parameters adopted for the parameters of the two functions and for the parameter of the convex combination. More details on the characteristics of each function are given in Section 3.
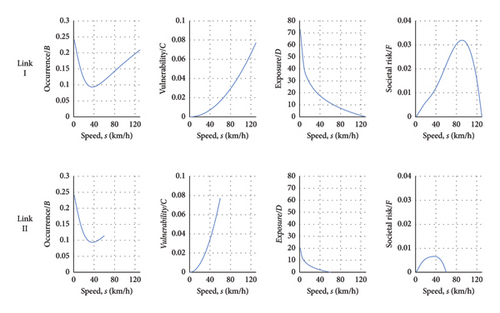
All components and social risk are proportional to a variable measuring the component that does not depend on the traffic flow variables. The occurrence functions are the convex sum of two terms: the first is because of instability and is assumed to decrease exponentially with mean speed; the second is because of mean speed and is assumed to increase exponentially with mean speed. The vulnerability functions are assumed to increase with the square of the ratio between the mean speed and the free flow speed; the free flow speed is introduced because the vulnerability also depends on the characteristics of the infrastructure. Exposure is equal to the number of users present on the links, evaluated on the basis of traffic density. Risk is the product of the three components mentioned above. In the case studied, there is a concave function for each link.
The main results are presented in Figure 10. The transport system consists of two parallel links (also called paths) connecting an origin–destination pair. Continuous mean speed flow functions have been assumed on the link. A deterministic equilibrium does not guarantee the uniqueness of the solution because each link is capacity constrained and produces a 1 (time) to 2 (flows) map for travel times; therefore, the simplification of using a travel time function derived only from the stable portion of the flow curve is not adopted.
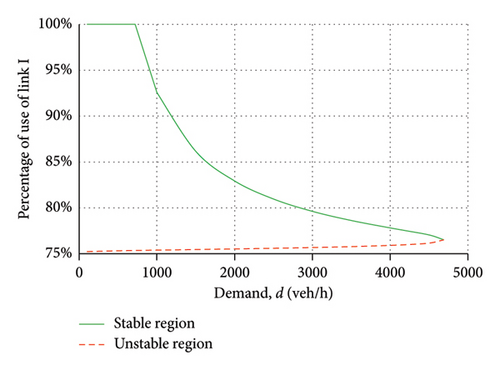
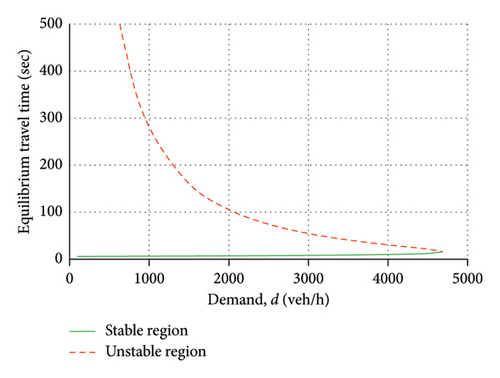

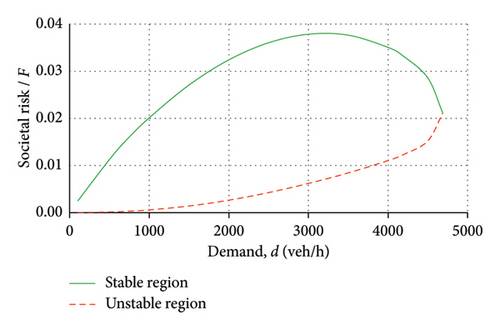
From zero demand up to the system capacity limit, two solutions are generated: one with stable flow (green values); one with unstable flow (red values). For low demand values, in a stable region, everyone chooses link I. Figure 10(a) shows the percentage of choice of link I; the percentage of choice of link II is obtained considering that the sum must be 100%. Figure 10(b) shows the evolution of the deterministic equilibrium time on the system as a function of the total travel demand. Figure 10(c) shows the average equilibrium speed resulting from the two links. Figure 10(d) shows the value of the total endogenous social risk, obtained as a value calculated on each link; considering that for each demand value two equilibrium points are possible, two risk values were calculated, one resulting from unstable flow and one resulting from stable flow.
The results obtained in the case studied and with the functions adopted indicate that the total endogenous risk is lower in the unstable region than in the stable region; furthermore, in the stable region, it increases with increasing congestion; in the stable region, however, it initially increases with increasing congestion, reaches a maximum, and then decreases with increasing congestion. It should be noted that the calculated risk depends on a constant to be evaluated via variables external to the flow; however, considering that in this paper the minimization of social risk is studied in relation to traffic flow variables (control variables), the value obtained does not depend on the constant itself. The results obtained are influenced by the functions used and could even have opposite values in cases where the events because of instability are greater than those because of high average speeds. However, some conclusions can be drawn and are reported in the last section of the paper.
5. Discussions
Some discussion of the results obtained is provided in this section, divided into the risk model component and the societal risk component.
5.1. Occurrence and Vulnerability
The probability of the occurrence of a hazardous event depends on numerous factors, both external and internal to the traffic flow. The aim of this paper is to analyze the events internal (endogenous) to the traffic flow; the numerous and important variables external (exogenous) to the flow that influence the probability of occurrence and the vulnerability have not been considered as external inputs. Limiting ourselves to the flow variables, at zero speed, the probability of an endogenous hazardous event tends to zero due to the movement of the vehicles and the energy of the vehicles. This is the case, for example, in areas close to vehicular traffic. Where vehicle circulation is necessary, the probability of the occurrence of hazardous events is mainly influenced by two factors: flow instability phenomena involving frequent acceleration, deceleration (and, if possible, lane changes); average vehicle speed influencing occurrence and vulnerability. Depending on the type of road, the first or second factor could be more important.
5.2. Exposure
The exposure component related to users of the transport system is related to congestion. The main variable used to estimate exposure is traffic density because it estimates the number of users present per unit length at a given time. The vehicle flow variable cannot be used because it is a measure of the number of users passing through a section of infrastructure per unit of time and depends on the instability of the flow. Exposure is the greatest under unstable flow conditions with high density. Flow variables can be obtained using quantitative methods well established in traffic engineering ([19]). These methods estimate the demand for mobility and calculate the flows of users in the links, even in large transport systems. The user equilibrium method is applied in the paper for the two-link network; in the case of real-scale systems, methods of dynamic demand assignment to the transport network are essential.
5.3. Risk
The concept of risk is of paramount importance in this context. It is possible for an event to have a high probability of occurrence but an extremely low value of exposure, or vice versa. It is therefore necessary to evaluate whether it is appropriate to reduce one or more components of the risk or the overall value of the risk in relation to the phenomenon under study. It is therefore essential to conduct an overall analysis and to study and analyze each component and risk in turn. In the paper, the risk is calculated with the inclusion of a constant, which incorporates variables that are not dependent on the traffic flow. Given that the objective is to minimize the risk, which can be achieved by controlling the flow variables, the constant does not affect the solution to the problem. The results obtained for the case study demonstrate the validity of the method reproduced in the work, particularly with regard to the calculation of the risk as a function of traffic variables. One further consideration is the influence of congestion on societal risk. The congestion has two effects on the total risk. Firstly, congestion increases the density and number of vehicles and users present in the congested area in a given time period, thereby increasing exposure for transport system users. Secondly, congestion decreases the mean speed, which has two opposing effects on endogenous dangerous events. On the one hand, it increases instability and the potential for accidents. On the other hand, it reduces the average speed and the energy associated with accidents. It can be concluded that the risk needs to be evaluated on a case-by-case basis, disaggregating the evaluation into its constituent components and considering the specific characteristics of the links in question, the network configuration, the travel demand, and the potential for endogenous and exogenous events in a congested scenario. There is a definitive interconnection between risk, congestion, traffic assignment models, and PRA. In the context of the transport system, these factors are inextricably linked and cannot be considered in isolation.
6. Conclusions and Further Developments
The objective of this paper is to present a risk model for the evaluation of PRA in a transportation system. The risk is delineated with respect to both endogenous and exogenous events pertaining to the traffic flow. An application is developed with a view to considering the effects on transport users resulting from endogenous events. To conduct an adequate analysis, it is essential to examine the individual components of the risk, namely, its occurrence, vulnerability, and exposure, as well as the risk as a whole.
In the context of PRA methods in transport systems, the risk is assessed in accordance with the fluctuations in quantities endogenous and exogenous to the traffic flow. The objective of risk management models is to evaluate the actions that should be taken to minimize the risk.
The findings of this study substantiate the necessity of employing quantitative models to assess the societal risk associated with endogenous traffic events. The evaluation is based on the separation of societal risk into its three main components: occurrence, which concerns the likelihood of dangerous events occurring; vulnerability, which concerns the extent to which users are susceptible to harm; and exposure, which concerns the extent to which users are exposed to risk. A risk evaluation could enable decision-makers and decision-takers to make informed decisions regarding traffic flow and congestion, as predicted by a traffic assignment model.
In the test system under examination, the impact of reducing each risk component in relation to traffic congestion can be gauged with a view to reducing societal risk. This could inform decision-making regarding the actions to be taken in the system, as the available resources can be allocated to the component that offers the greatest reduction in societal risk in relation to the forecasted traffic and congestion. With the assumptions in place, the final figures presented in Figure 10 serve to illustrate the mapping of societal risk in relation to travel demand for the two-link network.
The models presented in this paper are particularly useful in situations where control actions on risk management mobility need to be implemented. They are especially useful as a decision-support tool, particularly when decisions need to be made in real time regarding which actions to implement. The implementation of this method, in conjunction with the specification, calibration, and validation process for the risk components, can be adopted by those responsible for decision-making and decision-taking. In congested systems, the risk is influenced by congestion for endogenous events within the traffic flow, with the risk level dependent on the congestion. The integration of these models could facilitate the forecasting of traffic states and risk levels, thereby providing decision-makers with the information required to take action in order to minimize risk. Such a system could prove beneficial in the context of real-time traffic control, as well as at tactical and strategic planning levels, where it could assist in the design of long-term transport systems based on network and demand management.
Regarding subsequent developments, the numerical results obtained are applicable to the case study and the hypotheses introduced. The initial consideration pertains to the limited system under examination in this study and the underlying hypothesis. The assumptions made regarding the supply sub-system (two-link network), the travel demand (inelastic demand), and the absence of external exposure limit the scope of this study. Consequently, it is necessary to generalize the findings and to conduct further studies. The second consideration pertains to the testing of the system in a real-size setting. It is possible to extend the reported method to real-sized systems by using appropriate models based on real data. In order to apply a model in real contexts, the following developments in future research are required: the specification, calibration, and validation of occurrence and vulnerability models, the identification of the endogenous and exogenous variables to be included, and the estimation of the parameters with appropriate classical or Bayesian statistical methods; the use of interaction models between supply and demand, consolidated in the literature, which should be chosen appropriately depending on the problem to be studied, preferably dynamic models that allow calculation in stable and unstable flow conditions; the specification and testing of risk management models in order to obtain the best traffic flow variables that minimize social risk.
Conflicts of Interest
The author declares no conflicts of interest. The author stated that he is an academic editor of the Journal of Advanced Transportation, and this had no impact on the peer review process and the final decision.
Funding
The study was performed as part of the employment of the author.
Acknowledgments
The author would like to thank all the researchers from the Transportation Group at Department DIIES for the long and deep discussion.
Open Research
Data Availability Statement
All data used are reported in the paper.


