Taxiing Route Planning for Aircraft on Airport Surface Considering Conflicts With Ground Service Vehicles
Abstract
The density and complexity of airport surface traffic increase significantly with the expansion of hub airports. Conflicts may occur due to the concentration of aircraft and ground service vehicle (GSV) movements, leading to safety and congestion issues. Considering the potential conflicts with GSV routes, a strategic aircraft taxiing route planning model is proposed, which integrally optimizes apron area and runway assignments for arriving/departing aircraft, as well as their taxiing routes. Two prioritized objectives are considered for the safety of airport surface traffic and the convenience of passengers. The proposed model is validated first in an illustrative example and then applied in the real-world case of Shanghai Pudong International Airport, China. The optimal routing plan effectively reduces the conflict points between aircraft and GSVs by 29.2% and 19.0%, respectively, compared with the two typical alternative plans. To assess the impact of different management preferences on the trade-off among various locations and types of conflicts, a series of experiments are conducted by setting up different conflict weights. The results demonstrate that the optimized plan effectively reduces the number of conflicts with higher weights.
1. Introduction
With the end of the COVID-19 pandemic, the aviation industry is returning to prepandemic levels. The International Air Transport Association (IATA) anticipates a continuous rise in global air traffic, and Eurocontrol [1] predicts a 44% increase in European flight volume by 2050 compared with 2019. The growth in air traffic has led to the expansion of many hub airports worldwide. With the construction of more aircraft runways, stands, and taxiways, the density and complexity of airport surface traffic increase significantly. Conflicts between aircraft taxiing and ground service vehicle (GSV) movement frequently occur, bringing congestion and safety issues [2, 3]. It is reported that collisions on the airport surface are three times greater than those in the airspace [4].
Route planning plays an important role in airport surface traffic management, whose goal is to reduce the likelihood of conflicts between the movements of aircraft and GSVs [5]. Arriving and departing aircraft are required to taxi on planned routes between runways and aircraft stands; GSVs drive on predetermined routes from their depots to the stands for serving the aircraft (e.g., refueling, cabin cleaning, potable and water servicing). By appropriately assigning the aircraft and GSV flows on separated routes, many conflict points (i.e., potential locations of conflicts) can be avoided, which improves safety, as well as reduces the delay and fuel consumption of the surface traffic [6].
This study proposes a strategic route planning model considering the movement of both aircraft and GSVs on the airport surface. The proposed model integrally determines (1) the allocation of apron areas (each of which consists of multiple stands) for arriving aircraft, (2) the allocation of runways for departing aircraft, and (3) the aircraft taxiing routes and the GSV routes for serving the aircraft.
1.1. Related Works
Researchers have presented methodologies to manage the operations of aircraft from landing to takeoff. For example, the runway scheduling problem focuses on sequencing aircraft on runways and allocating their operation time intervals [7, 8]; the gate assignment problem designates a gate (or stand) for each aircraft, balancing the interests of the airport manager, airlines, and passengers [9–14]. This study focuses on the taxiing phase of aircraft, including the assignment of runways, apron areas, and taxiing routes for a fleet of aircraft.
Existing studies on the aircraft taxi scheduling problem are mainly based on the given arrival/departure times of aircraft. Various models have been published to determine taxiing routes and instruct different aircraft to pass through the same location at different times, with objectives such as minimizing the total taxi time [15–20], delay [21, 22], and energy consumption [23–25]. In terms of minimizing the total taxi time, Smeltink et al. [15] assumed that all aircraft follow fixed routes with given speed ranges and developed a model to optimize the sequence of aircraft to enter the same taxiway segment. Zou et al. [19] proposed an iterative two-stage strategy to preplan and dynamically update taxiing schedules under potential flight conflicts. Aircraft operational delays on the airport surface may propagate across the network, lowering passenger service levels [26]. To mitigate such delays, van Oosterom et al. [27] investigated the use of towing vehicles to minimize the maximum delay for towed aircraft while maintaining safe separation distances. Sustainability is also a prominent topic in the air transportation sector [28, 29]. For example, Yu et al. [23] reduced fuel consumption of aircraft by limiting unnecessary stops on taxiways, while Li et al. [24] incorporated distance, steering frequency, and collision avoidance into a route planning model to reduce carbon emissions.
Recent works have increasingly adopted multiobjective frameworks [30–36], addressing trade-offs among taxi time, energy consumption, and conflict resolution. Marín and Codina [30] extended an earlier single-objective model [16] by additionally considering conflicts between aircraft taxiing routes and the throughput of flights. Ravizza et al. [31] analyzed the trade-off between total taxi time and fuel consumption in generating conflict-free taxi routes. Ahmadi and Akgunduz [37] planned conflict-free routes for electric tractor–trailers to reduce taxiing time, delays, and fuel consumption.
Aircraft taxi conflicts are also a critical safety concern, and many studies focus on conflict prediction and resolution strategies. For example, Ma et al. [38] utilized a long short-term memory (LSTM) network to predict aircraft ground positions, and Tang et al. [39] combined Kalman filtering and K-means clustering to estimate taxi arrival times. Zhao et al. [40] used the improved A∗ algorithm to generate conflict-free shortest taxi paths for aircraft. Beyond route planning, conflict avoidance tactics include trajectory tracking [41], speed control [42], and pilot visual cues [43].
Existing studies mainly focus on scheduling aircraft taxiing timetables or resolving conflicts at the tactical level, without addressing strategic route planning while explicitly considering aircraft–GSV (A–V) interactions. This study aims at developing a strategic planning model that integrates both aircraft and GSV routes into a unified framework. It serves as a high-level airport surface design tool, facilitating the identification of high-conflict areas and evaluation of different conflict resolution tactics before real-time scheduling.
1.2. Motivation
Existing studies mainly optimize the aircraft taxiing schedules based on predetermined arrival and departure times. However, in reality, unexpected delays caused by extreme weather or special events are common [44–46], which disrupt the taxiing schedules and possibly bring more conflicts.
- •
It outputs the static routes for a fleet of aircraft/GSVs, which are not influenced by the arrival and departure times of aircraft.
- •
Not only the conflicts among aircraft taxiing routes but also those between aircraft taxiing routes and GSV routes are considered. The latter ones have rarely been considered in current literature.
The model prioritizes two objectives. The primary objective is to minimize the number of conflict points on the airport surface, including the aircraft–aircraft (A–A) and aircraft–GSV (A–V) conflicts. The secondary objective is to reduce the total distance from parked aircraft to terminals. These objectives reflect the priorities of the airport surface traffic manager: first to improve safety by reducing conflicts and then to utilize aircraft stands close to terminals for passengers’ convenience.
The strategic planning model serves as an analytical tool for airport designers to assess the spatial distribution of potential conflicts, supporting resource allocation for conflict resolution. Also, as a preliminary step for real-time operations, it provides candidate routes for airport traffic managers when selecting take-off runways and taxiways for departure aircraft, as well as apron areas and taxiways for arrival aircraft.
The remainder of this paper is organized as follows: Section 2 introduces the formulation of the route planning model using an illustrative example; Section 3 presents a real-world case study to validate the model; and in Section 4, we draw conclusions, discuss limitations, and propose potential directions for future research.
2. Model Formulation
2.1. Problem Description
- •
The airport diagram is predefined for an operational airport, including the runways, stands, taxiway segments for aircraft taxiing, and the roadways for GSV driving.
- •
Aircraft stands that are closely spaced are grouped into apron areas, which are considered as origins/destinations for aircraft taxiing, and locations for ground services.
- •
Taxiway segments are not necessarily directed, allowing aircraft to taxi in both directions.
- •
The aircraft and GSVs completely follow the planned routes.
The model optimally assigns apron areas to arriving aircraft from given runways, assigns runways to departing aircraft from given aprons, and selects their taxiing routes among a set of candidates. The aircraft demand considered in this study refers to the expected number of flight arrivals and departures aggregated over a planning period (e.g., one operational day). An aircraft taxiing route consists of a runway, an apron area, and a series of taxiway segments. After an arriving aircraft enters an apron area or before a departing aircraft leaves an apron area, GSVs are routed from their depots to apron areas to provide ground services. Unlike scheduling studies that determine individual timetables for aircraft based on given arrival and departure times, this study focuses on the strategic planning phase, generating aggregated taxiing routes for multiple aircraft while explicitly considering potential conflicts with GSVs.
The prioritized objectives of the model reflect the flight area safety and passenger convenience. The primary objective minimizes the summed weights for conflict points between aircraft and GSVs, including A–A and A–V conflicts. The weight assigned for a conflict point reflects the preference of the manager, that is, a higher weight implies that the certain conflict is less acceptable. Considering conflict reduction in aircraft taxi route optimization is an effective method to enhance flight punctuality and ensure the safe operation of flights [40].
The secondary objective is to minimize the distance from parked aircraft to terminals. According to the IATA, 90%–95% of departing passengers should board the aircraft via jet bridges [48]. Travel distance or walking time for boarding is widely used to quantify the satisfaction of passengers [13], and the use of ferries when the aircraft is parked at a remote stand degrades the passenger travel experience [11, 12, 14]. Hence, to enhance passenger satisfaction, the manager tends to utilize stands close to the terminals, such that as many passengers as possible can board/alight through jet bridges instead of ferry vehicles.
- 1.
A–A crossing conflict: two aircraft enter the same intersection from different directions within a short time interval.
- 2.
A–A head-on conflict: two aircraft enter the same taxiway segment in opposite directions within a short time interval.
- 3.
A–A rear-end conflict: two aircraft enter the same taxiway segment in the same direction within a short time interval, but the trailing one has a higher speed than the leading one.
- 4.
A–A push-out conflict: an aircraft is pushed out from an apron area, while another is passing by.
- 5.
A–V crossing conflict: a GSV crosses a taxiway segment, while an aircraft is taxiing on the segment.
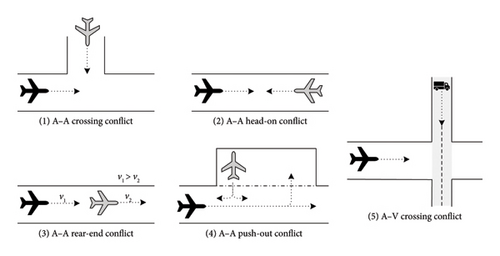
The abovementioned conflict points in the airport diagram are modeled using the approach in the following subsection.
2.2. Representation of the Airport Diagram and Conflict Points
The airport diagram is treated as a directed graph G = (N, A), where N and A denote the sets of nodes and arcs, respectively. As shown in Figure 2, nodes include runways, apron areas, and taxiway segments for aircraft taxiing. Note that a taxiway segment allowing two directions is separated as two different nodes, and head-on conflicts exist when both nodes are occupied. Arcs represent aircraft moving tracks from one node to another. Additional elements representing GSV routes are added, which are in conflict with certain arcs.
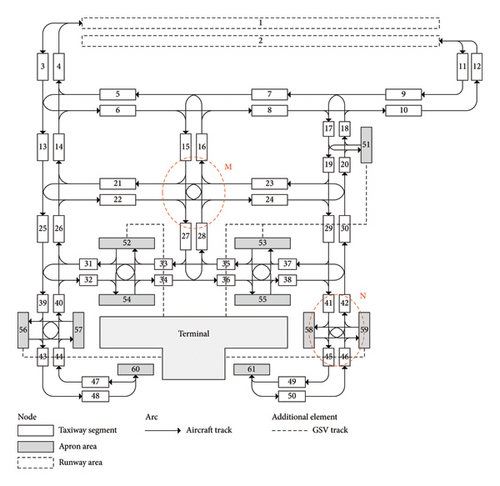
The types and locations of conflict points in dashed circles M and N in Figure 2 are further explained using Figure 3. The types and locations of conflict points in dashed circles M and N in Figure 2 are further explained using Figure 3. Taking arc a2 as an example: as in Figure 3(1), since a2 leads to node 24, it has a head-on conflict with the three arcs (c1, c2, and c3) originating from node 23. Note that nodes 23 and 24 represent opposite directions of the same taxiway segment. Likewise, since a2 originates from node 22, it also has head-on conflicts with two arcs (b1 and d1) directed toward node 21. Table 1 provides representative examples of conflict points in both regions. The conflict point analysis can be extended to other types of intersections, such as T-intersections, with appropriate modifications to arc configurations.
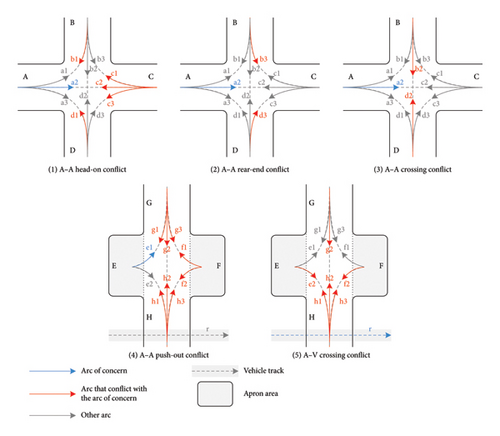
| Arc | Conflict with | Conflict type | Location |
|---|---|---|---|
| Circle M | |||
| a1 | b1, b2, b3 | A–A head-on | Segment B |
| c2, d1 | A–A head-on | Segment A | |
| c1, d2 | A–A rear-end | Segment B | |
| c3, d3 | A–A crossing | Intersection M | |
| a2 | c1, c2, c3 | A–A head-on | Segment C |
| b1, d1 | A–A head-on | Segment A | |
| b3, d3 | A–A rear-end | Segment C | |
| b2, d2 | A–A crossing | Intersection M | |
| Circle N | |||
| e1 | g1, g2, g3, h1, h2, h3, f1, f2 | A–A push-out | Intersection N |
| h1 | r | A–V crossing | Segment H |
The A–A and A–V conflict points can be easily modeled by setting up weights for the paired arcs and GSV routes. Let weight ua,b represents the A–A conflict between arc a and arc b whereas the weight va,h represents the A–V conflict between arc a and GSV route h. In practice, the weight set for a conflict point may represent the likelihood, severity, or resolution expense for the collision.
2.3. Model Formulation
Table 2 summarizes the notations of all sets, parameters, and decision variables involved in the proposed model.
| Input sets and parameters | |
|---|---|
| N | Set of nodes (taxiway segments, runways, and apron areas). |
| S | Set of runways, S⊆N |
| P | Set of apron areas, P⊆N |
| A | Set of arcs (movement tracks of aircraft). |
| H | Set of GSV routes. |
| Set of candidate aircraft taxiing routes between runway s and apron area p during arrival (departure) operations. | |
| fs | Number of arriving aircraft landed on runway s within the planning period. |
| gp | Number of departing aircraft from apron area p within the planning period. |
| cp | Number of aircraft stands in apron area p. |
| dp | Distance from apron area p to its nearest terminal. |
| ua,b | Weight of the A–A conflict point between arc a and arc b. If there is no conflict, ua,b = 0. |
| va,h | Weight of the A–V conflict point between arc a and GSV route h. If there is no conflict, va,h = 0. |
| δa,r | If arc a is included in aircraft route r, then δa,r = 1; otherwise, δa,r = 0. |
| σh,p | If apron area p is connected by GSV route h, then σh,p = 1; otherwise, σh,p = 0. |
| Decision variables | |
| xr | The number of aircraft assigned to route r. |
| ya | If arc a is used, then ya = 1; otherwise, ya = 0. |
| zh | If GSV route h is used, then zh = 1; otherwise, zh = 0. |
| Intermediate variables | |
| ms,p | The number of arriving aircraft originating from runway s and designated to apron area p. |
| np,s | The number of departing aircraft originating from apron area p and designated to runway s. |
The first and second terms of the objective function (1) are the weighted number of A–A and A–V conflict points, respectively, and the primary objective is to minimize their sum. Then, the third term indicates the secondary objective, which is to minimize the total distance from parked aircraft to terminals, conditional on the primary one. The coefficient ε is a small positive value to ensure that variations in the secondary objective have little impact on the primary one. The setup of ε depends on the numerical scales of both objectives. For example, if all weights ua,b and va,h are integer, setting ε to be less than 1/∑p∈Pdp·(cp + gp) is appropriate since it ensures that the contribution of the third term in equation (1) is always below one.
Constraints (2) and (3), respectively, calculate the number of arriving and departing aircraft between runways and apron areas. Constraints (4) and (5) ensure that all arriving and departing demands of aircraft should be satisfied. Constraint (6) indicates that the aircraft assigned to each apron area cannot exceed its capacity. Constraint (7) indicates that an arc remains active exclusively when aircraft are routed through it, denoted by M as a high positive numerical value. Constraint (8) indicates that a GSV route is in use only when its corresponding apron area is in use. Constraints (9) and (10) claim the non-negativity and binary types of the decision variables, respectively.
The proposed model is a mixed-integer quadratic programming (MIQP) problem, which can be effectively solved using commercial solvers like CPLEX. All scenarios outlined in this study can be solved via CPLEX on a server equipped with a 2.80 GHz Intel Core i9 CPU and 32.0 GB of RAM, accomplishing solutions within a 24 h timeframe.
2.4. Results of the Illustrative Example
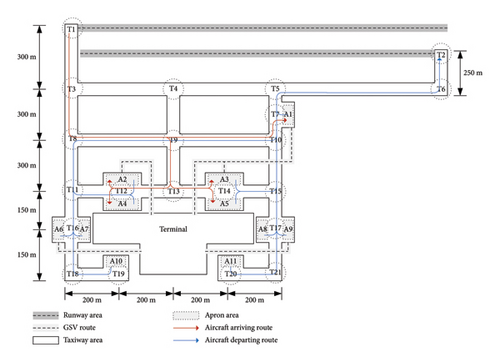
As shown in Figure 2, we validate the proposed model using the illustrative example. The illustrative example employed the same weights for all A–A and A–V conflicts. If arcs a and b are in A–A conflict, ua,b = 1; otherwise, ua,b = 0. If arc a and GSV route h are in A–V conflict, va,h = 1; otherwise, va,h = 0.
The candidate taxiing routes for aircraft arrival and departure are generated using the Yen’s algorithm [49]. This algorithm efficiently searches the top K shortest paths between two given nodes in a directed graph. In this example, we set K = 5, meaning that five candidate arriving (departing) taxiing routes are generated from each runway (apron area) to each apron area (runway). The candidate route generation process is purely based on the airport network topology and is independent of specific aircraft arrival and departure demands. Other algorithms may also be employed as long as they can generate feasible candidate paths.
The solution of the model provides detailed taxiing routes for arriving and departing aircraft and GSV routes, as depicted in Figure 4. Also, the solution comprises a total of 28 conflict points, including 22 A–A ones (4 rear-end and 18 push-out) and 6 A–V ones.
3. Case study: Shanghai Pudong International Airport (PVG)
3.1. Study Area and Case Settings
The proposed model is validated using the real-world case of PVG. As presented in Figure 5, the airport consists of two terminals and one satellite terminal, covering a total area of 1.456 million square meters. The real-world operations of aircraft taxiing at PVG are illustrated in Figure 6, based on one day of automatic dependent surveillance-broadcast (ADS-B) data. Figure 6(a) presents the taxiing routes of all arrival and departure aircraft, while Figure 6(b) shows a heatmap of trajectory points. The utilization patterns of taxiway segments and intersections are clearly observed, providing insights into high-traffic areas and potential conflict points, which help define the study area.
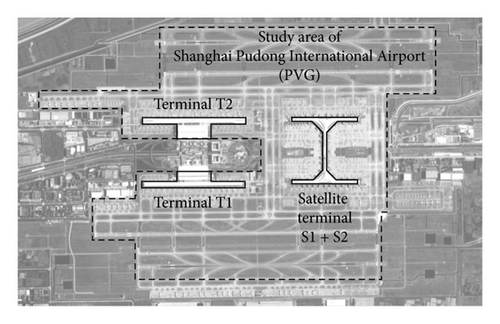
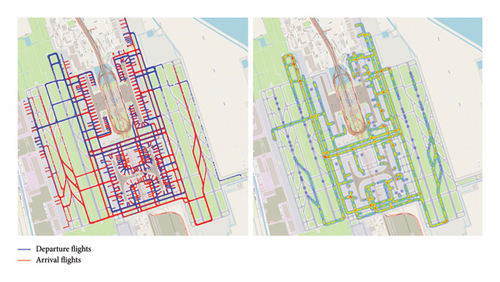
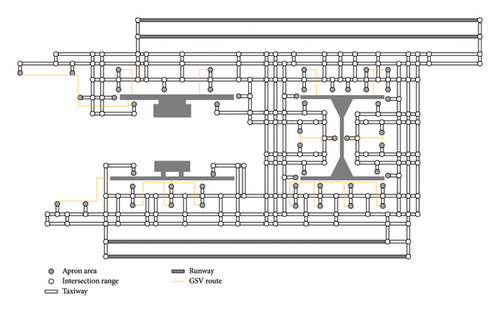
Figure 7 presents the directed graph for the PVG derived from real-world data, including 198 intersections, 631 taxiway nodes, 4 runway nodes (including two landing runways and two take-off runways), 52 apron area nodes (consisting of 254 aircraft stands), and 21 GSV routes for remote stands. Note that GSV routes for contact stands nearby the terminals are omitted. As in the illustrative example, we utilize the Yen’s algorithm (K = 20) to generate candidate routes for aircraft taxiing. The numbers of aircraft arrivals and departures are generated based on the real-world data of PVG in 2019.
3.2. Results and Discussion
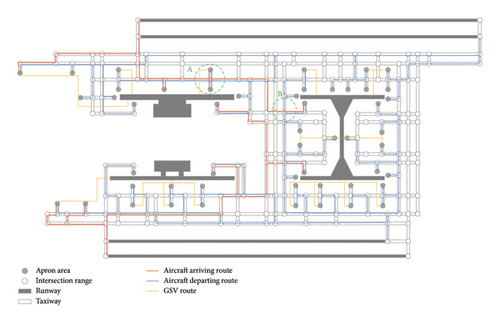
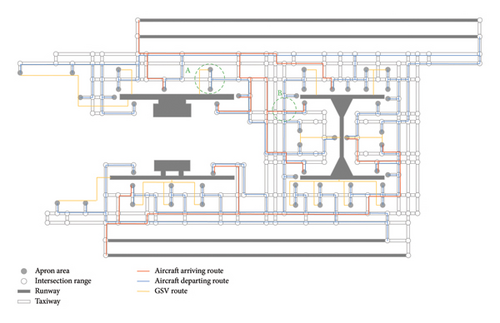
The model outputs the designated apron areas and runways (the directions are given) for arriving and departing aircraft, respectively, as well as their taxiing routes, which are illustrated in Figure 8. There are a total of 85 conflict points, including 76 A–A ones (5 head-on, 31 rear-end, 3 crossing, and 37 push-out) and 9 A–V ones. For example, the dashed circle A in Figure 8 is the intersection with the highest number of conflict points, including 7 push-out conflict points. The second highest is the one in dashed circle B, which generates 1 head-on, 1 crossing, and 1 rear-end conflict points.
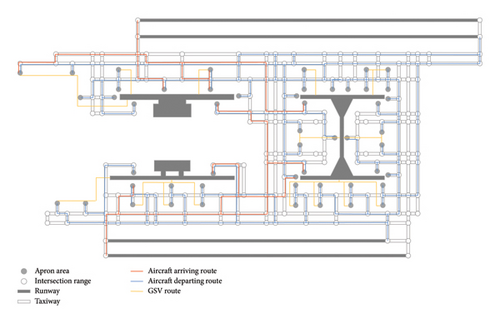
The model optimally selects an arriving or departing route for each pair of runway and apron area among various candidates (some are the shortest while some are subshortest), rather than utilizing the exact shortest route. For comparison, an alternative plan is proposed (referred to as the “all-shortest-route plan”) by setting up K = 1 in the Yen’s algorithm, and the output plan is illustrated in Figure 9. Compared with the “all-shortest-route plan,” the optimal one results in 29.2% fewer conflict points, including 4 A–A head-on, 3 A–A rear-end, 11 A–A crossing, 9 A–A push-out, and 8 A–V ones.
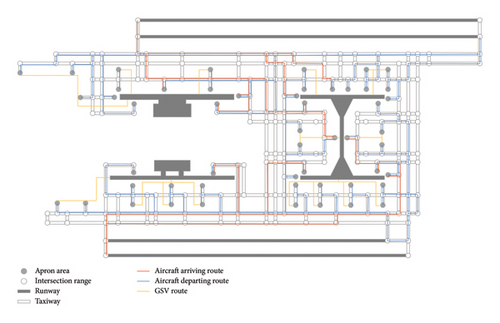
The manager naturally tends to instruct arriving aircraft to park in contact stands nearby the terminal buildings such that passengers can board and alight by boarding bridges instead of ferry vehicles. However, this leads to more conflict points between aircraft and GSVs. For comparison, Figure 10 presents a “nearest-stand plan”. It is generated by setting up the coefficient ε in the objective function (1) to a large value such that the total distance of parked aircraft to terminals becomes the primary objective. Compared with the “nearest-stand plan”, the optimal plan doubles the total parking distance of aircraft, while the number of conflict points reduces by 19.0%, including 4 A–A head-on, 5 A–A rear-end, 2 A–A crossing, 3 A–A push-out, and 6 A–V ones.
3.3. Analysis on Aircraft Demand
The proposed model also has the potential to facilitate demand management for airports. The sensitivities of conflict point number and stand-terminal distance to the demand of arriving aircraft are illustrated in Figure 11. Note that the number of aircraft should not exceed the total number of stands; otherwise, the problem is infeasible.
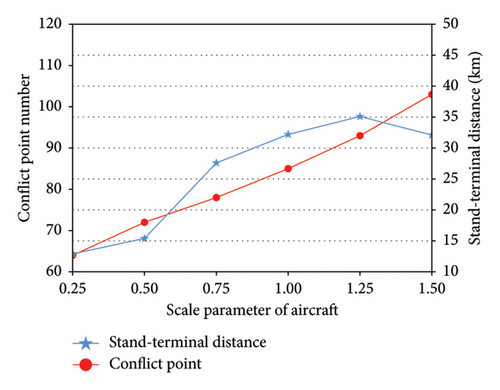
Generally, a higher demand for aircraft results in more conflict points on the airport surface. However, the secondary objective (i.e., total stand-terminal distance) does not necessarily increase with demand. Initially, as demand increases, the model allocates more remote stands to separate taxiing routes to minimize conflict points. Once most remote apron areas are occupied and demand continues to grow, the model shifts to consolidating aircraft into fewer apron areas and taxiing routes to reduce conflicts. This enables a greater utilization of contact stands close to the terminal, resulting in a decrease in total stand-terminal distance. For instance, when the demand scale parameter is 0.5, 13.9% of arriving aircraft are assigned to remote stands. This percentage increases to 27.5% when the scale parameter reaches 1.25 but decreases to 22.7% when the scale parameter reaches 1.5.
This analysis provides insights for airport designers in evaluating the service capacity of the airport. If the number of conflict points needs to be restricted within a certain threshold, the findings can be used to estimate the maximum number of aircraft that can be served under current infrastructure conditions. In addition, it supports long-term decision-making on capacity enhancement strategies, such as adding runways, expanding taxiway networks, or optimizing stand allocation policies.
3.4. Analysis on Management Preferences
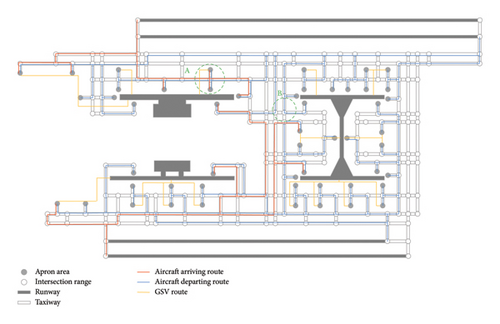
Here, we analyze the influences of the weights, which reflect the preferences of the airport’s surface traffic manager, on the planning results. Besides the basic scenario where all weights are set equal, Table 3 introduces two instance groups for comparison. Group I assumes that the manager aims to avoid potential conflicts at certain intersections (i.e., the circled regions A and B in Figure 8). Group II improves the weights for different types of conflict points, indicating that the manager tends to avoid them.
| Basic: equal weights (i.e., weights of all conflict points are set to 1) | |
| Group I: location-varying weights | |
| I-1 | Weights of conflict points in the dashed circle A in Figure 8 are set to a large number |
| I-2 | Weights of conflict points in the dashed circle B in Figure 8 are set to a large number |
| Group II: type-varying weights | |
| II-1 | Weights of A–A head-on conflicts are set to 2 |
| II-2 | Weights of A–A rear-end conflicts are set to 2 |
| II-3 | Weights of A–A crossing conflicts are set to 2 |
| II-4 | Weights of A–A push-out conflicts are set to 2 |
| II-5 | Weights of A–V crossing conflicts are set to 2 |
| II-6 | Weights of A–A head-on, crossing, push-out, rear-end, and A–V crossing conflicts are set to 4, 3, 2, 1, and 1, respectively |
The results reveal that Group I is able to reduce potential conflicts at specific intersections at the expense of generating more conflicts at other locations. As shown in Figure 12, compared with the basic instance, conflict points in intersection A reduce from 7 to 1 (with 1 unavoidable conflict point remaining). However, the total number of conflict points increases by 4.7% (from 85 to 89). In Figure 13, compared with the basic instance, intersection B successfully eliminates all conflict points, but the total number of conflict points increases by 3.5% (from 85 to 88), and the distance of stands increases by 18.3% (from 32.2 to 38.1 km).
By adjusting the conflict weights, Group II is able to reduce specific types of conflict points at the expense of generating more conflicts of other types, as shown in Table 4. For example, in Scenario II-1, increasing the weight of A–A head-on conflict points results in a reduction of 2 head-on ones but an increase of 2 rear-end, 4 push-out, and 1 A–V conflict points. In Scenario II-5, increasing the weight of A–V conflict points leads to a decrease of 1 A–V crossing one but an increase of 1 A–A head-on and 3 A–A rear-end conflict points. Scenario II-6 considers varying weights for different conflict types, reflecting the challenges associated with conflict resolution. For example, resolving A–A head-on or crossing conflicts may require aircraft to backtrack or hold position, leading to longer delays. In contrast, push-out, rear-end, and A–V conflicts can be mitigated more easily by temporarily pausing the movements of certain aircraft or GSVs. The model prioritizes conflict points based on the assigned weights.
| Type | Basic | II-1 | II-2 | II-3 | II-4 | II-5 | II-6 |
|---|---|---|---|---|---|---|---|
| A–A head-on | 5 | 3 | 4 | 5 | 6 | 6 | 3 |
| A–A rear-end | 31 | 33 | 24 | 30 | 39 | 34 | 42 |
| A–A crossing | 3 | 1 | 3 | 0 | 2 | 3 | 0 |
| A–A push-out | 37 | 41 | 47 | 40 | 30 | 34 | 33 |
| A–V crossing | 9 | 10 | 12 | 13 | 10 | 8 | 11 |
| Total | 85 | 88 | 90 | 88 | 87 | 85 | 89 |
- Note: Bolded number in each conflict type row indicates that the number of conflicts decreases when the weight of that type is increased.
Such analysis can assist route planning in practice. The managers can define the weights for conflict points at different locations or of different types based on the actual conditions. By comparing and evaluating the results of multiple experiments, the manager can ultimately select the most advantageous option.
4. Conclusion and Future Research
This study introduces a strategic planning model aimed at optimizing aircraft taxiing and GSV driving routes. An MIQP model is developed to integrally allocate apron areas and runways for arriving/departing aircraft, along with determining their taxiing routes. The primary objective minimizes the weighted number of conflict points to prioritize safety, while the secondary objective focuses on reducing the total distance from parked aircraft to terminals to improve passenger convenience.
The real-world case study indicates that the output plan can effectively reduce the number of conflict points. It automatically selects the optimal route from a set of candidates instead of utilizing the shortest ones; otherwise, 41.2% more conflict points would be produced. In addition, the generated plan surpasses the one directing aircraft to park as close as feasible to terminal buildings, in which 23.5% more conflict points are observed. Finally, multiple experiments suggest that the airport surface traffic manager can adjust the distribution of conflict points at various locations and of different types, aligning with distinct management preferences.
This study contributes to the research field of airport surface traffic management by strategically integrating both aircraft and GSV routes into a unified framework. Unlike existing studies focusing mainly on tactical scheduling or isolated aircraft taxiing optimization, this study addresses airport surface traffic from a strategic planning perspective while considering A–V interactions. The proposed route planning model enables airport designers to quantify the minimum number of conflict points between aircraft and GSVs and identify high-potential conflict areas under different design alternatives. In addition, it serves as a preliminary step for operational decision-making by providing candidate routes and conflict point information, supporting real-time taxiing route assignment and conflict resolution.
For future research, the proposed model could be extended to incorporate aircraft scheduling at conflict points by allocating separated time intervals. This would require accounting for dynamic changes in flight arrival and departure times, which are common in practice. In addition, it would be interesting to consider the cooperation and interactions among different types of GSVs (e.g., ferry vehicles, refueling trucks, and garbage trucks). Another extension is to evaluate the probability of collisions at each conflict point based on the flow volumes on routes, which may in turn influence the routing plan. Moreover, the development of customized algorithms is necessary for effectively solving the extended models.
Conflicts of Interest
The authors declare no conflicts of interest.
Funding
This study was supported by the National Key Research and Development Program of China (2021YFB1600100) and the Science and Technology Commission of Shanghai Municipality (22DZ1203300).
Open Research
Data Availability Statement
The data used to support the findings of this study are available from the corresponding author upon reasonable request.


