Intersection Complexity Quantification Considering Driver Behavior Characteristics and Subjective Cognition
Abstract
Intersections with high complexity often present an increased risk of accidents, thereby reducing traffic safety. Current models for measuring intersection complexity primarily focus on objective factors that influence intersection operation. However, they fail to consider the impact of intersection complexity on driver behavior or the feedback mechanism drivers exhibit in response to complex traffic environments at intersections. This study aims to investigate the intrinsic connection between driver behavior and intersection complexity. A real-vehicle experiment was conducted using three two-phase signal-controlled level intersections, each varying in objective complexity. Data on seven indices related to driver behavior characteristics and subjective cognition were collected from 28 participants during the experiment. Two methods were employed to analyze the data: (1) a descriptive analysis of driving behavior characteristics under varying levels of intersection complexity and (2) an entropy-object topologically comprehensive evaluation method for measuring two-phase intersection complexity based on driver behavior characteristics and subjective cognition. The results indicated that (1) drivers’ subjective perceptions of the complexity of two-phase signal-controlled intersections significantly differed from the calculated objective complexity, (2) differences in the effects of varying signal transition methods on driver behavior at complex intersections were not statistically significant, and (3) a two-phase intersection complexity measurement model based on driver behavior characteristics and subjective perceptions was developed and validated. These findings contribute to understanding the intrinsic relationship between driver behavior and intersection complexity in urban settings. Future research could integrate intelligent algorithms to enhance the safety of autonomous vehicles navigating intersections.
1. Introduction
In recent years, the research in the automotive field has increasingly focused on autonomous driving. Autonomous vehicles promise enhanced safety and comfort compared to human-driven vehicles and offer significant convenience to vulnerable populations. However, several challenges addressed before autonomous driving can achieve widespread adoption. While autonomous vehicles excel in communicating with one another and managing vehicle spacing and reducing carbon emissions [1] and driving decisions, they face difficulties in interpreting the driving behavior and decision-making of human drivers in mixed-traffic environments. This limitation can lead to traffic congestion or accidents, particularly in interactions with human drivers. Notably, young and middle-aged drivers often exhibit riskier driving behaviors compared to more experienced older drivers, further complicating the dynamics of mixed traffic. Addressing these challenges is crucial to ensure the safe and efficient integration of autonomous vehicles into existing road systems. Younger drivers are more likely to perceive risk than older drivers [2], but Harrington and McBride found that young and middle-aged drivers received more speeding tickets than older drivers for the same driving distance [3]. Therefore, studying the relationship between young and middle-aged drivers and the complexity of traffic environments and analyzing human drivers’ driving behavior decisions are particularly crucial.
Two-phase plane intersections are prevalent in many countries, serving as crucial nodes in urban road networks that connect various types of roads. They play an indispensable role in ensuring the smooth and healthy operation of the road network. However, two-phase signal control methods may lead to mutual interference and conflicts among various traffic flows at intersections, increasing vehicle delays and the likelihood of traffic collisions. This results in low functional stability of intersections and frequent traffic accidents [4]. Intersection delays have become a critical factor in vehicle travel delays [5]. Statistics from many countries abroad show that more than 50% of traffic accidents occur at intersections, and over the years, the number of accidents at intersections has grown faster than other accidents [6]. Furthermore, it is internationally recognized that drivers are often held responsible for traffic accidents due to operational errors. The research by the International Association for Driver Behavior Studies [7] indicates that driver factors account for over 80% of traffic accident liability (with France at 85.5%, the United States at 90%, Japan at 94%, Sweden at 81.1%, and Spain at 92%). Local issues at intersections (such as congestion and accidents) can quickly spread to surrounding areas in a nonlinear manner, causing short-term functional damage to the entire road network and severely limiting the service level and carrying capacity of urban road traffic systems.
The purpose of this study is to investigate the quantitative relationship between intersection complexity and the behavior of young and middle-aged drivers, with the goal of providing a theoretical foundation for autonomous vehicles to assess human driving decision-making. A two-phase signal-controlled intersection was used as a case study. To address this issue, a real-world vehicle experiment was conducted. An entropy-object topology model was developed to examine the interplay between intersection complexity and driver behavior characteristics, along with subjective perceptions. The entropy-object topology model combines the objective weighted advantages of the entropy weight method with the flexibility and systematicness of extension matter-element model and can deal with the comprehensive evaluation problem of multi-index complex systems scientifically and comprehensively. This model aims to enhance the understanding of how intersection complexity influences driver behavior, ultimately aiding in the integration of autonomous vehicles in mixed traffic environments. This model seeks to capture the impact of key decision factors, including driver’ subjective evaluation outcomes, heart rate growth rate (HRGR), standard deviation of NN intervals in normal heartbeats (SDNN), average speed, jerk standard deviation (jerk SD), gaze fixation rate, and scanning speed indicators.
2. Literature Review
Traffic scene complexity refers to the cognitive load experienced by drivers under varying driving conditions, as well as the level of vehicle control required to maintain safe driving under such cognitive demands. This study aims to quantify the relationship between the complexity of planar intersections and driver behavior, offering insights into how cognitive load and control difficulty influence driver actions in these environments. Many researchers have characterized intersection complexity using static environmental factors. For instance, the presence and status of traffic signals significantly influence intersection complexity [8]. Additionally, parked vehicles on both sides of the road also increase the difficulty for drivers when navigating through the next intersection [9]. Some scholars utilized satellite imagery and deep learning systems to extract features such as intersection type, size, shape, and lane markings, analyzing intersection complexity accordingly [10]. They found that drivers exhibit more frequent risky driving behaviors at four-way intersections compared to three-way intersections. There is a strong correlation between the complexity of intersection, the traffic conflict in intersection, and the geometry of intersection. Some scholars also found that road characteristics have a significant impact on the frequency of collision accidents [11]. Furthermore, the complexity of different turning behaviors at intersections also varies [12].
However, solely relying on static environmental factors to describe intersection complexity is overly simplistic and inadequate. The activities of drivers during the driving process constitute a dynamic aspect, necessitating consideration of dynamic influencing factors around vehicles, such as changes in traffic flow [13], traffic density, and vehicle lane changes at intersections. With the increase of traffic flow, intersection complexity gradually increases, leading to a linear increase in driver workload. If vehicles change lanes ahead in the drivers’ field of view, the drivers’ workload also increases [14]. There are also some scholars constructed intersection scenarios using driving simulators and adjusted intersection complexity by varying vehicle and pedestrian densities [15]. They found that when both vehicle and pedestrian densities are lowest, complexity is minimal, whereas complexity increases with higher densities of both. Indeed, traffic density and the presence of pedestrian crossings are important factors affecting intersection complexity [16]. When it is in the peak hours, the complexity of the signalized intersection and the driving load of the driver increase significantly [17]. The number of conflict points and the probability of conflicts at intersections are also crucial aspects defining intersection complexity [5]. Moreover, the intersection complexity is significantly related to driver psychological workload [9, 12, 14, 18–20]. Physiological parameters such as electrocardiograms (ECGs), skin conductance, electroencephalograms, and gaze behavior can be used to predict driving load at intersections of different complexity levels [15, 21]. Some studies have also investigated the effects of age and complexity on driving behavior. In complex environments, older drivers tend to drive more slowly [22], facing greater challenges compared to younger drivers under such conditions [18]. Some studies have showed that weather conditions will seriously affect the complexity of intersections. For example, rain and fog will lead to insufficient optical fiber, which will affect the driver’s visual information and increase the driver’s driving difficulty [23]. Relevant research [24] suggests that vision is the main sensory organ of the driver. During the driving process, the drivers’ attention level will affect the visual information processing and reaction time. In addition, some scholars have found that drivers’ visual scanning behavior and attention allocation vary with the complexity of intersections [25]. There are also significant differences in driving behavior when drivers complete different steering behaviors at intersections [26].
In summary, the existing research predominantly examines the relationship between intersection complexity and individual driving behavior, without addressing the specific effects of varying intersection complexities on multiple driver behaviors or the feedback mechanisms between driver behavior and intersection complexity. Investigating the quantitative relationship between intersection complexity and driving behavior can help refine complexity indicators, providing a more accurate reflection of the impact of intersection operations on both vehicles and drivers.
3. Data Collection
3.1. Participants
In this study, a significant level of 10% is chosen to reflect the 90% confidence level of the unknown parameter; when the confidence level is 90%, Z is 1.25; the value of σ ranges from 0.25 to 0.50, and due to the limitation of the number of people in the real car experiment, the value of 0.35 is taken in this paper; E is 10%. Therefore, the minimum sample size required for this experiment is 19.
In this experiment, 30 young and middle-aged experienced drivers were randomly recruited as subjects, among which experimental data were missing for two people due to equipment failure and sensor power depletion. Valid experimental data were obtained for 28 subjects (aged 22–40, M = 25.21, SD = 3.91, 21 males and seven females), which satisfied the minimum sample size required for the experiment.
3.2. Equipment
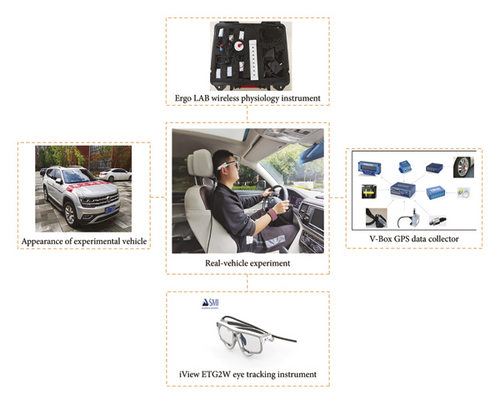
A 7-seat Volkswagen Touareg SUV was selected as the experimental vehicle. Vehicle operation data were collected using a V-Box GPS data collector at a frequency of 20 Hz. This system employs satellite technology to provide real-time vehicle positioning, measuring instantaneous speed and displacement, and recording parameters such as acceleration and deceleration in both transverse and longitudinal directions, lateral offset, and elevation at the vehicle’s location. Drivers’ eye movement behavior was captured using the iView ETG2W eye-tracking device, which records every eye movement. Equipped with binocular tracking and automatic parallax compensation, the system ensures reliable and accurate eye movement trajectory data. Drivers’ ECG data were collected using the ErgoLAB wireless physiological monitoring system at a frequency of 512 Hz. This system captures raw ECG signals through wireless radiofrequency technology, ensuring that the naturalness of the drivers’ behavior remains unaffected during data collection. All the experimental equipment is shown in Figure 1.
3.3. Scenarios
After conducting a survey on five two-phase signal-controlled intersections in Chenggong District, Kunming City, Yunnan Province, the investigation encompassed aspects such as signal timing, traffic flow at each entry road, and functional division (see Table 1).
| Two-phase level intersection parameters | Zhiyuan Road–Yuehua Street intersection | Zhiyuan Road–Langxi Street intersection | Zhiyuan Road–Wanqing Road intersection | Wanqing Street–Wanfeng Street intersection | Boda Road–Wanfeng Street intersection | ||
|---|---|---|---|---|---|---|---|
| Signal control timing | First phase | Red light duration (s) | 28 | 32 | 44 | 48 | 24 |
| Green light duration (s) | 29 | 25 | 31 | 45 | 21 | ||
| Second phase | Red light duration (s) | 32 | 28 | 34 | 48 | 24 | |
| Green light duration (s) | 25 | 29 | 41 | 45 | 21 | ||
| Yellow light duration (s) | 3 | 3 | 3 | 3 | 3 | ||
| Full red duration (s) | — | — | 3 | — | 3 | ||
| Traffic organization | East import flow (pcu/h) | Straight | 8 | 2 | 110 | 16 | 30 |
| Left turn | 148 | 64 | 24 | 48 | 16 | ||
| Right turn | 4 | 28 | 164 | 20 | 44 | ||
| South import flow (pcu/h) | Straight | 80 | 74 | 52 | 88 | 20 | |
| Left turn | 16 | 60 | 40 | 40 | 20 | ||
| Right turn | 196 | 24 | 8 | 32 | 4 | ||
| West import flow (pcu/h) | Straight | 14 | 2 | 108 | 24 | 8 | |
| Left turn | 48 | 48 | 4 | 4 | 36 | ||
| Right turn | 8 | 20 | 44 | 132 | 32 | ||
| North import flow (pcu/h) | Straight | 88 | 40 | 44 | 70 | 96 | |
| Left turn | 8 | 4 | 168 | 4 | 28 | ||
| Right turn | 12 | 36 | 16 | 8 | 68 | ||
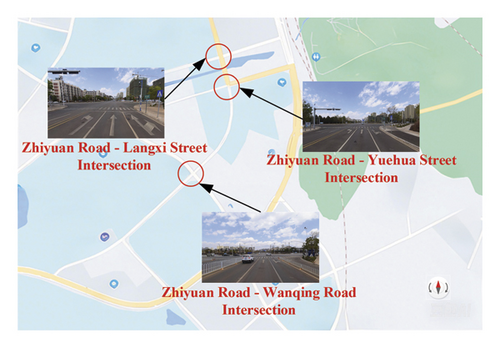
The calculated objective complexities for the five two-phase signal-controlled intersections for motor vehicles are as follows: Zhiyuan Road–Yuehua Street intersection has an objective complexity value of 0.447, Zhiyuan Road–Langxi Street intersection has a value of 0.192, Wanqing Road–Wanfeng Street intersection has a value of 0.312, Boda Road–Wanfeng Street intersection has a value of 0.225, and Zhiyuan Road–Wanqing Road intersection has a value of 0.953. Considering the differentiation of experimental scenarios, intersections with more distinct complexity levels—Zhiyuan Road–Yuehua Street, Zhiyuan Road–Langxi Street, and Zhiyuan Road–Wanqing Road—were chosen as the experimental settings (see Figure 2). As shown in Table 1, L3 represents the highest target complexity, and L1 represents the lowest target complexity.
3.4. Driving Behavior Characteristic Indexes
- 1.
Eye-movement characteristics: gaze duration, gaze number, pupil diameter, sweep speed, and sweep amplitude
- 2.
Psychophysiological characteristics: SDNN, root mean square of the difference between two adjacent NN intervals (RMSSD), percentage of adjacent sinus RR intervals with a difference greater than 50 ms (pNN50), normalized low frequency band power (LFnorm), ratio of low frequency band power to high frequency band power (LF/HF), and HRGR
- 3.
Operation behavior characteristics: average speed, coefficient of speed variation, and Jerk SD
3.5. Procedure
The formal experiment took about 1 h in total and consisted of the following four steps. Firstly, the experimental vehicle was equipped with a V-Box GPS data collector to guide the subjects to fill out the basic driver information collection form, and the staff put on the iView ETG2W eye-tracking device and Ergo LAB wearable wireless physiological device for the subjects. Secondly, the subject spent 5 min familiarizing themselves with the operating performance of the experimental vehicle to prevent interference with the experimental results due to subject errors during the experiment. The subjects were then asked to keep their heads as stable as possible to reduce errors introduced by the acquisition device and to obey their driving habits and local traffic laws. Under the guidance of the staff, three experiments were carried out through three intersections in turn, considering the influence of traffic lights at the intersections. In case of emergency, measures including variable speed and the parking brakes should be taken to ensure the safety of the vehicle. The experimental data were collected synchronously by the experimentalists. Finally, for each completed experimental scenario, subjects drove the experimental vehicle to a temporary stop at the roadside and finished the Intersection Complexity Subjective Questionnaire [30] for the two-phase planar intersection they had just passed. At the end of the experiment, the staff paid the subjects RMB 200 yuan for the experiment.
4. Methodology
4.1. Four-Dimensional Subjective Intersection Complexity Evaluation
4.2. Significance Test for Indexes
A single-factor repeated measures analysis of variance was applied to examine the significance of psychophysiological characteristics, operational behavior characteristics, and eye-movement behavior characteristics of drivers across three distinct settings (L1, L2, and L3) under various signal transition modes. This approach served to mitigate any potential cross-index interference and ensure the attainment of objective and reliable assessment outcomes. The variance–covariance matrix of the dependent variables in Mauchly’s sphericity test demonstrated equality, while the results of the Shapiro–Wilk test conformed to a normal distribution (p > 0.05). The significance of each index is detailed in Table 2.
| Scenarios’ indexes | Green light | Red light turns green | ||||||
|---|---|---|---|---|---|---|---|---|
| L3 | L2 | L1 | L3 | L2 | L1 | |||
| Psychophysiological characteristics | HRGR | Average | 0.094 | 0.101 | 0.096 | 0.088 | 0.087 | 0.090 |
| F | 2.543 | 2.121 | ||||||
| p | 0.066∗ | 0.089∗ | ||||||
| SDNN | Average | 30.941 | 40.581 | 48.804 | 39.681 | 51.867 | 43.166 | |
| F | 2.504 | 2.794 | ||||||
| p | 0.067∗ | 0.059∗ | ||||||
| RMMSSD | Average | 33.515 | 32.387 | 32.230 | 33.696 | 35.540 | 33.996 | |
| F | 0.068 | 0.185 | ||||||
| p | 0.935 | 0.832 | ||||||
| pNN50 | Average | 13.999 | 10.195 | 14.905 | 13.349 | 14.622 | 14.138 | |
| F | 1.394 | 0.196 | ||||||
| p | 0.258 | 0.823 | ||||||
| LFnorm | Average | 68.679 | 66.054 | 66.491 | 65.704 | 72.744 | 65.572 | |
| F | 0.127 | 0.484 | ||||||
| p | 0.881 | 0.619 | ||||||
| LF/HF | Average | 6.698 | 5.095 | 5.129 | 8.335 | 4.800 | 5.266 | |
| F | 0.305 | 0.765 | ||||||
| p | 0.738 | 0.471 | ||||||
| Driving operation behavior characteristics | Average speed | Average | 42.757 | 36.265 | 39.277 | 16.240 | 28.275 | 25.307 |
| F | 2.902 | 2.311 | ||||||
| p | 0.057∗ | 0.076∗ | ||||||
| Coefficient of speed variation | Average | 0.203 | 0.220 | 0.217 | 1.098 | 0.931 | 0.893 | |
| F | 0.047 | 1.689 | ||||||
| p | 0.954 | 0.195 | ||||||
| Jerk SD | Average | 5.457 | 6.794 | 5.909 | 2.406 | 3.904 | 4.543 | |
| F | 5.521 | 9.292 | ||||||
| p | 0.007∗∗ | < 0.001∗∗ | ||||||
| Eye-movement characteristics | Gaze duration | Average | 201.103 | 202.815 | 249.399 | 231.418 | 256.924 | 245.088 |
| F | 4.329 | 0.550 | ||||||
| p | 0.018∗∗ | 0.580 | ||||||
| Gaze number | Average | 23.964 | 34.500 | 30.679 | 20.643 | 29.607 | 22.357 | |
| F | 3.105 | 2.711 | ||||||
| p | 0.050∗ | 0.061∗ | ||||||
| Pupil diameter | Average | 2.843 | 2.861 | 2.903 | 2.876 | 2.836 | 2.866 | |
| F | 1.095 | 0.231 | ||||||
| p | 0.342 | 0.795 | ||||||
| Sweep amplitude | Average | 4.429 | 3.936 | 3.763 | 5.908 | 5.398 | 4.738 | |
| F | 0.739 | 1.493 | ||||||
| p | 0.483 | 0.235 | ||||||
| Sweep speed | Average | 93.816 | 121.795 | 108.592 | 119.876 | 130.221 | 107.412 | |
| F | 3.196 | 3.31 | ||||||
| p | 0.052∗ | 0.045∗∗ | ||||||
- ∗significant at 0.1 level (two-tailed).
- ∗∗significant at 0.05 level (two-tailed).
Notably, the results in Table 2 indicate that HRGR, SDNN, average speed, Jerk SD, number of gazes, and sweep speed indexes exhibited noteworthy distinctions during the transition from a red to green signal and under the green light signal. Given that the study pertains to the measurement of objective conflict and subjective evaluation in urban road two-phase controlled level intersections, the subjective evaluation of drivers’ complexity within this setting is integrated into the assessment index system. Consequently, the final selected evaluation indexes encompass HRGR, driver’ subjective evaluation results, SDNN, average speed, Jerk SD, number of gazes, and sweep speed indexes.
4.3. Construction of Entropy-Object Topologically Comprehensive Evaluation Model
The comprehensive evaluation method adeptly addresses a range of issues, such as the complexity and diversity of evaluation factors, the differing levels and categories of indicators, and the uncertainties within the evaluation standards. The extension evaluation method, originating from the superiority evaluation in extension theory, resolves the ambiguity in multi-indicator weight allocation during the assessment process. It maintains excellent balance, capable of identifying demarcation points between different properties and accurately representing the strength of the evaluated object’s specified attributes. Considering the attributes and evaluation objectives of urban road two-phase signal-controlled intersections, this study employs the entropy weight–matter-element extension comprehensive evaluation method to establish a comprehensive evaluation model for the complexity of urban road two-phase intersections. The evaluation steps are as follows:
4.3.1. Determining the Object Element to be Evaluated
4.3.2. Determining the Classical Domain and Nodal Domain
4.3.3. Relevance Calculation
If Kj(vi) ≥ 0, then the index belongs to Grade j; if Kj(vi) < 0, then the index does not belong to Grade j.
4.3.4. Determining Index Weight by Entropy Method
4.3.5. Integrated Correlation Calculation
5. Results
5.1. Four-Dimensional Subjective Intersection Complexity Evaluation
Based on drivers’ subjective evaluation of intersection complexity, a four-dimensional intersection complexity function was constructed from four perspectives: perception, decision-making, manipulation, and resulting consequences, and a comprehensive score of drivers’ perception of the complexity of each intersection was calculated. Comparison of the four-dimensional subjective evaluation of the driver and the objective complexity of the intersection values is shown in Table 3. Drivers subjectively ranked the intersection complexity from highest to lowest as L2, L1, and L3, which is inconsistent with the objective evaluation results obtained from the simplified model of the intersection complexity calculated based on the number of conflict points and conflict probability. It shows that the objective complexity of intersections alone cannot accurately reflect the true operating conditions of intersections and their impact on driver behavior.
| Scenarios | Subjective evaluation | Objective complexity value |
|---|---|---|
| Zhiyuan Road–Wanqing Road intersection (L3) | 0.216 | 0.953 |
| Zhiyuan Road–Yuehua Street intersection (L2) | 0.254 | 0.447 |
| Zhiyuan Road–Langxi Street intersection (L1) | 0.235 | 0.192 |
5.2. Impacts of Objective Complexity of Intersections on Driving Behavior Characteristics
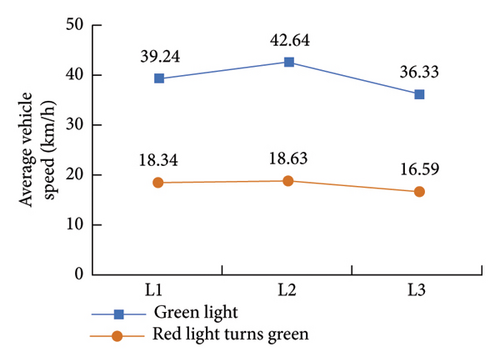
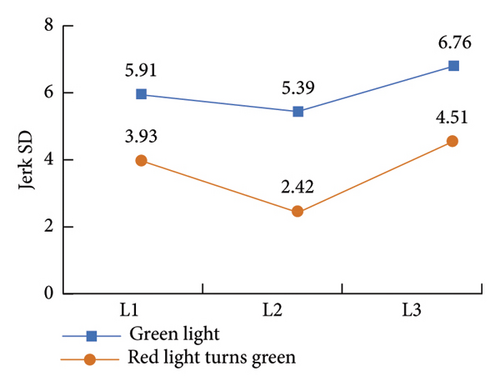
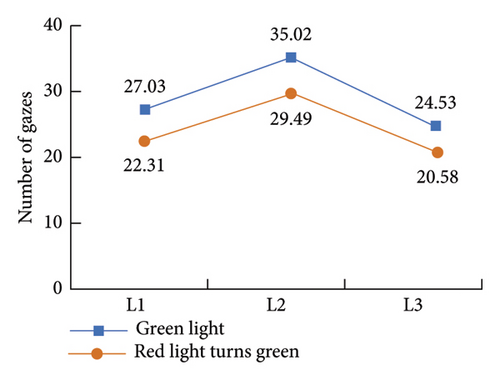
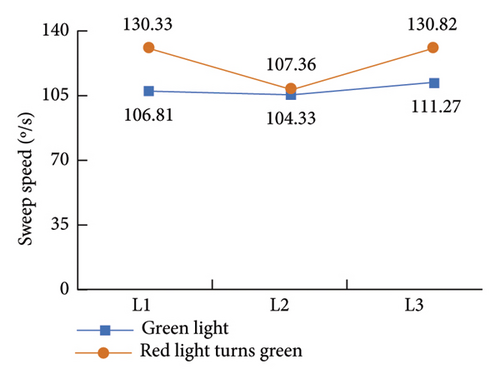
The HRGR, SDNN, average speed, Jerk SD, gaze number, and sweep speed metrics of the drivers in the experiment were collected, as shown in Figure 3.
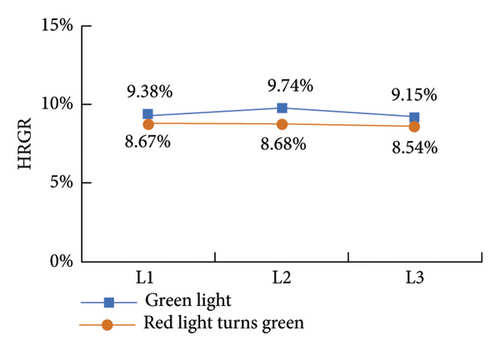
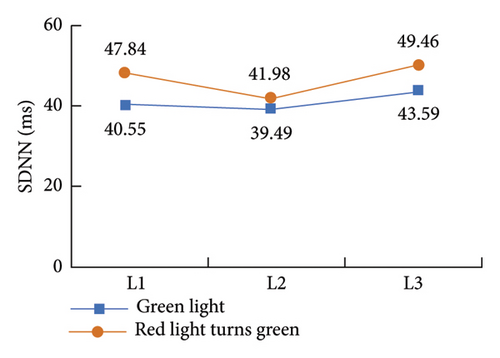
HRGR represents the drivers’ heart rate increment, which not only characterizes the drivers’ emotional stress in intersection environments of varying complexity but is also closely related to cognitive load. A higher HRGR indicates an increase in both emotional stress and cognitive load, as the driver’s physiological response reflects the mental effort required to process and respond to the driving environment [31]. SDNN, on the other hand, reflects the balance between sympathetic and parasympathetic tone in the human body and is negatively correlated with the driver’s emotional tension level and cognitive load [32]. As shown in Figures 3(a) and 3(b), the change trends of the subjects’ HRGR and SDNN indexes were the same for the green light and red light turning green situations, with the HRGR indexes decreasing and the SDNN indexes increasing in the order of the objective complexity of the intersection L2, L1, and L3, indicating that the subjects’ emotional tension level and cognitive load level when facing the complex environment of the intersection gradually increased in the order of the objective complexity of the intersection L3, L1, and L2, and did not show a regular change with the increase of the objective complexity of the intersection. In addition, the subjects’ HRGR and SDNN index values were better in the red to the green light situation than in the green light situation, indicating that the subjects showed more pronounced nervousness and higher cognitive load when the intersection complex intersects in the green light situation.
Related studies have showed that a lower average speed is beneficial for driving safety (Aarts and Van Schagen, 2006). Jerk SD is the standard deviation of the first-order derivative of acceleration with respect to time and can characterize the stability of the drivers’.
Vehicle’s driving state [33]: It is positively correlated with the drastic degree of change in vehicle driving status and negatively correlated with the stability of the drivers’ physiological state and driving comfort. It can be seen in Figures 3(c) and 3(d) that the average speed indexes of the subjects under green light and red light turning green decreased in the order of objective complexity of intersections L2, L1, and L3, and the Jerk SD indexes increased in the order of objective complexity of intersections L2, L1, and L3, indicating that the subjects’ driving safety level and driving comfort when facing the complex environment of intersections gradually increased in the order of objective complexity of intersections L3, L1, and L2, and did not keep in line with the changing pattern of objective complexity of intersections. Furthermore, the average speed and Jerk SD indexes of the subjects in the red-to-green situation were lower than those in the green situation in the same scenario, indicating that drivers have higher driving safety and lower driving comfort through complex intersections in the red-to-green situation.
The number of gazes refers to the number of times the subject looked in the direction of observation during the selected task period, which can reflect the drivers’ area of interest, characterize the visual load of the driver during driving, and are positively correlated with visual load [34]. The sweep speed reflects the efficiency of searching for targets in the process of sweep and is negatively correlated with the amount of traffic information required by the driver during travel [35]. From Figures 3(e) and 3(f), it can be seen that the subjects’ gaze count indexes decreased in the order of objective complexity of intersections L2, L1, and L3 under the green light and red light turning green, and the sweep speed indexes increased in the order of objective complexity of intersections L2, L1, and L3, indicating that the subjects’ visual load and information search efficiency gradually increased in the order of objective complexity of intersections L3, L1, and L2 when facing the complex environment of intersections, and did not keep in line with the changing pattern of objective complexity of intersections.
Independent samples’ t-test was used to analyze the variability of HRGR, SDNN, average speed, Jerk SD, number of gaze, and sweep speed indexes of drivers under different signal transition methods, as seen in Table 4.
| Scenarios | HRGR | SDNN | Average speed | Jerk SD | Number of gazes | Sweep speed | |
|---|---|---|---|---|---|---|---|
| L1 | Green light | 9.38% | 40.55 | 39.24 | 5.91 | 27.03 | 106.81 |
| Red light turns green | 8.67% | 47.84 | 18.34 | 3.93 | 22.31 | 130.33 | |
| p value (two-tailed) | 0.662 | 0.576 | 0.001∗∗ | 0.051∗ | 0.239 | 0.643 | |
| L2 | Green light | 9.74% | 39.49 | 42.64 | 5.39 | 35.02 | 104.33 |
| Red light turns green | 8.68% | 41.98 | 18.63 | 2.42 | 29.49 | 107.36 | |
| p value (two-tailed) | 0.356 | 0.718 | 0.018∗∗ | 0.004∗∗ | 0.501 | 0.514 | |
| L3 | Green light | 9.15% | 49.46 | 36.33 | 6.76 | 24.53 | 111.27 |
| Red light turns green | 8.54% | 43.59 | 16.59 | 4.51 | 20.58 | 130.82 | |
| p value (two-tailed) | 0.757 | 0.376 | 0.014∗∗ | 0.032∗∗ | 0.692 | 0.369 | |
- ∗significant at 0.1 level (two-tailed).
- ∗∗significant at 0.05 level (two-tailed).
From the variance analysis, it is known that the variability of HRGR, SDNN, gaze count, and sweep speed are not significant under different signal control modes, and only the mean value of vehicle speed and Jerk SD indexes are significantly different. Analyzing the reasons, it can be found that in the red light to the green situation, the driver needs to start the vehicle from the stagnant state with zero initial speed and accelerate it to the driving state in order to pass through the intersection smoothly, and the movement state of the vehicle changes significantly, so the difference with the green light situation is significant, and the value cannot be used as the basis for judgment. As a result, this paper concludes that the impact of different signal transition methods on driving behavior through the complex environment of the intersection has not reached significant differences.
5.3. Entropy-Object Topologically Comprehensive Evaluation
The seven evaluation indexes, including intersection complexity subjective evaluation, HRGR, SDNN, average speed, Jerk SD, number of gazes, and sweep speed, were classified into five levels: very simple, simple, general, complicated, and very complicated. The evaluation indexes are dimensionless and expressed in the form of physical elements (see Equation (4)). The K-means clustering algorithm is used to calculate the clustering interval of the index data, calculate the classical domain and the nodal domain, and determine the range of values for each level of the evaluation set (see equations (5) and (6)). The correlation degree and weight of each index were calculated according to equations (5)–(9), and the comprehensive correlation degree was calculated according to equation (12). Take L3 as an example for calculation, as shown in Table 5.
| Indexes | Very complicated | Complicated | General | Simple | Very simple |
|---|---|---|---|---|---|
| Subjective evaluation | (0, 0.26) | (0.26, 0.45) | (0.45, 0.63) | (0.63, 0.82) | (0.82, 1) |
| HRGR | (0, 0.21) | (0.21, 0.42) | (0.42, 0.64) | (0.64, 0.84) | (0.84, 1) |
| SDNN | (0, 0.19) | (0.19, 0.34) | (0.34, 0.56) | (0.56, 0.79) | (0.79, 1) |
| Average vehicle speed | (0, 0.24) | (0.24, 0.45) | (0.45, 0.65) | (0.65, 0.83) | (0.83, 1) |
| Jerk SD | (0, 0.21) | (0.21, 0.39) | (0.39, 0.57) | (0.57, 0.82) | (0.82, 1) |
| Number of gazes | (0, 0.18) | (0.18, 0.44) | (0.44, 0.69) | (0.69, 0.88) | (0.88, 1) |
| Sweep speed | (0, 0.21) | (0.21, 0.52) | (0.52, 0.72) | (0.72, 0.83) | (0.83, 1) |
From the calculation results in Table 6 and according to equation (13), the complexity of L3 is “general.” The same reason can be obtained in the entropy power–object topology comprehensive evaluation model of urban road two-phase control level intersection complexity evaluation results of Scenario L2 and Scenario L1, the entropy power–object topology comprehensive evaluation results of the three scenarios are shown in Table 7.
| Indexes | Very complicated | Complicated | General | Simple | Very simple |
|---|---|---|---|---|---|
| Subjective evaluation | −0.037962 | −0.028897 | 0.013431 | −0.001855 | −0.023733 |
| HRGR | −0.037776 | −0.031764 | 0.019122 | 0.010339 | −0.020071 |
| SDNN | −0.120557 | −0.052442 | 0.058473 | −0.158016 | −0.205211 |
| Average vehicle speed | −0.038191 | −0.008310 | 0.018191 | −0.042761 | −0.055577 |
| Jerk SD | −0.056345 | −0.027199 | −0.012704 | −0.041013 | −0.068406 |
| Number of gazes | −0.086312 | −0.066851 | 0.028768 | −0.020866 | −0.057287 |
| Sweep speed | −0.124585 | −0.106665 | 0.070145 | −0.018141 | −0.037853 |
| Integrated correlation | −0.501728 | −0.322128 | 0.195424 | −0.272313 | −0.468137 |
| Scenario L1 | Scenario L2 | Scenario L3 | ||
|---|---|---|---|---|
| Integrated correlation | Value | 0.129119 | 0.117081 | 0.195424 |
| Level | General | General | General | |
As observed in Table 7, the intersection complexity is ranked from L3, L1, and L2 in order of entropy-object topologically comprehensive assessment model, and the intersection complexity is “general.” Compared with the existing simplified intersection complexity model based on the number of conflict points and conflict probability, a two-phase level intersection complexity measurement model based on the characteristics of driver behavior and subjective cognition is constructed based on the entropy-object topologically comprehensive evaluation method, which establishes the quantitative relationship between driver behavior and urban road level intersection complexity and proposes the classification criteria of complexity level.
6. Discussions
The main objective of this paper is to construct a two-phase level intersection complexity measurement model based on the behavioral characteristics and subjective perceptions of drivers using an entropy-object topologically comprehensive evaluation method. Real-vehicle intersection experiments were designed to collect driver behavior data and driver subjective questionnaire results and to conduct difference analysis on the index values and subjective evaluation results of corresponding psychophysiological behavioral characteristics, eye-movement behavioral characteristics, and driving operation behavioral characteristics of different types of drivers in each scenario.
We found significant differences in driver behavioral characteristics indexes HRGR, SDNN, average speed, Jerk SD, gaze count, and sweep speed indexes at different intersection complexity levels (Table 2); this is consistent with Werneke et al.’s view that the complexity of different intersections will affect drivers’ driving behaviors, such as gaze behavior, vehicle reactions, and subjective cognition [16]. The subjective ranking of drivers’ perceptions of intersection complexity from highest to lowest was L2, L1, and L3, which was inconsistent with the objective evaluation results obtained from the simplified model of the intersection complexity calculated based on the number of conflict points and conflict probability (Table 8). The effect of different signal transition methods on drivers’ driving behavior characteristics when passing through the complex environment of the intersection did not reach a significant difference (Table 4). This is similar to what Felicio found [36]. The subjective cognitive results and driving behavior characteristic indexes of drivers at different two-phase planar intersection complexities are not consistent with the objective complexity calculation results of the simplified intersection complexity model based on the number of conflict points and conflict probability, and the influence of intersection operation conditions on driver behavior cannot be reflected based on the objective complexity of intersections only.
| Scenarios | Objective complexity level | Objective complexity value |
|---|---|---|
| Zhiyuan Road–Wanqing Road intersection | L3 | 0.953 |
| Zhiyuan Road–Yuehua Street intersection | L2 | 0.447 |
| Zhiyuan Road–Langxi Street intersection | L1 | 0.192 |
The main contribution of this paper is to propose a two-phase level intersection complexity measurement model based on driver behavior characteristics and subjective perceptions using the entropy-object topologically comprehensive evaluation method, establish a quantitative relationship between driver behavior and urban road level intersection complexity, and propose the classification criteria for complexity levels. The intersection complexity measurement model presented in this paper can be combined with intelligent algorithms for autonomous vehicles to safely pass two-phase intersections in mixed traffic flows.
Nevertheless, the two-phase level intersection complexity measurement model based on drivers’ behavioral characteristics and subjective perceptions proposed in this paper is only applicable to calculate and classify the complexity level of motor vehicle traffic flow in two-phase controlled level intersections. In the subsequent research, multiphase signal control, adaptive control methods, the influence of pedestrians and nonmotorized vehicles on the complexity of intersections, and the measurement of the complexity of special intersections such as roundabouts, which can be studied in depth on this basis. The model does not consider the influence of the intersection surroundings (e.g., weather, the decibel level of noise, the proximity of side obstacles, and vulnerable participants) on intersection traffic conflicts; it can be optimized in the subsequent study by combining the intersection surrounding factors.
7. Conclusions
- 1.
The objective complexity calculation model, as represented by the simplified intersection complexity model based on the number of conflict points and conflict probability, is inadequate in reflecting the impact of intersection operational conditions on driver behavior
- 2.
Varied signal transition methods at complex intersection environments did not yield significant differences in drivers’ driving behavior characteristics
- 3.
A measurement model, rooted in driver behavior characteristics and subjective perceptions, is proposed to gauge two-phase intersection complexity and is validated to establish a quantitative relationship between driver behavior and the complexity of urban road level intersections
These findings lay the groundwork for understanding the mechanisms by which the complexity of two-phase signalized intersections in urban settings influences driver decision-making. Future studies will further incorporate factors such as traffic volume, weather conditions, vulnerable participants, peak hours, and intersection geometry and build a signalized intersection complexity measurement model combined with drivers’ driving behaviors to strengthen the analysis. This will deepen insights into the factors influencing driver behavior in complex traffic environments. Additionally, the integration of these findings into AI algorithms is envisioned to enable autonomous vehicles to better anticipate the driving decisions of human drivers at signalized intersections, thereby enhancing safety and comfort.
Conflicts of Interest
The authors declare no conflicts of interest.
Funding
The research was supported by the National Natural Science Foundation of China (Grant No. 71961012 and Grant No. 52462050), Yunnan Key Laboratory of Digital Communications (Grant No. 202205AG07000), the Scientific Research Fund of the Department of Education of Yunnan Province (Grant No. 2024Y132), the Analysis and Test Fund of Kunming University of Science and Technology (Grant No. 2022M20202106029), and Science and technology plan project of Science and Technology Department of Yunnan Province—basic research plan (Grant No. 202501AS070051).
Acknowledgments
The research was supported by the National Natural Science Foundation of China (Grant No. 71961012 and Grant No. 52462050), Yunnan Key Laboratory of Digital Communications (Grant No. 202205AG07000), the Scientific Research Fund of the Department of Education of Yunnan Province (Grant No. 2024Y132), the Analysis and Test Fund of Kunming University of Science and Technology (Grant No. 2022M20202106029), and Science and technology plan project of Science and Technology Department of Yunnan Province—basic research plan (Grant No. 202501AS070051).
Open Research
Data Availability Statement
The research data are not shared.


