A Meta-Analysis of Influencers of Automobile Purchase Intention of Customers and Evolution of the Automobile Consumer Behavior From TCB
Abstract
Several studies have explored the antecedents of automobile purchase intention (API) of customers across different geographical regions of the world. These have, however, come up with contradictory findings about the polarities of effects of some antecedents, as well as about some of their differences across countries. We were motivated by these contradictions and differences to carry out a meta-analysis on API. In the study, we considered articles from peer-reviewed databases such as Google Scholar, Web of Science, Scopus, ScienceDirect, and Wiley. Our study and analysis of the full texts of 136 articles yielded 64 antecedents. The specific polarity of effect (positive or negative) on API is established for 59 of these antecedents, whereas the same remained undetermined for the rest five. We identified these as research gaps, the areas yet to be convincingly explored. Furthermore, based on the absence of publication bias and the 95% CI of impact not crossing the line of null effect, we enlisted 20 antecedents spread across the different stages of the automobile purchase decision process, which we propose to add to the theory of consumer behavior as the automobile consumer behavior (TACB). Our study can help managers to better understand consumer behavior in terms of the discovered antecedents, especially those having a higher impact at a particular stage of the process, and can result in better business decisions.
1. Introduction
Rowlan [1] defines purchase intention as a prerequisite for stimulating and pushing consumers to actually purchase products and services [2, 3]. It is the tendency of consumers to buy products of a particular kind, or undertake actions related to such purchases [1, 4]. They highlighted that to motivate the customers to consider and/or buy their products or services, it is important to bridge the gap between features, facilities, and functionalities of the desired products as provided by the company selling the products and the expectations of the customer [5–15]. Understanding the focus of and the emotions influencing consumers’ buying behavior, companies can craft new products and/or services’ marketing campaigns connecting with their global pool of customers, resulting in improved profitability [16, 17]. Kotler [18] highlighted this shift from the marketing-inclined concept to the customer-value concept, wherein attaining customers’ faith, satisfaction, and loyalty are considered more important than self-proclaimed product excellence. Unless the customers perceive a product or service as important and sense its demand, the said product or service cannot be successful in the market. The necessity of congruence between offered features and customer expectation is even more pronounced in the case of expensive products, as those are purchased based on customers perception of quality, product design, price, uniqueness, social status, and life history [16, 17, 19]. The concept of affordability and quality, as well as social status, inspired by a purchase, is often a function of the purchasing power of the potential customer, which in turn is influenced by the economic status of the latter. They are also influenced by customers’ perceptions, and these are based on one’s personal experience, as well as those of close relatives and friends [4]. Thus, products and services designed and developed in line with the customer’s expectations tend to elicit positive responses from the latter, and this can only be performed with a proper understanding of various antecedents of purchase intentions. Automobiles are no exception to this, but given that they are expensive and thus involve more customer scrutiny, it becomes all the more important to design them based on the antecedents of customer automobile purchase intentions (APIs) [20–27].
One can understand the influencers of API using one or more of the three sources, literature review of API, meta-analysis and individual articles based on surveys of people from various countries belonging to different socioeconomic statuses, and from responses to surveys conducted to understand influencers of peoples’ purchase intention [28, 29]. While scanning through the literature, we realized that there are not enough meta-analyses and literature reviews dealing with API, and thus we undertook this analysis based on our full-text reading of 136 articles.
During this study, we found that influencers of API differed across countries, and sometimes even across different cities of the same country. Steg et al. [30], in their study, conducted in Amsterdam (Netherlands), found the main influencers to be the locations of human activities, the needs and desires of people, and transport resistance. Becker et al. [31], in a study conducted in the neighboring city of Rotterdam, deviated in terms of their findings and found weather conditions to be the sole influencer. Similarly, Salamin et al. [32] found price discounts being important at the city of Al-Hassa in Saudi Arabia, while Sohail and Sahin [33], in nearby Riyadh, Jeddah, and Dammam in Saudi Arabia, found price, product quality, and risk to be more important. This trend is seen also in the case of three studies in 2022 from China. Hung et al. [34], in their study conducted at Chengdu, found the major influencers to be altitude, perceived behavioral control, subjective norms, perceived risk, perceived service quality of public transports, and sharing experience on API [35–44]. Conducting their study at Guangdong, Zhang et al. [45] identified the influencers as price, parking, problems, convenience, comfort, tech-savviness, environmental awareness, variety seeking, and need for privacy. At Wuhan, Yan et al. [46] came up with gender, income, residential location, vehicle availability, and epidemic severity as influencers of API. As can be seen, these three sets of influencers have very little in common. The experience is similar to studies conducted elsewhere. Fitwi [47] highlighted the role of demographic variables such as age, gender, education, and income for Hyundai vehicle customers of Addis Ababa in Ethiopia. The same has also been supported by Nerurkar [48] in the context of India, although factor loadings were not similar. Awuor [49] highlighted the contribution of strong advertisement messages for automobile customers of Nairobi. Based on the studies conducted in California, Golob et al. [50] came up with influencers to API such as income, vehicle performance (for younger customers), and safety (for older customers); Banerjee [51] came up with vehicle attributes and sociodemographic attributes; and Vigneron and Johnson [52] came up with brand awareness, brand loyalty, and brand trust. Thangam et al. [53], with survey samples from Tamil Nadu, India, found brand loyalty, safety, and design to be the main antecedents of API, while Naidu et al. [54] found those to be traffic congestion, pollution, economic benefits, and flexibility based on their sample from Karnataka, India. Continuing with this trend, Du et al. [55] and Hui et al. [56] found that sociodemographic variables have no influence on consumer behavior in the automobile industry, and authors such as Alice et al. [57]; Thomas et al. [58]; Tao, Nie, and Zhang [59]; Raghu [60]; Verma et al. [61]; Mathur et al. [62]; and Hackbarth and Reinhard [63] emphasized the importance of demographic variables in understanding the consumer behavior. Furthermore, there are geographical differences in the impacts of these attributes. Hackbarth and Reinhard [63] pointed out that graduated students of India, China, United States of America, Taiwan, and Indonesia are interested in owning four-wheelers, whereas Dutch students are inclined towards public transport due to their concern about the environment. This has also been supported by Bamberg [64]. Ikezoe et al. [65] highlighted the “attachment to private vehicles” and their survey showed that irrespective of how inexpensive the alternatives were, 74% of owners are not interested in availing alternative opportunities. Zhou et al. [66] and Kolleck [67] support this by stating “vehicle sharing does not impact purchasing of new ones.” Contradicting this, Pirzada and Singhi [68] and Naidu et al. [54] emphasized that “sharing of vehicles will reduce private ownership by more than 50%.” In the same lines, Banerjee [51] found the product features to be important, while Kolleck [67] and Alice [57] found them to be unimportant.
Summarizing the above, the literature talks of different components of API; many studies conflict with each other, thereby making it difficult to arrive at a conclusion. This calls for further probing into the matter, and thus motivated us to perform a meta-analysis on this subject.
The rest of the paper is organized as follows. Section 2 explains the research methodology applied, Section 3 deals with the categorization of factors as well as with the establishment of linkage between these factors and those that evolve from various theories of customer purchase intention leading to the development of our hypotheses. Section 4 details the meta-analysis, and finally Section 5 presents the conclusions and future research directions.
2. Research Methodology
Our intention is to analyze and synthesize the impacts of API antecedents from the research conducted across different parts of the world. We thus chose our research methodology to be a combination of literature review and meta-analysis methods [69, 70]. We used the grounded theory (noble, Mitchell [71]) for the extraction and analysis of articles. Grounded theory is a systematic methodology which involves the construction of hypotheses and theories through the collection and analysis of data and involves five steps, such as defining, searching, selecting, analyzing, and interpreting (Figure 1). These help refine the process of literature review and limit the discussion to the intended contextual domain, thereby ensuring the replicability of this rigorous and well-structured procedure of article extraction.
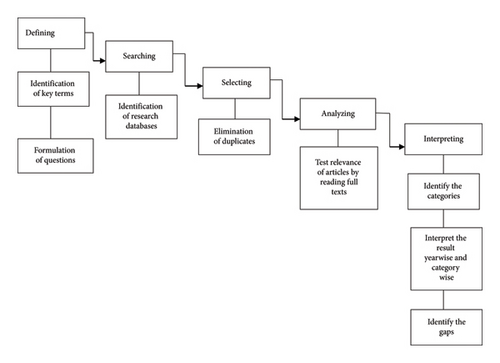
2.1. Defining
Herein, we develop the relevant keywords to search and identify the tools and techniques enabling the exploration of the relevant literature. The search keywords for this study include all those words which can be mapped to the phrase “customer purchase intention,” so we used (buying | purchase | private ownership | ownership | sharing | transaction | leasing) (behavior | intention | choice) (automobile | vehicle | car | vehicle-type | car-type | drive | transport | public transport | mobility to form the keywords, where one word will be taken from each set.).
2.2. Searching
We explored the research databases Google Scholar, ScienceDirect, Scopus, Springer, Wiley, Web of Science, arXiv, ResearchGate, and BASE, as has been performed in the literature (Vargas and Hanandeh [72] and Kraus et al. [73]). These multiple databases fetched a lot of articles and we further applied simultaneous backward and forward snowballing (Felizardo et al. [74]) to enrich our bouquet. The total result was 87,453 articles.
2.3. Selecting
The extracted 87,453 articles had a lot of identical copies. After eliminating the instances of the same articles, we were left with 7409 unique papers. After excluding working papers and those which were unpublished, the tally went down to 1147 papers.
2.4. Analyzing
Here, we refine the list of extracted papers by eliminating those which are out of the scope of the current research. We read through the abstract and the conclusion sections of 1147 papers and found 179 articles to be relevant to our study. Subsequently, we performed a more rigorous screening and read the full texts of these 179 articles. We were finally left with 134 articles within the period 1995–2023 for synthesis and assessment. This period of approximately 26 years of study is considered sufficient for systematic literature reviews (Hiebl [75] and Niforatos et al. [76]).
2.5. Interpreting
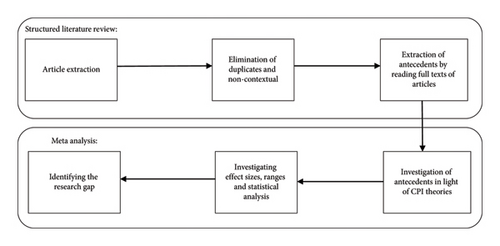
Interpretation involves the extraction and enlistment of factors and performing the meta-analysis as detailed in Section 3. Figure 2 illustrates the stages of this research methodology. We have used R Version 4.0.3 for conducting this meta-analysis. The meta-analysis helps us to statistically judge the significance of each factor as extracted from different studies and arrive at a correlation coefficient between these factors and the API of people [77]. It yields the effect size of each study, along with I2 and ρ value. I2 is a heterogeneity measure which allows an estimate of the proportion of variance observed in the meta-analysis due to true effects, and not due to sampling error; values higher than 50% are acceptable [78]. ρ value is the level of significance tested at a 95% confidence level. A value of 0.05 or lower is desirable for determining significant relationships. Along with the average effect size, a range is also obtained corresponding to a 95% confidence interval (CI). Our intention is to estimate true effect sizes, that is, the effect size in a population, from effects mentioned in various articles. The true effect size can be estimated in two ways, that is, the fixed effect model and the random effect model [79–81]. We have chosen random effect model; this model is appropriate when there is heterogeneity among the studies, and it also allows unconditional references to be made, that is, the facility of generalization beyond individual studies included in a meta-analysis (Field & Gillett [82], Pearson et al., [83], and Dwivedi et al. [77]). Furthermore, in cases when the fixed effect model would have been more appropriate, selecting the random effects model does not have a substantial negative impact (Field and Gillett [82]).
- i.
What are the factors that influence the API of customers?
- ii.
What are the magnitudes and nature of the effects of each factor on the API of a customer?
- iii.
What are the possible research gaps in studies conducted on API?
- iv.
What is the impact of moderators on less explored antecedents and how much heterogeneity can they explain?
3. Extraction and Categorization of Factors
We grouped the different antecedents impacting API, as discovered from the literature, into 10 categories as shown in Table 1.
| Category | Antecedents belonging to this category | Explanation of independent variables in each category |
|---|---|---|
| Demographical | Gender, age, education, income, rise in income, fall in income, and annual household debt | In the articles studied, gender can take only two values male and female, and age ranged from 18 to 75. Income specifies earnings per annum; similarly, for rise and fall in income. Annual household debt means the summation of the equated annual installment, which all borrower members of the house need to pay to the respective lenders |
| Psychocognitive | Attachment, attitude, environmental awareness, hedonism, perceived risk, personal norms, subjective norms, lifestyle, entertainment, and important life events | Attachment is an emotion that may incline a person toward buying his/her own personal vehicle. Attitude denotes one’s own assessment of the importance of an object (private vehicle in this case) coupled with feelings and behaviors toward it. Environmental awareness indicates how much one cares about the environment. Perceived risk makes one concerned about the adverse outcome of buying a private vehicle. Personal norm defines one’s belief system, about right or wrong [84, 85]. Subjective norm is a predictor of one’s behavior; it is one’s perception of the social expectations to adopt a particular behavior. Lifestyle is one’s way of life, particularly measured by lavishness. Entertainment denotes a feeling of pleasure, recreation, or amusement related to the ownership of a personal vehicle. Important life events consist of events worth remembering such as getting a new job, marriage, and childbirth |
| Sociopolitical | Social influence or pressure and government policies | Social influence or pressure describes how one conforms to others, obeys rules, and interacts with those in power. It can be based on a specific action, command, or request, or it can be a response to what one perceives about others’s thoughts or actions. Government policies are guidelines which one is expected to adhere to and may influence API |
| Product features | Product quality, comparative product quality, design, uniqueness, safety, space, resale value, fuel efficiency, engine horsepower, product reputation in social media, electronic word of mouth, conspicuousness, availability of spare parts, comfortability, discount, facility of installment, vehicle insurance, warranty, price, and maintenance cost |
|
| Brand | Brand image, brand awareness, brand loyalty, brand association, after-sales service, availability of test driving facility, persuasion capability of salesperson, quality of advertisements, and ease of information acquisition | Brand image is the reputation of a brand, and brand awareness signifies the level of familiarity with a given brand. Brand loyalty is when one continues to purchase from the same brand over and over again, despite competitors offering similar products or services. Brand association is the emotional and/or experiential connection one makes with a brand. After-sales service is the support and assistance that a business provides to customers after one has purchased a product or service. Test driving facility is a real-time opportunity to drive the vehicle’s prepurchase to determine if a vehicle fits one’s expectation in terms of performance, space, comfort, convenience, and utility needs. Persuasion capability of a salesperson is the ability of the concerned employee to influence a potential customer to take a desired action, such as purchasing a product. Quality of advertisements refers to its relevance and capability to appeal to the audience and adherence to industry standards. Ease of information acquisition refers to the easy availability or otherwise of all relevant information about a particular product |
| Experiential | Quality of public transport, quality of rail transit, traffic management quality, and vehicle sharing experience | Quality of public transport denotes the perceived performance and experience of people traveling in trains, buses, and various other modes of public transport. The quality of rail transit is particularly concerned about the experience of people traveling in trains. Traffic management quality refers to the administration’s management of vehicles and pedestrians to ensure their safe and efficient movement. Vehicle sharing experience is one’s perceived feeling of comfort and convenience in sharing a vehicle, mostly a car, through a carpooling service |
| Road and neighborhood | Congestion, highway building, parking difficulty, population density, residential arrangement in surrounding locations, road infrastructure, and pollution | Congestion occurs when there are too many vehicles and/or people on a road at a given time, causing traffic to move slower than normal. This causes problems in traveling and transportation. Highway building is the process of building and maintaining the infrastructure that allows people and goods to travel safely and efficiently. Parking difficulty is the degree of difficulty in finding a parking space. Population density in a location is a number of people residing in that location per unit area. Residential arrangement in the surrounding location determines how convenient it is to drive vehicles on roads in those locations. Road infrastructure refers to the physical assets and associated equipment that make up a road network. Pollution is the introduction of contaminants into the environment that cause adverse changes |
| Operational peripheral–related | Fuel cost | Fuel cost specifies the purchase price of fuel per liter |
| Travel characteristics–related | Distance to work and travel time | Distance to work is the distance between one’s home and workplace, while travel time refers to the time required to traverse this distance |
| Requirement-related (depreciation, situational, and weather-related) | Epidemic severity, weather conditions, and depreciations | Epidemic severity refers to the recent COVID-19 [86] scenario (and similar scenarios that may happen in future) which may discourage one from traveling in public vehicles or sharing vehicles with others. Harsh weather conditions may also discourage one from availing public transport, as that may entail walking out into inclement weather and may not be convenient. Depreciation is the gradual decrease in a product’s value over time due to wear and tear and aging |
In the following subsections, we present the analysis of antecedents as extracted from the literature based on these 10 categories in the light of consumer purchase intention theories.
3.1. Demographical Factors
Alice et al. [57] highlighted gender as an influential demographical factor as they found that male students are more inclined to purchase private four-wheelers, while the female students prefer public transport. This is in line with Thomas et al. [58], which mentions that “women in Australia mostly consider the car as a mere status symbol and do not encourage solo driving.” Quite an opposite picture has been portrayed by Tao et al. [59] about the Nanjing city of China, where “males prefer public transport more than females.” However, all these findings indicate that gender may have an impact on the API of customers. Some studies have found education and income as two other demographic variables having a direct influence on API, while a few others found them to be mediators of other influencers of API. The craze of buying private vehicles has been noticed among the highly educated university students of India, China, United States of America, and Indonesia [63]. Therefore, education, as a demographic variable, may have a considerable influence on the API of consumers. Income, in terms of rise and fall in income, and annual household debt are also considered as important demographical factors in this context [60–62, 87]. A rise in income enables a person to purchase more comfortable and expensive vehicles, whereas a fall in income leads to a reduction in financial strength, thereby requiring one to revisit one’s prevailing taste in products. Annual household debt cuts short the financial capability of a family, thus discouraging the purchase of expensive personal vehicles (Mannering, Winston, and Starkey) [88]. Golob et al. [50] highlighted age as an API antecedent that has a significant impact on consumer’s decision-making. Older people emphasize safety, while younger ones prioritize vehicle’s performance. Income as an influencer is also supported by the Veblenian’s sociopsychological model (VSPM), which says that “mostly the people belonging to affluent classes spend a lot of income on purchasing conspicuous products such as cars and houses.” This further comes up in the literature as separate mentions such as “rise in income,” “fall in income,” and “annual debt of household.” Based on these, we develop the following hypotheses (Table 2).
| Hypothesis | Statement |
|---|---|
| H1: | Gender has a positive effect on API |
| H2: | Age has a positive effect on API |
| H3: | Education has a positive effect on API |
| H4: | Income has a positive effect on API |
| H5: | Rise in income has a positive effect on API |
| H6: | Fall in income has a negative effect on API |
| H7: | Annual household debt has a negative effect on API |
3.2. Psychocognitive Factors
Multiple theories on consumer purchase behavior support the psychocognitive attributes. Attitude and subjective and personal norms are supported by theories of planned behavior and reasoned action [89, 90]. Ikezoe et al. [65], Steg et al. [30], and Choo and Mokhtarian [91] mention the impact of attitude, lifestyle, and personal and subjective norms on the vehicle purchase behavior of consumers. According to Ikezoe et al. [65], attachment to one’s cars is an emotion that discourages people from avoiding less-expensive alternatives. Choo and Mokhtarian [91] state that people who want to take charge of situations (leader or organizer personality) prefer large, luxury and sporty cars, whereas peaceful and not-in-charge people (calm personality) go for mid- and small-sized cars. Muromachi [92] establishes a correlation between personal vehicle purchase intention of students and the mode of transport they use to commute to their university; students who use bicycles would like to own a vehicle in the near future, whereas those who travel by train do not generally prefer to purchase a personal vehicle. Personal norms along with environmental awareness encourage people to avail themselves of public transport; they consider this as their contribution to the reduction in air pollution and cleansing of the environment, although more research is required to justify such a claim (Zhou et al. [66]). Subjective norms are based on perceived social pressure that consciously or unconsciously imbibes certain behavior on people. The need for social approval encourages one to show off one’s economic status, and this can be through the ownership of expensive luxury products. In some societies, people purchase personal vehicles during important life events such as marriage, relocation, and birth of a child. Therefore, these events may have a positive impact on API.
Perception of risk is a psychological factor that discourages one from buying expensive products, whereas hedonism is a belief that promotes the pleasure of “comfortable living” as a “way of life.” These thus affect the purchasing of private vehicles. Belief, attitude, and perception are highlighted by the stimulus response model [93, 94]. Hedonism is in line with the same model. Personality traits and experiences have been highlighted by Nicosia’s model [95], and particularly as per the third phase of this model, purchase decision is made based on the awareness about a brand and its alternatives in light of the personal experiences. This is in line with mentions of brand awareness (as a cognitive factor) and brand loyalty (as an awareness and experience-driven emotion) found in the API literature. Perception of risk has been mentioned by both Howard–Sheth’s model (HSM) and Freudian’s psychoanalytical model [96]. These help us to generate the hypotheses listed in Table 3.
| Hypothesis | Statement |
|---|---|
| H8: | Attachment has a positive effect on API |
| H9: | Attitude has a positive effect on API |
| H10: | Environmental awareness has a negative effect on API |
| H11: | Hedonism has a positive effect on API |
| H12: | Perceived risk has a negative effect on API |
| H13: | Personal norms have a negative effect on API |
| H14: | Subjective norms have a positive effect on API |
| H15: | Lifestyle has a positive effect on API |
| H16: | Entertainment has a positive effect on API |
| H17: | Important life events have a positive effect on API |
3.3. Sociopolitical Factors
The psychological need of rising in social status and satisfying the expectations of family members and friends generates a peer pressure in the minds of youngsters to purchase one’s own personal vehicle [97, 98]. Belgiawan et al. [97] in a study involving students in Indonesia, China, Japan, Lebanon, Netherlands, and United States of America, found that “peer pressure is the highest among students of Japan and United States of America and lowest in the Netherlands because Dutch students consider personal four-wheelers as a mere status symbol.” Environmental awareness is sometimes forced politically on people by governments of various countries to discourage people from purchasing cars [99]. Other government policies also exist that may encourage or discourage a person from buying automobiles [100, 101]. Social pressure has been mentioned in the theory of consumer behavior (TCB), the unified theory of acceptance and use of technology (UTAUT), and its newer version (UTAUT2), where age, gender, and experience act as mediators. Based on these, we develop further hypotheses as seen in Table 4.
| Hypothesis | Statement |
|---|---|
| H18: | Social influences have a positive effect on API |
| H19: | Government policies have a negative effect on API |
3.4. Product Features
Product features can further be subdivided into two groups as follows: (i) related to manufacturing technology and (ii) not related to manufacturing technology. Research on the impact of these attributes is comparatively a newer trend, and there are conflicting findings in the literature. Isa et al. [102] in their study conducted in Malaysia assigned higher weights to vehicle purchase decision criteria such as safety, comfort and fuel economy as compared to resale value and design. J.D. Powers and Opinion Research Consumer Insights (ORCIs) study conducted in the United States, states that “fuel economy, as a component of car purchase decision, was considered important in the early 1980s, dropped in 1990s, and then rose a bit in the last few years.” Kurami and Turrentine [103] interviewed prospective buyers of California and found that fuel economy had little importance to purchasers, especially those who planned to buy inexpensive cars. Gupta [104], however, found that fuel efficiency along with price and engine horsepower have strong influences on buying decisions. Kate and Handa [105] in their research on antecedents of API among people of Pune, India, found that design, quality of service, uniqueness, and word of mouth are more important as compared to safety and technological considerations. The study of Isac [106] in Romania listed the attributes as quality, safety, and price, in descending order of their importance. Manoranjitham and Singaravelu [107] found the design of a car to be one of the most crucial features for the people of Coimbatore in India. He advised the manufacturers to introduce more innovative colors and new models to increase the market share while taking initiatives for reducing maintenance costs. The study of Stella and Rajeswari [108] conducted in the Virudhunagar district of Tamil Nadu in India discovered that people assigned more importance to price, maintenance cost, and durability as compared to other features such as design and safety. Golob et al. [50], Smith and Wright [109], and Banerjee [51] emphasized the effectiveness of products as an important component of the purchase intention of customers. The criteria of comfortability and safety were raised by Steg et al. [30]. Price has a strong impact on buying of vehicles given that these are expensive products [33, 110] and has a negative effect on API [110].Along with price, discount and warranty are also highlighted [111, 112] as components of API. Saeed et al. [113] proposed the availability of spare parts as an API antecedent. The role of product reputation in social media has been advocated by Chen et al. [114], Karunanayake, and Madubashini [115]. Anandh and Shyama Sundar [116], in addition to the availability of spare parts, mention the uniqueness in design, resale value, safety, space, comfort, ease of availing automobile loans, warranty, and immediacy of delivery as important factors in Indian context. The availability of automobile loans has also been advocated by Havalder [117]. The match and contrast among the various studies mentioned above further justifiy the need for further analysis of the topic.
Among the various factors belonging to product features, perceived product quality is supported by the TCB. Product attributes, in general, are associated with the HSM, whereas performance effectiveness is associated with Marshallian’s economic theory (MET) and Fishbein’s multiattribute model (FMAM). In the limited problem-solving stage of the HSM, the customer makes himself completely aware of the various products offered by different brands, including the pros and cons of each product. MET emphasizes price, promotional expenditure, and product performance as components of API. Price as a significant player in API is also highlighted by the social cognitive theory (SCT). Comfort is a physiological need and is supported by Maslow’s hierarchy of needs theory and Pavlovian’ s learning model. Overall product performance (without mentioning any specific attribute) is strongly supported by UTAUT and UTAUT2. Table 5 shows the hypotheses we draw from the above.
| Hypothesis | Statement |
|---|---|
| H20: | Product quality has a positive effect on API |
| H21: | Comparative product quality has a positive effect on API |
| H22: | Design has a positive effect on API |
| H23: | Uniqueness has a positive effect on API |
| H24: | Safety has a positive effect on API |
| H25: | Space has a positive effect on API |
| H26: | Resale value has a positive effect on API |
| H27: | Fuel efficiency has a positive effect on API |
| H28: | Engine horsepower has a positive effect on API |
| H29: | Product reputation in social media has a positive effect on API |
| H30: | Conspicuousness has a positive effect on API |
| H31: | Availability of spare parts has a positive effect on API |
| H32: | Comfort has a positive effect on API |
| H33: | Discount has a positive effect on API |
| H34: | Facility for payment of loans in installments has a positive effect on API |
| H35: | Vehicle insurance has a positive effect on API |
| H36: | Warranty has a positive effect on API |
| H37: | Price has a negative effect on API |
| H38: | Maintenance cost has a negative effect on API |
3.5. Brand Factors
Smith and Wright [109] found, among various brand-related factors, brand image to be an important antecedent, something that conjures an overall impression of the brand in the minds of customers. A good brand image thus positively impacts the API. In addition, brand awareness, brand loyalty, and brand association have also come up in literature in this context [52, 118] as positive antecedents for API. Brand awareness specifies the familiarity of a consumer with the products or services of the brand, and brand association implies the emotional connection of a consumer with a brand. Brand loyalty encourages one to buy products of a particular brand, even when there are similar products or services offered by competitors; this is expected to strongly govern the choice of products during purchase. Good postsale service [119] and test driving facility [116] create a long-lasting impression in the minds of customers. These are categorized as brand factors as they are not dependent upon any specific product or model of the company. The persuasion capability of salespersons can significantly promote the sale of automobile products [120]. Advertisements and the ease of information acquisition are also important. Good quality advertisement content and well-structured websites and social media pages help to increase brand awareness and thus can influence API. Among these factors, brand image is supported by SCT, FMAM, and HSM [95]. This discussion generates the hypotheses of Table 6.
| Hypothesis | Statement |
|---|---|
| H39: | Brand awareness has a positive effect on API |
| H40: | Brand loyalty has a positive effect on API |
| H41: | Brand association has a positive effect on API |
| H42: | Brand image has a positive effect on API |
| H43: | After-sales service has a positive effect on API |
| H44: | Availability of a test driving facility has a positive effect on API |
| H45: | Persuasion capability of a salesperson has a positive effect on API |
| H46: | Quality of the advertisement has a positive effect on API |
| H47: | Ease of information acquisition has a positive effect on API |
3.6. Experiential Factors
Experiential factors include experiences of customers with respect to public transport, rail transit, and shared vehicles. Good experiences with these less-expensive alternatives refrain people from purchasing vehicles of their own [68, 116, 121]. Turoń [40] discussed about the utilities of vehicle sharing in the context of smart cities. Challenges faced by the sharing economy have been pointed out by Finger et al. [26]. These are applicable for the sharing of vehicles as well. Personal vehicles save effort and time as compared to public and shared transport and therefore are perceived to be more useful by affluent customers [23]. Various theories of consumer purchase intention have mentioned about perceived usefulness, including the TCB, the technology acceptance model (TAM), and its newer version TAM2. This discussion generates the hypotheses of Table 7.
| Hypothesis | Statement |
|---|---|
| H48: | Quality of public transport has a negative effect on API |
| H49: | Quality of rail transport has a negative effect on API |
| H50: | Traffic management quality has a positive effect on API |
| H51: | Vehicle sharing experience has a negative effect on API |
3.7. Road and Neighborhood Factors
Good road conditions, parking facility, lesser congestion on road, as well as neighborhood are factors that promote the purchase of personal vehicles [99, 121–124]. These are associated with the criterion of ease-of-use of products. Perceived ease-of-use has been supported by the TAM and its newer version TAM2 [95]. Table 8 shows the resultant hypotheses.
| Hypothesis | Statement |
|---|---|
| H52: | Congestion has a negative effect on API |
| H53: | Building of highways has a positive effect on API |
| H54: | Difficulty in parking has a negative effect on API |
| H55: | Population density has a negative effect on API |
| H56: | Residential arrangement in surrounding locations has a negative effect on API |
| H57: | Road infrastructure has a positive effect on API |
| H58: | Pollution has a negative effect on API |
3.8. Travel Characteristic–Related Factors
Travel characteristics include two things, distance to work (or trip length) and estimated time to travel (Ababio-Donor et al. [125], Zhou et al. [126], and Anable et al. [127]). Private vehicles are perceived to be more useful when the trip length or estimated time of travel is high, given that they save time. However, there are some conflicting opinions too; covering long trip lengths or large distances in private vehicles increases the cost of travel, thereby reducing the usefulness of the vehicle. Overall, these factors are components of perceived usefulness as mentioned in the TCB, the TAM, and its newer version TAM2. Table 9 shows the hypotheses we draw herein.
| Hypothesis | Statement |
|---|---|
| H59: | Distance to work has a positive effect on API |
| H60: | Travel time has a positive effect on API |
3.9. Operational Peripheral–Related Factors
Fuel is an important operational peripheral for automobiles (Dargay [110, 128] and Gupta [104, 116]). A lower price of fuel encourages people to purchase personal vehicles and vice versa. This discussion generates hypotheses of Table 10.
| Hypothesis | Statement |
|---|---|
| H61: | Fuel cost has a negative effect on API |
3.10. Requirement-Related Factors (Depreciation-Related, Situational, Weather-Related, and Environmental)
During COVID-19, people preferred personal vehicles as they perceived them to be safer against the spread of contagion as compared to public transport. This had a positive impact on the purchase intention of private vehicles (Yan et al. [12]). Depreciation of vehicles already owned by a customer also motivates one to purchase a new car (Shugin and Gang [129]). Commo et al. [130] found that bad weather encourages a person to buy a private vehicle. Therefore, all these are components of perceived usefulness and have a positive impact on API of customers as specified by the TCB and the TAM. This discussion generates the hypotheses of Table 11.
| Hypothesis | Statement |
|---|---|
| H62: | Epidemic (such as COVID-19) severity has a positive effect on API |
| H63: | Bad weather condition has a positive effect on API |
| H64: | Depreciation has a positive effect on API |
4. Meta-Analysis
4.1. Significance of Occurrences of Factors of API
| SL. no. | Name of the antecedent | Total number of studies | No. of studies which found this antecedent significant | No. of studies which found this antecedent nonsignificant | 95% CI range | Cronbach’s α | β | ρ1 | I2 | ρ2 | Comment | ∑kεωvεσσ |
|---|---|---|---|---|---|---|---|---|---|---|---|---|
| 1 | After-sales service | 4 | 3 | 1 | [0.27, 0.47] | 0.923 | 0.37 | 0.001 | 76% | 0.000 | H43 is supported | 0.61 |
| 2 | Age | 4 | 3 | 1 | [0.06, 0.15] | 0.859 | 0.1 | 0.001 | 72% | 0.000 | H2 is supported | 0.54 |
| 3 | Attachment | 1 | 1 | 0 | [0.25, 0.51] | 0.832 | 0.4 | 0.001 | 71% | 0.003 | H8 is supported | — |
| 4 | Annual household debt | 1 | 1 | 0 | [−0.21, 0.19] | 0.907 | −0.01 | NA | NA | 0.000 | H7 is not supported | — |
| 5 | Attitude | 12 | 12 | 0 | [0.27, 0.50] | 0.987 | 0.39 | 0.001 | 65% | 0.000 | H9 is supported | 0.73 |
| 6 | Availability of spare parts | 10 | 7 | 3 | [0.05, 0.34] | 0.887 | 0.19 | 0.001 | 78% | 0.001 | H31 is supported | 0.48 |
| 7 | Brand association | 4 | 3 | 1 | [0.12, 0.30] | 0.876 | 0.21 | 0.003 | 69% | 0.001 | H41 is supported | 0.29 |
| 8 | Brand awareness | 8 | 8 | 0 | [0.21, 0.50] | 0.923 | 0.36 | 0.001 | 73% | 0.000 | H39 is supported | 0.87 |
| 9 | Brand image | 11 | 10 | 1 | [0.25, 0.5] | 0.91 | 0.38 | 0.001 | 65% | 0.004 | H42 is supported | 0.31 |
| 10 | Brand loyalty | 16 | 16 | 0 | [0.20, 0.55] | 0.855 | 0.37 | 0.001 | 82% | 0.001 | H40 is supported | 0.12 |
| 11 | Comfortability | 8 | 8 | 0 | [0.45, 0.76] | 0.953 | 0.56 | 0.001 | 76% | 0.000 | H32 is supported | 0.57 |
| 12 | Comparative product quality | 2 | 2 | 0 | [0.32, 0.55] | 0.895 | 0.42 | 0.003 | 69% | 0.004 | H21 is supported | 0.52 |
| 13 | Congestion | 8 | 8 | 0 | [−0.6, −0.3] | 0.907 | −0.43 | 0.001 | 82% | 0.000 | H52 is supported | 0.17 |
| 14 | Conspicuousness | 2 | 2 | 0 | [0.05, 0.3] | 0.895 | 0.16 | 0.001 | 78% | 0.000 | H30 is supported | 0.42 |
| 15 | Depreciation | 3 | 2 | 1 | [0.44, 0.56] | 0.875 | 0.50 | 0.001 | 84.50% | 0.000 | H64 is supported | 0.19 |
| 16 | Design | 13 | 12 | 1 | [−0.1, 0.43] | 0.931 | 0.26 | 0.001 | 68% | 0.004 | H22 is not supported | 0.27 |
| 17 | Discount | 3 | 2 | 1 | [0.28, 0.53] | 0.853 | 0.41 | 0.001 | 83.50% | 0.005 | H33 is supported | 0.33 |
| 18 | Distance to work | 3 | 2 | 1 | [−0.58, 0.53] | 0.902 | −0.03 | 0.01 | 98% | 0.002 | H59 is not supported | 0.52 |
| 19 | Ease of information acquisition | 2 | 2 | 0 | [0.05, 0.13] | 0.806 | 0.09 | 0.003 | 87% | 0.000 | H47 is supported | 0.69 |
| 20 | Easy installment | 2 | 2 | 0 | [0.35, 0.52] | 0.894 | 0.43 | 0.001 | 87% | 0.001 | H34 is supported | 0.92 |
| 21 | Education | 8 | 7 | 1 | [0.04, 0.13] | 0.845 | 0.09 | 0.001 | 77% | 0.000 | H3 is supported | 0.24 |
| 22 | Electronic word of mouth | 6 | 6 | 0 | [0.05, 0.35] | 0.895 | 0.23 | 0.001 | 76% | 0.000 | H29 is supported | 0.54 |
| 23 | Engine horsepower | 6 | 5 | 1 | [0.22, 0.45] | 0.899 | 0.33 | 0.001 | 73% | 0.000 | H28 is supported | 0.67 |
| 24 | Entertainment | 2 | 2 | 0 | [0.19, 0.32] | 0.876 | 0.26 | 0.001 | 78% | 0.000 | H16 is supported | 0.44 |
| 25 | Environmental awareness | 8 | 8 | 0 | [−0.5, −0.2] | 0.864 | −0.32 | 0.001 | 79% | 0.000 | H10 is supported | 0.67 |
| 26 | Epidemic severity | 2 | 2 | 0 | [0.46, 0.6] | 0.897 | 0.53 | 0.003 | 67% | 0.000 | H62 is supported | 0.77 |
| 27 | Fall in income | 2 | 2 | 0 | [−0.44, 0.27] | 0.935 | −0.1 | 0.001 | 70% | 0.000 | H6 is not supported | 0.91 |
| 28 | Fuel cost | 2 | 2 | 0 | [−0.26, −0.01] | 0.915 | −0.14 | 0.001 | 64% | 0.008 | H61 is supported | 0.80 |
| 29 | Fuel efficiency | 6 | 5 | 1 | [0.05, 0.34] | 0.911 | 0.2 | 0.001 | 88% | 0.001 | H27 is supported | 2.18 |
| 30 | Gender | 6 | 4 | 2 | [0, 0.23] | 0.923 | 0.11 | 0.001 | 74% | 0.002 | H1 is supported | 0.59 |
| 31 | Government policies | 4 | 4 | 0 | [−0.35, −0.03] | 0.897 | −0.2 | 0.001 | 77% | 0.004 | H19 is supported | 0.44 |
| 32 | Hedonism | 4 | 4 | 0 | [0.17, 0.41] | 0.878 | 0.27 | 0.001 | 85% | 0.001 | H11 is supported | 0.78 |
| 33 | Highway building | 1 | 1 | 0 | [0.01, 0.15] | 0.935 | 0.08 | NA | NA | 0.001 | H53 is supported | — |
| 34 | Important life events | 1 | 1 | 0 | [0.05, 0.17] | 0.883 | 0.11 | NA | NA | 0.001 | H17 is supported | — |
| 35 | Income | 21 | 21 | 0 | [0.32, 0.63] | 0.948 | 0.48 | 0.001 | 86% | 0.000 | H4 is supported | 0.46 |
| 36 | Insurance | 3 | 2 | 1 | [0.23, 0.45] | 0.972 | 0.34 | 0.001 | 83% | 0.001 | H35 is supported | 0.67 |
| 37 | Lifestyle | 5 | 5 | 0 | [0.19, 0.32] | 0.845 | 0.26 | 0.002 | 58% | 0.007 | H15 is supported | 0.73 |
| 38 | Maintenance cost | 6 | 5 | 1 | [−0.2, −0.01] | 0.916 | −0.31 | 0.001 | 77% | 0.000 | H38 is supported | 0.57 |
| 39 | Parking diff. | 4 | 3 | 1 | [−0.45, −0.17] | 0.911 | −0.3 | NA | NA | 0.004 | H54 is supported | 0.82 |
| 40 | Perceived risk | 7 | 6 | 1 | [−0.58, −0.3] | 0.959 | −0.45 | 0.001 | 76% | 0.006 | H12 is supported | 0.46 |
| 41 | Personal norms | 6 | 6 | 0 | [−0.35, −0.10] | 0.971 | −0.23 | 0.001 | 73% | 0.001 | H13 is supported | 0.52 |
| 42 | Persuasion capability | 3 | 2 | 1 | [0.20, 0.40] | 0.897 | 0.29 | 0.001 | 68% | 0.000 | H45 is supported | 0.61 |
| 43 | Pollution | 4 | 3 | 1 | [−0.25, −0.06] | 0.822 | −0.1 | 0.001 | 58% | 0.000 | H58 is supported | 0.85 |
| 44 | Population density | 3 | 2 | 1 | [−0.25, 0] | 0.933 | −0.12 | 0.001 | 76% | 0.001 | H55 is supported | 0.78 |
| 45 | Price | 25 | 25 | 0 | [−0.65, −0.3] | 0.929 | −0.55 | 0.001 | 89% | 0.001 | H37 is supported | 0.26 |
| 46 | Product quality | 8 | 8 | 0 | [0.41, 0.73] | 0.737 | 0.6 | 0.001 | 79% | 0.000 | H20 is supported | 0.44 |
| 47 | Public transport quality | 8 | 7 | 1 | [−0.48, −0.25] | 0.879 | −0.37 | 0.001 | 73% | 0.004 | H48 is supported | 0.36 |
| 48 | Quality of advertising | 4 | 3 | 1 | [0.04, 0.23] | 0.833 | 0.14 | 0.002 | 71% | 0.002 | H46 is supported | 0.29 |
| 49 | Rail transit | 4 | 4 | 0 | [−0.70, −0.40] | 0.992 | −0.54 | 0.001 | 76% | 0.001 | H49 is supported | 0.32 |
| 50 | Resale value | 5 | 5 | 0 | [0.20, 0.39] | 0.914 | 0.29 | NA | NA | 0.001 | H26 is supported | 0.42 |
| 51 | Residential arrangement in the surrounding location | 2 | 1 | 1 | [−0.32, −0.11] | 0.92 | −0.22 | NA | NA | 0.005 | H56 is supported | — |
| 52 | Rise in income | 3 | 2 | 1 | [0.15, 0.33] | 0.89 | 0.23 | 0.001 | 81% | 0.004 | H5 is supported | 0.51 |
| 53 | Road infrastructure | 2 | 2 | 0 | [0.17, 0.39] | 0.951 | 0.28 | 0.001 | 83% | 0.000 | H57 is supported | 0.72 |
| 54 | Safety | 12 | 12 | 0 | [0.28, 0.58] | 0.916 | 0.43 | 0.001 | 76% | 0.000 | H24 is supported | 0.62 |
| 55 | Social influence | 16 | 16 | 0 | [0.38, 0.69] | 0.958 | 0.54 | 0.001 | 75% | 0.000 | H18 is supported | 0.11 |
| 56 | Space | 6 | 5 | 1 | [−0.15, 0.55] | 0.909 | 0.36 | 0.001 | 74% | 0.004 | H25 is not supported | 0.27 |
| 57 | Subjective norms | 8 | 8 | 0 | [0.10, 0.48] | 0.937 | 0.33 | 0.001 | 62% | 0.005 | H14 is supported | 0.39 |
| 58 | Test driving facility | 1 | 1 | 0 | [0.02, 0.23] | 0.933 | 0.13 | NA | NA | 0.002 | H44 is supported | — |
| 59 | Traffic management | 1 | 1 | 0 | [0.28, 0.40] | 0.921 | 0.34 | 0.001 | 68% | 0.001 | H50 is supported | — |
| 60 | Travel time | 4 | 4 | 0 | [0.15, 0.50] | 0.91 | 0.32 | 0.001 | 83% | 0.000 | H60 is supported | 0.23 |
| 61 | Uniqueness | 3 | 3 | 0 | [0.09, 0.4] | 0.895 | 0.22 | 0.001 | 83% | 0.000 | H23 is supported | 0.65 |
| 62 | Vehicle sharing experience | 9 | 7 | 2 | [−0.48, −0.21] | 0.952 | −0.35 | 0.001 | 75% | 0.008 | H51 is supported | 1.07 |
| 63 | Warranty condition | 4 | 3 | 1 | [0.26, 0.48] | 0.915 | 0.38 | 0.002 | 62% | 0.005 | H36 is supported | 0.32 |
| 64 | Weather condition | 5 | 5 | 0 | [0.04, 0.3] | 0.969 | 0.17 | 0.001 | 69% | 0.002 | H63 is supported | 0.41 |
- Note: Hypotheses, which are not supported, are in bold. Also, values higher than 1 in skewness field are in bold.
Cronbach’s α determines the internal uniformity or average correlation of items in a survey mechanism to measure its reliability. It varies from zero to one and explains the reliability of factors obtained from dichotomous and/or multipoint-designed opinions on the dimension; a value of 0.7 and higher is considered reliable. Cronbach’s α associated with each variable in Table 12 is the average of the Cronbach α of all the studies where the particular variable has been mentioned. In our case, all the Cronbach α values are higher than 0.8; this denotes that the considered studies are sufficiently reliable. 95% CI range specifies a range of effect sizes for a given antecedent on API. Skewness is mentioned in the last column of this table, and the procedure of its calculation is shown in Section 4.2.
4.2. Detection of Publication Bias
Here, εi = −TI, is the study’s specific standardized effect and TI is its mean. ∈′ is the mean of all , that is, the deviations of errors. The value of the skewness is interpreted as the estimate of publication bias. As per Lin and Chu [135], “If the skewness is less than 0.5 in absolute magnitude, the distribution of the standardized deviates is approximately symmetric; the skewness is deemed considerable if it is between 0.5 and 1, and it may be substantial if its absolute value is greater than 1.”
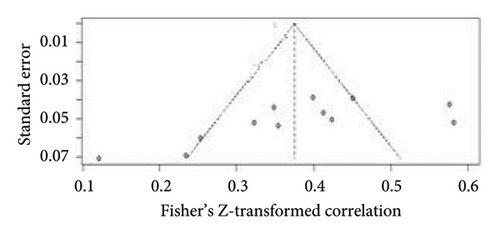
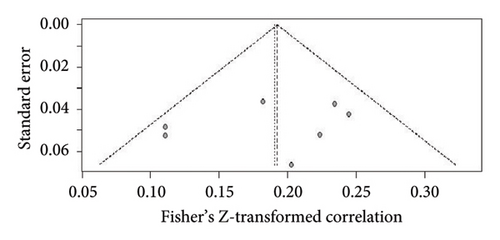
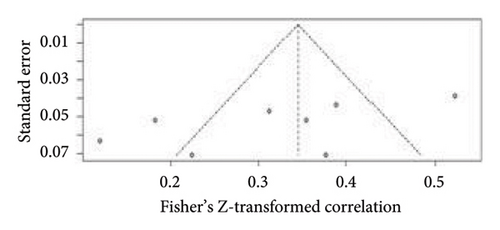
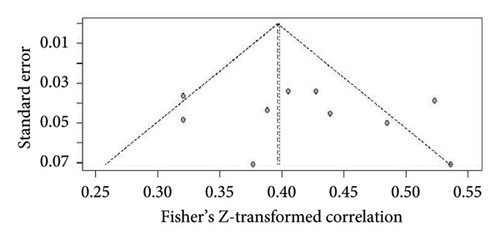
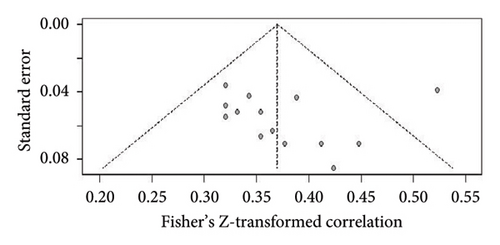
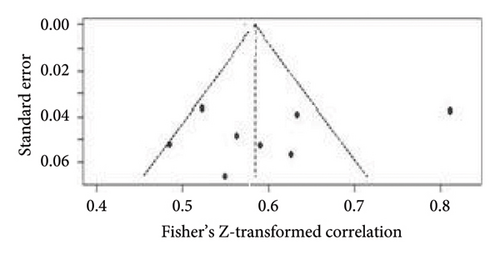
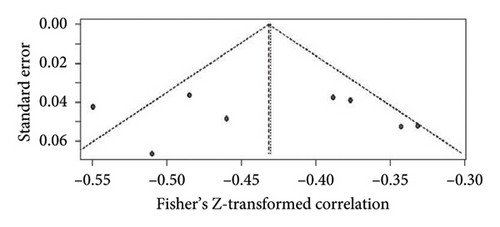
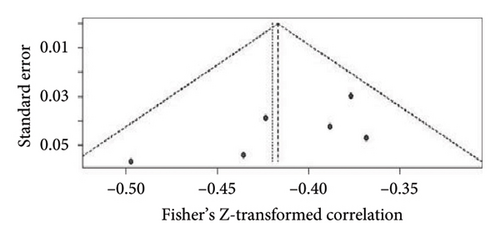
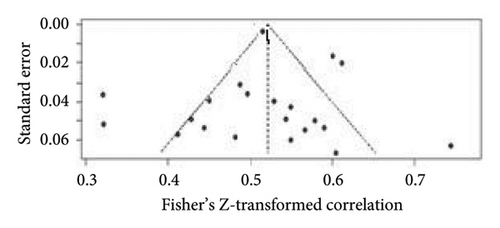
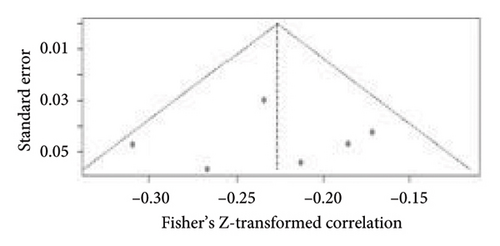
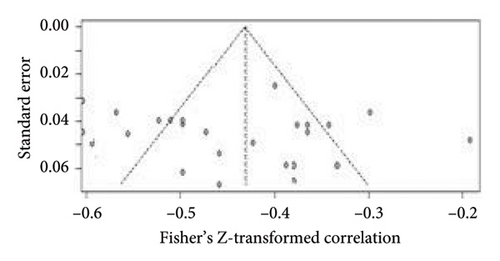
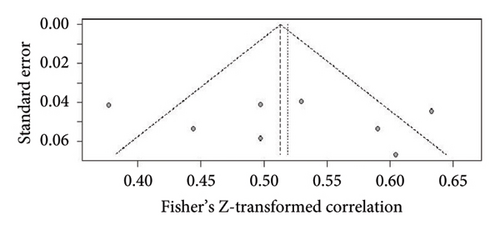
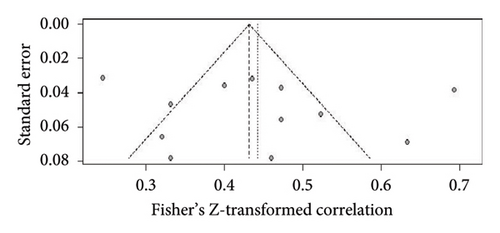
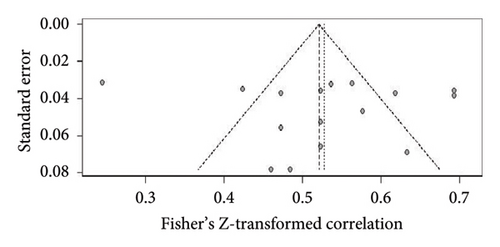
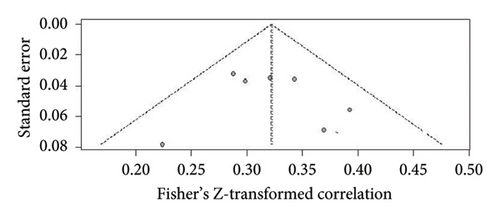
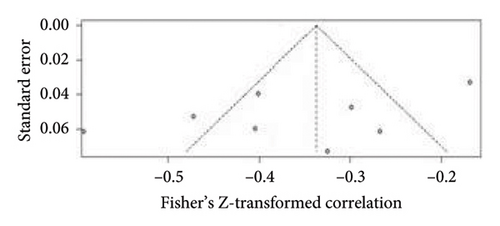
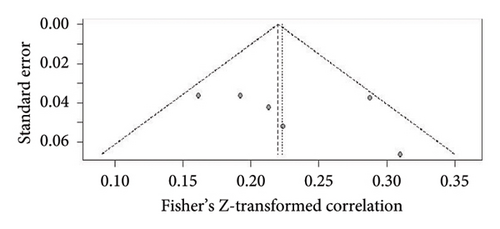
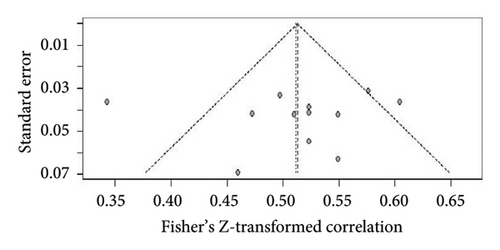
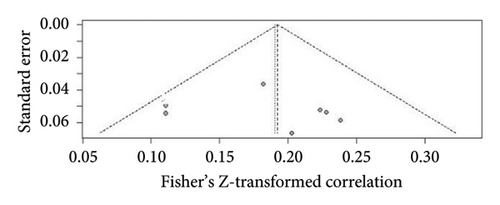
In this study, out of the 64 antecedents extracted, 9 are supported by 10 or more studies, and 29 are supported by 5 or more studies. Given this, we draw funnel plots for antecedents mentioned in six or more studies to check for publication bias (Figure 3) (Figures 3(a), 3(b), 3(c), 3(d), 3(e), 3(f), 3(g), 3(h), 3(i), 3(j), 3(k), 3(l), 3(m), 3(n), 3(o), 3(p), 3(q), 3(r), and 3(s)). In addition, given the smaller number of studies involved in the case of some antecedents, we compute the skewness individually for the antecedents mentioned to be significant in at least 2 studies, that is, we compute the Ts as suggested in the studies of Lin and Chu [135], which we have incorporated as the last column in Table 12. As can be seen from Table 12 (Row 29 and Row 62), the Ts value is greater than 1 for fuel efficiency and vehicle sharing experience, indicating substantial publication bias for these two antecedents. Hence, these need to be further explored, including here the unpublished works as well; something that can be taken up as future research.
4.3. Composite Antecedent Impact Diagram
The composite antecedent impact diagram is presented in Figure 4. Among the 64 antecedents, product quality (0.6) has the highest positive impact, whereas highway building (0.08) has the lowest positive impact on API. Comfortability (0.56), depreciation (0.5), epidemic severity (0.53), income (0.48), easy installment (0.43), and comparative product quality (0.42) also have high impacts on API.
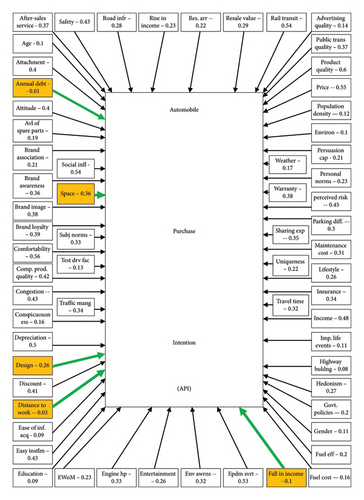
Comfortability (0.56), depreciation (0.5), epidemic severity (0.53), income (0.48), easy installment (0.43), and comparative product quality (0.42) also have high impacts on API or automobile purchase much more than government policies (−0.2). Links colored in green specify that they are moderated by more than one variable, as shown in Figure 4. Of the 14 antecedents that have a negative impact, price has the highest negative impact (−0.55), whereas pollution has the lowest negative impact (−0.1). Rail transit (−0.54), public transport quality (−0.37), and vehicle sharing experience (−0.35) have a strong negative impact. Environmental awareness (−0.32) is capable of restricting automobile purchases.
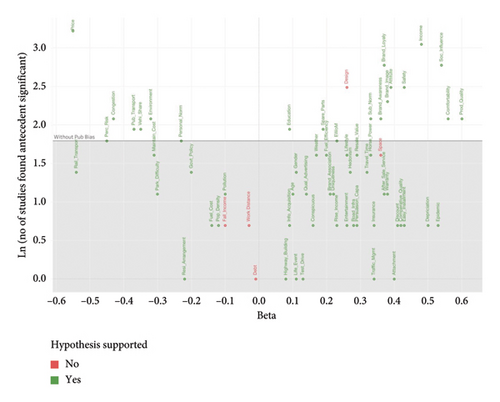
Furthermore, Figure 5 presents a scatter plot of all the collated antecedents plotted against β (standardized effect size) and the logarithm of the number of studies that found these antecedents significant, indicating whether our hypotheses involving them are supported or otherwise. The logarithm was considered for the sake of the visible clarity of the plot. The lower part of the plot (below the without pub bias horizontal line, in gray area) has the antecedents which failed to find presence as significant in six or more studies.
4.4. Moderator Analysis
Many of the antecedents mentioned in this article have appeared as moderators to the link between fellow antecedents and API, as revealed from relevant literature. Mo and Ming [139] collected samples from Los Angeles County in the United States. They found that income moderates the link between (gender and API) and (age and API). The authors utilized the theory of reasoned action to establish the linkages. The moderation role of income has also been supported by Dias [140] in the link between age and API. Karunanayake and Samarasinghe [141] identified perceived risk as a moderator in between the links (social norms to API), (price to API), (performance to API), and (comfort to API). They had analyzed the influence of these factors based on the unified theory of the acceptance and use of technology. Zhao, Furuoka and Rasiah (Zhao et al. [142]) studied the influence of psychological factors on the purchase intention of customers in China. Based on the self-determination theory, their analysis revealed the moderating role of test drive experience between the links (perceived risk to API) and (perceived performance to API). Huang et al. [143], in their analysis based on the theory of planned behavior, found that the perceived service standard of public transportation moderates the links between (social norms, API), (perceived behavioral control, API), and (attitude, API). Based on this discussion, we can claim that various demographic, psychocognitive, and experiential factors play the role of moderators in the context of different countries. Others belonging to the same or different factors may also have a moderating influence on the links between other fellow factors and API. Therefore, we have tested all factors in the role of moderators between the links from abovementioned actors and API.
- i.
If f2 < 0.005, the moderation effect is negligible
- ii.
If 0.005 ≤ f2 ≤ 0.01, the moderation effect is small
- iii.
If 0.01 ≤ f2 ≤ 0.025, the moderation effect is medium
- iv.
If f2 ≥ 0.025, the moderation effect is large
- •
Annual household debt ⟶ API link
- i.
This is largely moderated by income and a rise in income; financial capability enables a person to withstand debt and still have a luxurious life. Price also has a large moderation effect on this link; a person who is under debt and still buying a personal vehicle will probably opt for a less expensive one.
- ii.
Medium moderation effect can be noticed for antecedents such as attachment, lifestyle, easy installment, and gender. Attachment is an emotional connection to an object that often provokes a person to intentionally ignore pre-existing monetary constraints and opt for the purchase of an expensive luxurious item such as a personal vehicle. This is seen to be more prominent for men who consider it as an extension of their existence, unlike women. This is supported by Gossling [144] and Balkmar and Mellstrain, [145]. A prevalent lifestyle may habituate a person to use his own vehicle and may even persist in spite of debt.
- iii.
Age, discount, and education are observed to have a small moderation impact. Young people are more at ease in taking the risk of lucrative purchases; they have a pretty long professional life ahead unlike the aged who might prefer to save more for their retirement. Discounts reduce pressure on the buyer’s pocket. Education may somewhat make people think more rationally and dampen impulsive purchases when under debt.
- i.
- •
Design ⟶ API link
- i.
Medium moderation effect is noticed for antecedents, depreciation and uniqueness. Buyers are often attracted to the uniqueness of the latest models. People also tend to change existing vehicles after they depreciate or get older.
- ii.
Electronic word of mouth is seen to have a small moderation effect. People who have special preferences for look or décor are luxurious and fanciful in general, and they expect appreciation for the items they purchase [85, 146]. Prepurchase assessment and estimation of this appreciation is possible through analyzing social media reviews; if most of the reviews are positive, then that may motivate a hedonistic person to buy a specific vehicle.
- i.
- •
Space ⟶ API link
- i.
Design is observed to have a small moderation effect; a spacious vehicle is designed to maximize comfort for occupants. Without proper layout and installation of components, the utilization of space is not possible.
- i.
- •
Fall in income ⟶ API link
- i.
Income has a large and price has a medium moderation effect on this link. Despite a fall in income, if a person had a high income earlier, he may still think of owning a private vehicle. Motivation of the potential customer will be higher if the price of the vehicle is low.
- ii.
Attachment has a small moderation effect; this antecedent in no way relieves financial pressure on the customer.
- i.
- •
Distance to work ⟶ API link
- i.
Price, fuel efficiency, and maintenance cost are found to have a medium moderation effect. If distance to work is driving the aspiration to buy, it is more of a necessity-initiated purchase than satisfying a hedonistic desire. The choice of such customers will be governed by cost-related constraints such as price, fuel efficiency, and maintenance cost.
- ii.
A small moderation effect is noticed for highway building, road infrastructure, and weather. Highway building and road infrastructure increase the convenience of transportation, whereas bad weather strengthens the necessity of purchase.
- i.
| Dependent variable | Independent variable | Moderators | Estimated residual heterogeneity (tau-squared) | Between subgroups heterogeneity (in percentage) | P value |
|---|---|---|---|---|---|
| API | Annual household debt | Income, rise in income, attachment, lifestyle, easy installment, gender, and price | 0.1405 | 47.11 | < 0.0001 |
| Design | Depreciation and uniqueness | 0.2067 | 36.53 | < 0.0001 | |
| Distance to work | Price, maintenance cost, and fuel efficiency | 0.1119 | 33.18 | < 0.0001 | |
| Fall in income | Income and price | 0.1347 | 51.47 | < 0.0001 |
In Table 13, all p values are less than 0.000, that is, significant. All tau-squared values are higher than zero, hence there is non-negligible heterogeneity or diversity between characteristics of the subgroups. Residual heterogeneity between subgroups is 47.11% for annual household debt (and associated moderators), 36.53% for design (and allied moderators), and 51.47% for fall in income (and associated moderators), whereas for distance to work (and associated moderators), it is 33.18%. This specifies the heterogeneity between subgroups which cannot be explained by the moderators. In the case of three of the antecedents, annual household debt, design, and distance to work, most of the heterogeneity is explained by the moderators as the residual heterogeneity is less than 50%, which is moderate. Therefore, the mentioned moderators are important for respective antecedents. For the fall in income, however, residual heterogeneity is 51.47%; hence, heterogeneity explained by moderators is 48.53%, which is also non-negligible.
5. Conclusion and Future Work
In this study, we have reviewed articles on factors that have an impact on the API of customers. As far as the theoretical framework of antecedents of product purchase intentions is concerned (in general), some of the articles are associated with theory, while the others are not associated with any theory. We have thus discussed components of API considering several theories and specified average effect size along with the 95% CI range. We distinguished between the antecedents that generate positive impact, negative impact, and yet-undecided impact. The impact is undecided for antecedents for which the 95% CI effect range crosses the link of the null effect. In Tables 14 and 15, we summarize the findings of our article. Table 14 shows the type of impact (confirmed positive, confirmed negative, or undecided) on API, names of associated antecedents, and names of antecedents with and without publication bias along with names of antecedents for which publication bias could not be determined due to the small number of studies. Table 15 shows the antecedents with undecided impact on API and associated moderators with medium or large moderation effects.
| Type of impact on API | Antecedents extracted from the literature | Antecedents with publication bias | Antecedents without publication bias | Antecedents for which publication bias could not be determined (the number of articles which found this antecedent to be significant was less than 6) |
|---|---|---|---|---|
| Confirmed positive impact | Gender, age, education, income, rise in income, attachment, attitude, hedonism, subjective norms, lifestyle, entertainment, important life events, social influence or pressure, product quality, comparative product quality, design, uniqueness, safety, resale value, fuel efficiency, engine horsepower, product reputation in social media or electronic word of mouth, conspicuousness, availability of spare parts, comfortability, discount, facility of installment, vehicle insurance, warranty, brand image, brand awareness, brand loyalty, brand association, after-sales service, availability of test driving facility, persuasion capability of company personnel, quality of advertisements, ease of information acquisition, traffic management quality, highway building, road infrastructure, travel time, epidemic severity, weather condition, and depreciations | Nil | Attitude, availability of spare parts, brand awareness, brand image, brand loyalty, comfortability, congestion, perceived risk, engine horsepower, income, environmental awareness, personal norms, price, product quality, safety, social influence, subjective norms, vehicle sharing experience, electronic word of mouth, design, and education | Gender, age, rise in income, attachment, hedonism, subjective norms, lifestyle, entertainment, important life events, comparative product quality, design, uniqueness, resale value, fuel efficiency, conspicuousness, discount, facility of installment, vehicle insurance, warranty, brand association, after-sales service, availability of test driving facility, persuasion capability of company personnel, quality of advertisements, ease of information acquisition, traffic management quality, highway building, road infrastructure, travel time, epidemic severity, weather condition, and depreciations |
| Confirmed negative impact | Congestion, environmental awareness, fuel cost, government policies, maintenance cost, perceived risk, personal norms, parking difficulty, pollution, population density, price, public transport quality, rail transit, residential arrangement in the surrounding location, and vehicle sharing experience | Nil | Congestion, perceived risk, environmental awareness, personal norms, price, and vehicle sharing experience | Fuel cost, government policies, maintenance cost, parking difficulty, pollution, population density, public transport quality, rail transit, and residential arrangement in the surrounding location |
| Undecided impact | Fall in income, annual household debt, space, distance to work, and design | Nil | Design | Fall in income, annual household debt, space, distance to work, and design |
| Independent variable | Possible moderators with medium effect | Possible moderators with a large effect |
|---|---|---|
| Annual household debt | Attachment, lifestyle, easy installment, and gender | Income, rise in income, and price |
| Design | Depreciation and uniqueness | Nil |
| Distance to work | Price, maintenance cost, and fuel efficiency | Nil |
| Fall in income | Price | Income |
| Space | Nil | Nil |
We distinguished among the antecedents that generate positive impact, negative impact, and yet-undecided impact. The impact is undecided for those antecedents which have crossed the link of null effect. Those factors with undecided impact (Table 15) are annual household debt, design, distance to work, fall in income, and space. These are possible areas for future research. Furthermore, there are some antecedents that have been found significant in less than six studies (last row of Table 14) , which need to be explored further.
5.1. Contributions to Theory
The study contributes to theory in several dimensions. The meta-analysis adds value to the existing knowledge on the various factors of API of customers. The study will help researchers with more dimensions to understand and deduce the type of variables that can be used for analyzing the impact of influencing API in different socioeconomic contexts. The study provides a consolidated view of relevant influencers along with their effect sizes coupled with reliability, statistical significance, and theoretical background.
- •
Some factors contribute to problem recognition thereby triggering the potential outcomes of vehicle purchase, we term these factors as Influencer set A.
- •
Some other factors promote product selection; we club them into two subphases: Subphase 1 is associated with information acquisition, which we term as Influencer set B, while Subphase 2 deals with the evaluation of alternatives. This evaluation may be performed based on the qualities of products (we term these as Influencer set C1) and qualities of brands (termed here as Influencer set C2).
- •
This is followed by a purchase decision, and we term the corresponding factors as Influencer set D.
- •
Factors which influence postpurchase experience, which may impact future product selection, are included in Influence set E.
The involved factors across the influencer sets are illustrated in Figure 6.
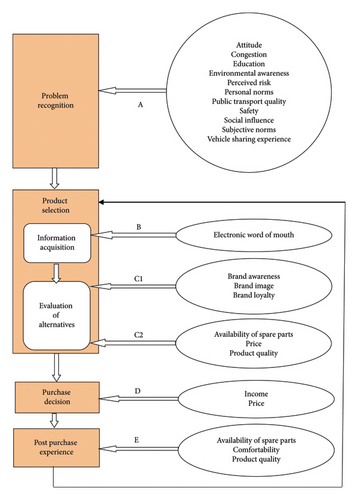
Antecedents belonging to Influencer sets A, B, C1, C2, D, and E are supported by various existing theories of purchase behavior as shown in Table 16. The relevant theories are as follows: TCB (Hung and Cheng [143], Gokhale et al. [150], and Hackbarth and Madlener [63]), theory of planned behavior (Dargay [110], Choo and Mokhtarian [91], Huang and Cheng [143], Bhutto. et al. [151], and Bearden [120]), theory of reasoned action (Choo and Mokhtarian [91]), SCT (Mo and Ming [139]), FMAM (Bhaskar et al. [37] and Altaf and Hashim [152]) HSM (Ebrahimi et al. [153] and Naidu [133]), Maslow’s hierarchy of needs theory (Yang et al. [12]), VSPM (Karoui et al. [154]), Nicosia’s model (Sohail and Sahin [33]), and MET (Amir and Asad [112]).
| Antecedents | Supporting theories | |||||||||
|---|---|---|---|---|---|---|---|---|---|---|
| Fishbien’s multiattribute model | Howard–Sheth’s model | Marshallian economic theory | Maslow’s hierarchy of needs theory | Nicosia’s model | Social cognitive theory | Theory of consumer behavior | Theory of planned behavior | Theory of reasoned action | Veblenian’s social psychological model | |
| Attitude | √ | √ | √ | |||||||
| Availability of spare parts | √ | √ | ||||||||
| Brand awareness | √ | √ | ||||||||
| Brand image | √ | √ | ||||||||
| Brand loyalty | √ | √ | ||||||||
| Comfortability | √ | √ | ||||||||
| Congestion | √ | |||||||||
| Education | √ | |||||||||
| Electronic word of mouth | √ | √ | ||||||||
| Environmental awareness | √ | |||||||||
| Income | ||||||||||
| Perceived risk | √ | √ | ||||||||
| Personal norms | √ | |||||||||
| Price | √ | |||||||||
| Product quality | √ | √ | ||||||||
| Public transport quality | √ | |||||||||
| Safety | √ | |||||||||
| Social influence | √ | |||||||||
| Subjective norms | √ | |||||||||
| Vehicle sharing experience | √ | |||||||||
5.2. Implications for Practice
The findings of this study provide some useful implications for practitioners, which can help them guide through the consumer’s decision-making process. Manufacturers as well as marketers can consider the influencers of the 64 factors on API, and can accordingly develop their strategies to reach out to the customer. The number of antecedents identified from the literature is further reduced to 20 based on there being no publication bias and the 95% CI of impact has not crossed the line of null effect. As the practitioners might be looking at influencing one or more stages of the automobile purchase lifecycle, they can look at those factors which exert considerable influence, positive or negative, in the particular stage(s) of the process. The antecedents based on their effect size and their stages of influence are plotted in Figure 7.
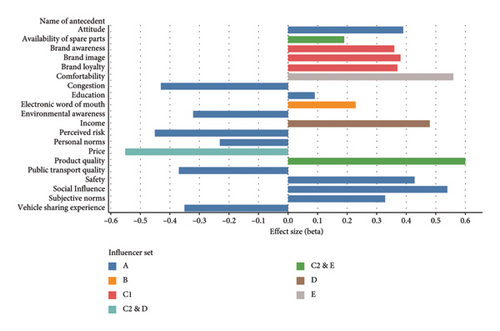
The antecedent product quality is the most important one for influencing API among potential customers, and this is looked at during the evaluation of alternatives and postproduct experience stages. This antecedent is followed by comfortability, reduction in price, safety features, brand loyalty, image, awareness, and availability of spare parts in their corresponding stages of the decision-making process. The practitioners can use this granularity of API knowledge as they reach out to their potential customers.
Conflicts of Interest
The authors declare no conflicts of interest.
Author Contributions
Anuradha Banerjee has contributed to conceptualization, data curation, formal analysis, investigation, validation, and preparation of the initial draft.
Basav Roychoudhury contributed to methodology, validation, visualization, and refinement of the draft for better representation, readability, and understanding.
Bidyut Jyoti Gogoi contributed to the methodology, validation, and refinement of the draft.
Funding
This work was not supported by any funding agency.
Endnotes
1https://web.ma.utexuds.edu (last accessed on 25th December, 2024).
Appendix 1
| Antecedent | Moderator | f2 | Nature of moderation | T–value |
|---|---|---|---|---|
| Annual household debt | After-sales service | 0.001 | Negligible | 2.772 |
| Age | 0.006 | Small | 2.116 | |
| Attachment | 0.016 | Medium | 12.210 | |
| Attitude | 0.003 | Negligible | 4.119 | |
| Availability of spare parts | 0.002 | Negligible | 5.424 | |
| Brand association | 0.002 | Negligible | 3.202 | |
| Brand awareness | 0.004 | Negligible | 2.091 | |
| Brand image | 0.004 | Negligible | 4.125 | |
| Brand loyalty | 0.004 | Negligible | 4.387 | |
| Comfortability | 0.001 | Negligible | 13.167 | |
| Comparative product quality | 0.003 | Negligible | 2.178 | |
| Congestion | 0.001 | Negligible | 2.567 | |
| Conspicuousness | 0.001 | Negligible | 3.191 | |
| Depreciation | 0.002 | Negligible | 2.708 | |
| Design | 0.002 | Negligible | 21.115 | |
| Discount | 0.005 | Small | 3.267 | |
| Distance to work | 0.004 | Negligible | 4.298 | |
| Ease of information acquisition | 0.002 | Negligible | 3.176 | |
| Easy installment | 0.011 | Medium | 1.989 | |
| Education | 0.005 | Small | 3.448 | |
| Electronic word of mouth | 0.002 | Negligible | 2.241 | |
| Engine horsepower | 0.004 | Negligible | 1.997 | |
| Entertainment | 0.001 | Negligible | 6.145 | |
| Environmental awareness | 0.002 | Negligible | 2.231 | |
| Epidemic severity | 0.004 | Negligible | 3.278 | |
| Fall in income | 0.004 | Negligible | 2.452 | |
| Fuel cost | 0.004 | Negligible | 4.775 | |
| Fuel efficiency | 0.002 | Negligible | 3.332 | |
| Gender | 0.015 | Medium | 2.136 | |
| Government policies | 0.002 | Negligible | 2.788 | |
| Hedonism | 0.002 | Negligible | 4.513 | |
| Highway building | 0.001 | Negligible | 10.977 | |
| Important life events | 0.001 | Negligible | 7.802 | |
| Income | 0.038 | Large | 4.886 | |
| Insurance | 0.001 | Negligible | 2.424 | |
| Lifestyle | 0.022 | Medium | 2.167 | |
| Maintenance cost | 0.004 | Negligible | 2.119 | |
| Parking diff. | 0.001 | Negligible | 3.781 | |
| Perceived risk | 0.001 | Negligible | 2.909 | |
| Personal norms | 0.002 | Negligible | 6.487 | |
| Persuasion capability | 0.003 | Negligible | 5.437 | |
| Pollution | 0.002 | Negligible | 3.499 | |
| Population density | 0.002 | Negligible | 3.219 | |
| Price | 0.031 | Large | 2.845 | |
| Product quality | 0.002 | Negligible | 6.081 | |
| Public transport quality | 0.001 | Negligible | 3.242 | |
| Quality of advertising | 0.001 | Negligible | 7.809 | |
| Rail transit | 0.004 | Negligible | 6.717 | |
| Resale value | 0.001 | Negligible | 1.998 | |
| Residential arrangement in the surrounding location | 0.001 | Negligible | 3.213 | |
| Rise in income | 0.041 | Large | 2.279 | |
| Road infrastructure | 0.003 | Negligible | 4.190 | |
| Safety | 0.002 | Negligible | 2.239 | |
| Social influence | 0.004 | Negligible | 2.211 | |
| Space | 0.002 | Negligible | 2.377 | |
| Subjective norms | 0.001 | Negligible | 4.102 | |
| Test driving facility | 0.001 | Negligible | 5.266 | |
| Traffic management | 0.002 | Negligible | 4.037 | |
| Travel time | 0.003 | Negligible | 6.115 | |
| Uniqueness | 0.002 | Negligible | 5.255 | |
| Vehicle sharing experience | 0.002 | Negligible | 2.832 | |
| Warranty condition | 0.004 | Negligible | 2.464 | |
| Weather condition | 0.003 | Negligible | 3.918 | |
| Design | After-sales service | 0.002 | Negligible | 3.776 |
| Age | 0.002 | Negligible | 4.132 | |
| Attachment | 0.002 | Negligible | 6.800 | |
| Annual household debt | 0.003 | Negligible | 3.679 | |
| Attitude | 0.001 | Negligible | 3.585 | |
| Availability of spare parts | 0.001 | Negligible | 5.266 | |
| Brand association | 0.002 | Negligible | 3.564 | |
| Brand awareness | 0.004 | Negligible | 2.244 | |
| Brand image | 0.001 | Negligible | 6.892 | |
| Brand loyalty | 0.003 | Negligible | 1.996 | |
| Comfortability | 0.002 | Negligible | 1.987 | |
| Comparative product quality | 0.003 | Negligible | 2.232 | |
| Congestion | 0.001 | Negligible | 3.821 | |
| Conspicuousness | 0.004 | Negligible | 2.366 | |
| Depreciation | 0.012 | Medium | 1.982 | |
| Discount | 0.002 | Negligible | 1.987 | |
| Distance to work | 0.003 | Negligible | 2.666 | |
| Ease of information acquisition | 0.001 | Negligible | 2.707 | |
| Easy installment | 0.001 | Negligible | 4.556 | |
| Education | 0.003 | Negligible | 5.101 | |
| Electronic word of mouth | 0.005 | Small | 7.766 | |
| Engine horsepower | 0.004 | Negligible | 2.591 | |
| Entertainment | 0.003 | Negligible | 3.918 | |
| Environmental awareness | 0.002 | Negligible | 3.768 | |
| Epidemic severity | 0.001 | Negligible | 2.132 | |
| Fall in income | 0.002 | Negligible | 2.229 | |
| Fuel cost | 0.003 | Negligible | 3.679 | |
| Fuel efficiency | 0.001 | Negligible | 3.585 | |
| Gender | 0.001 | Negligible | 4.233 | |
| Government policies | 0.001 | Negligible | 4.556 | |
| Hedonism | 0.003 | Negligible | 3.998 | |
| Highway building | 0.002 | Negligible | 2.001 | |
| Important life events | 0.004 | Negligible | 2.591 | |
| Income | 0.003 | Negligible | 3.918 | |
| Insurance | 0.004 | Negligible | 2.464 | |
| Lifestyle | 0.003 | Negligible | 3.918 | |
| Maintenance cost | 0.002 | Negligible | 3.776 | |
| Parking diff. | 0.001 | Negligible | 4.132 | |
| Perceived risk | 0.002 | Negligible | 6.800 | |
| Personal norms | 0.003 | Negligible | 3.679 | |
| Persuasion capability | 0.001 | Negligible | 3.585 | |
| Pollution | 0.001 | Negligible | 5.266 | |
| Population density | 0.001 | Negligible | 2.880 | |
| Price | 0.001 | Negligible | 4.342 | |
| Product quality | 0.004 | Negligible | 4.776 | |
| Public transport quality | 0.003 | Negligible | 5.489 | |
| Quality of advertising | 0.001 | Negligible | 3.811 | |
| Rail transit | 0.001 | Negligible | 1.999 | |
| Resale value | 0.003 | Negligible | 3.879 | |
| Residential arrangement in the surrounding location | 0.001 | Negligible | 4.121 | |
| Rise in income | 0.001 | Negligible | 6.266 | |
| Road infrastructure | 0.001 | Negligible | 2.887 | |
| Safety | 0.001 | Negligible | 4.389 | |
| Social influence | 0.004 | Negligible | 6.786 | |
| Space | 0.003 | Negligible | 5.455 | |
| Subjective norms | 0.001 | Negligible | 3.811 | |
| Test driving facility | 0.002 | Negligible | 2.844 | |
| Traffic management | 0.003 | Negligible | 3.194 | |
| Travel time | 0.001 | Negligible | 3.711 | |
| Uniqueness | 0.019 | Medium | 4.674 | |
| Vehicle sharing experience | 0.001 | Negligible | 2.884 | |
| Warranty condition | 0.001 | Negligible | 4.342 | |
| Weather condition | 0.004 | Negligible | 4.811 | |
| Space | After-sales service | 0.003 | Negligible | 5.632 |
| Age | 0.001 | Negligible | 3.891 | |
| Attachment | 0.002 | Negligible | 2.232 | |
| Annual household debt | 0.003 | Negligible | 3.821 | |
| Attitude | 0.002 | Negligible | 6.661 | |
| Availability of spare parts | 0.001 | Negligible | 1.982 | |
| Brand association | 0.004 | Negligible | 2.897 | |
| Brand awareness | 0.004 | Negligible | 2.668 | |
| Brand image | 0.002 | Negligible | 8.707 | |
| Brand loyalty | 0.003 | Negligible | 4.596 | |
| Comfortability | 0.001 | Negligible | 2.101 | |
| Comparative product quality | 0.004 | Negligible | 7.888 | |
| Congestion | 0.001 | Negligible | 2.591 | |
| Conspicuousness | 0.004 | Negligible | 3.917 | |
| Depreciation | 0.002 | Negligible | 4.768 | |
| Design | 0.007 | Small | 2.167 | |
| Discount | 0.001 | Negligible | 2.229 | |
| Distance to work | 0.001 | Negligible | 3.627 | |
| Ease of information acquisition | 0.001 | Negligible | 3.578 | |
| Easy installment | 0.004 | Negligible | 4.211 | |
| Education | 0.003 | Negligible | 4.956 | |
| Electronic word of mouth | 0.001 | Negligible | 3.998 | |
| Engine horsepower | 0.002 | Negligible | 2.001 | |
| Entertainment | 0.003 | Negligible | 2.591 | |
| Environmental awareness | 0.002 | Negligible | 3.918 | |
| Epidemic severity | 0.001 | Negligible | 2.464 | |
| Fall in income | 0.003 | Negligible | 3.918 | |
| Fuel cost | 0.004 | Negligible | 3.776 | |
| Fuel efficiency | 0.003 | Negligible | 4.132 | |
| Gender | 0.003 | Negligible | 6.800 | |
| Government policies | 0.001 | Negligible | 3.679 | |
| Hedonism | 0.003 | Negligible | 4.342 | |
| Highway building | 0.001 | Negligible | 4.811 | |
| Important life events | 0.004 | Negligible | 5.632 | |
| Income | 0.004 | Negligible | 3.866 | |
| Insurance | 0.001 | Negligible | 2.207 | |
| Lifestyle | 0.001 | Negligible | 3.371 | |
| Maintenance cost | 0.001 | Negligible | 5.457 | |
| Parking diff. | 0.002 | Negligible | 1.982 | |
| Perceived risk | 0.003 | Negligible | 3.444 | |
| Personal norms | 0.004 | Negligible | 2.119 | |
| Persuasion capability | 0.002 | Negligible | 2.233 | |
| Pollution | 0.003 | Negligible | 2.346 | |
| Population density | 0.002 | Negligible | 2.110 | |
| Price | 0.004 | Negligible | 6.969 | |
| Product quality | 0.004 | Negligible | 2.591 | |
| Public transport quality | 0.004 | Negligible | 3775 | |
| Quality of advertising | 0.002 | Negligible | 4.790 | |
| Rail transit | 0.003 | Negligible | 1.998 | |
| Resale value | 0.001 | Negligible | 2.245 | |
| Residential arrangement in the surrounding location | 0.004 | Negligible | 3.918 | |
| Rise in income | 0.004 | Negligible | 3.776 | |
| Road infrastructure | 0.004 | Negligible | 4.132 | |
| Safety | 0.003 | Negligible | 3.918 | |
| Social influence | 0.002 | Negligible | 3.776 | |
| Subjective norms | 0.004 | Negligible | 4.132 | |
| Test driving facility | 0.004 | Negligible | 6.800 | |
| Traffic management | 0.004 | Negligible | 3.679 | |
| Travel time | 0.002 | Negligible | 3.585 | |
| Uniqueness | 0.003 | Negligible | 5.266 | |
| Vehicle sharing experience | 0.001 | Negligible | 3.564 | |
| Warranty condition | 0.004 | Negligible | 2.244 | |
| Weather condition | 0.004 | Negligible | 6.892 | |
| Distance to work | After-sales service | 0.004 | Negligible | 1.996 |
| Age | 0.001 | Negligible | 1.987 | |
| Attachment | 0.002 | Negligible | 2.232 | |
| Annual household debt | 0.001 | Negligible | 3.821 | |
| Attitude | 0.001 | Negligible | 2.366 | |
| Availability of spare parts | 0.003 | Negligible | 1.982 | |
| Brand association | 0.004 | Negligible | 1.987 | |
| Brand awareness | 0.004 | Negligible | 2.666 | |
| Brand image | 0.002 | Negligible | 2.707 | |
| Brand loyalty | 0.003 | Negligible | 4.556 | |
| Comfortability | 0.001 | Negligible | 5.101 | |
| Comparative product quality | 0.004 | Negligible | 7.766 | |
| Congestion | 0.004 | Negligible | 2.591 | |
| Conspicuousness | 0.004 | Negligible | 3.918 | |
| Depreciation | 0.001 | Negligible | 3.768 | |
| Design | 0.002 | Negligible | 2.132 | |
| Discount | 0.003 | Negligible | 2.229 | |
| Ease of information acquisition | 0.001 | Negligible | 3.679 | |
| Easy installment | 0.004 | Negligible | 3.585 | |
| Education | 0.004 | Negligible | 4.233 | |
| Electronic word of mouth | 0.004 | Negligible | 4.556 | |
| Engine horsepower | 0.001 | Negligible | 3.998 | |
| Entertainment | 0.002 | Negligible | 2.001 | |
| Environmental awareness | 0.001 | Negligible | 2.591 | |
| Epidemic severity | 0.001 | Negligible | 3.918 | |
| Fall in income | 0.003 | Negligible | 2.464 | |
| Fuel cost | 0.001 | Negligible | 3.918 | |
| Fuel efficiency | 0.009 | Medium | 3.776 | |
| Gender | 0.004 | Negligible | 4.132 | |
| Government policies | 0.004 | Negligible | 6.800 | |
| Hedonism | 0.001 | Negligible | 3.679 | |
| Highway building | 0.006 | Small | 3.585 | |
| Important life events | 0.002 | Negligible | 5.266 | |
| Income | 0.003 | Negligible | 2.889 | |
| Insurance | 0.001 | Negligible | 4.111 | |
| Lifestyle | 0.004 | Negligible | 25.176 | |
| Maintenance cost | 0.014 | Medium | 5.489 | |
| Parking diff. | 0.002 | Negligible | 5.444 | |
| Perceived risk | 0.003 | Negligible | 1.993 | |
| Personal norms | 0.001 | Negligible | 3.456 | |
| Persuasion capability | 0.004 | Negligible | 2.121 | |
| Pollution | 0.004 | Negligible | 6.266 | |
| Population density | 0.004 | Negligible | 11.989 | |
| Price | 0.011 | Medium | 4.187 | |
| Product quality | 0.002 | Negligible | 4.322 | |
| Public transport quality | 0.001 | Negligible | 3.261 | |
| Quality of advertising | 0.001 | Negligible | 3.886 | |
| Rail transit | 0.003 | Negligible | 2.841 | |
| Resale value | 0.004 | Negligible | 7.792 | |
| Residential arrangement in the surrounding location | 0.001 | Negligible | 4.269 | |
| Rise in income | 0.003 | Negligible | 4.115 | |
| Road infrastructure | 0.005 | Small | 2.761 | |
| Safety | 0.003 | Negligible | 2.784 | |
| Social influence | 0.003 | Negligible | 4.887 | |
| Space | 0.001 | Negligible | 7.732 | |
| Subjective norms | 0.003 | Negligible | 3.891 | |
| Test driving facility | 0.004 | Negligible | 4.676 | |
| Traffic management | 0.003 | Negligible | 3.821 | |
| Travel time | 0.004 | Negligible | 7.109 | |
| Uniqueness | 0.004 | Negligible | 1.980 | |
| Vehicle sharing experience | 0.003 | Negligible | 1.999 | |
| Warranty condition | 0.004 | Negligible | 2.668 | |
| Weather condition | 0.008 | Small | 9.719 | |
| Fall in income | After-sales service | 0.001 | Negligible | 2.557 |
| Age | 0.001 | Negligible | 3.872 | |
| Attachment | 0.008 | Small | 3.918 | |
| Annual household debt | 0.004 | Negligible | 3.455 | |
| Attitude | 0.004 | Negligible | 17.918 | |
| Availability of spare parts | 0.004 | Negligible | 5.171 | |
| Brand association | 0.003 | Negligible | 3.189 | |
| Brand awareness | 0.004 | Negligible | 5.610 | |
| Brand image | 0.003 | Negligible | 3.619 | |
| Brand loyalty | 0.003 | Negligible | 4.166 | |
| Comfortability | 0.003 | Negligible | 6.786 | |
| Comparative product quality | 0.003 | Negligible | 6.119 | |
| Congestion | 0.002 | Negligible | 4.299 | |
| Conspicuousness | 0.002 | Negligible | 2.207 | |
| Depreciation | 0.004 | Negligible | 2.257 | |
| Design | 0.001 | Negligible | 5.778 | |
| Discount | 0.002 | Negligible | 1.977 | |
| Distance to work | 0.001 | Negligible | 3.444 | |
| Ease of information acquisition | 0.003 | Negligible | 5.912 | |
| Easy installment | 0.002 | Negligible | 5.214 | |
| Education | 0.002 | Negligible | 2.346 | |
| Electronic word of mouth | 0.003 | Negligible | 7.270 | |
| Engine horsepower | 0.002 | Negligible | 6.969 | |
| Entertainment | 0.002 | Negligible | 22.591 | |
| Environmental awareness | 0.004 | Negligible | 2.109 | |
| Epidemic severity | 0.001 | Negligible | 3.166 | |
| Fuel cost | 0.002 | Negligible | 2.990 | |
| Fuel efficiency | 0.001 | Negligible | 2.245 | |
| Gender | 0.001 | Negligible | 2.267 | |
| Government policies | 0.002 | Negligible | 17.112 | |
| Hedonism | 0.004 | Negligible | 1.999 | |
| Highway building | 0.001 | Negligible | 4.179 | |
| Important life events | 0.002 | Negligible | 3.132 | |
| Income | 0.026 | Large | 6.233 | |
| Insurance | 0.002 | Negligible | 6.959 | |
| Lifestyle | 0.002 | Negligible | 4.400 | |
| Maintenance cost | 0.004 | Negligible | 3.585 | |
| Parking diff. | 0.001 | Negligible | 3.123 | |
| Perceived risk | 0.002 | Negligible | 3.564 | |
| Personal norms | 0.002 | Negligible | 2.244 | |
| Persuasion capability | 0.002 | Negligible | 3.760 | |
| Pollution | 0.004 | Negligible | 7.059 | |
| Population density | 0.001 | Negligible | 7.675 | |
| Price | 0.012 | Medium | 2.232 | |
| Product quality | 0.001 | Negligible | 4.727 | |
| Public transport quality | 0.003 | Negligible | 1.998 | |
| Quality of advertising | 0.002 | Negligible | 1.982 | |
| Rail transit | 0.002 | Negligible | 6.667 | |
| Resale value | 0.004 | Negligible | 2.190 | |
| Residential arrangement in the surrounding location | 0.001 | Negligible | 2.707 | |
| Rise in income | 0.002 | Negligible | 3.812 | |
| Road infrastructure | 0.001 | Negligible | 13.172 | |
| Safety | 0.003 | Negligible | 8.788 | |
| Social influence | 0.002 | Negligible | 3.534 | |
| Space | 0.002 | Negligible | 3.918 | |
| Subjective norms | 0.003 | Negligible | 3.532 | |
| Test driving facility | 0.002 | Negligible | 6.199 | |
| Traffic management | 0.002 | Negligible | 3.107 | |
| Travel time | 0.004 | Negligible | 3.679 | |
| Uniqueness | 0.001 | Negligible | 6.223 | |
| Vehicle sharing experience | 0.002 | Negligible | 8.102 | |
| Warranty condition | 0.001 | Negligible | 7.158 | |
| Weather condition | 0.001 | Negligible | 3.998 | |
Open Research
Data Availability Statement
The data that support the findings of this study are available on request from the corresponding author. The data are not publicly available due to privacy or ethical restrictions.


